
More project photos (3)

The problem
Signature-based intrusion detection only catches attacks it already knows: every novel exploit, zero-day or mutated worm sails past the rule list until someone writes a new signature. Meanwhile security teams cannot hand-label enough traffic to train supervised classifiers on every new threat. Unsupervised anomaly detection addresses exactly this gap by modeling normal behavior and flagging whatever deviates — no attack labels needed at training time. This project builds that detector on the NSL-KDD benchmark (Canadian Institute for Cybersecurity; 125,973 training connections, 41 features, Normal/DoS/Probe/R2L/U2R classes): preprocessing and encoding, Isolation Forest training on normal traffic, anomaly scoring of the KDDTest+ set (22,544 connections, including 17 attack subtypes never seen in training), threshold tuning, per-attack-family analysis, and a demo console that simulates a live connection stream with real-time flagging.
Watches the live console, tunes the threshold and reviews flagged flows.
How it works
- KDDTrain+ (125,973 connections, 41 features) is loaded; protocol_type, service and flag are encoded, numeric features standardized, and the label-derived difficulty column is dropped.
- An Isolation Forest is trained on the normal-traffic subset, learning the shape of legitimate connections; the contamination parameter sets the expected anomaly share.
- Each KDDTest+ connection (22,544 records, including 17 attack subtypes absent from training) is scored by mean isolation path length — shorter paths mean more anomalous.
- A threshold converts scores into alerts; the notebook sweeps it to plot detection rate against false positive rate and picks an operating point.
- Performance is broken down by attack family (DoS, Probe, R2L, U2R) plus ROC-AUC, and a one-class SVM baseline is evaluated identically for comparison.
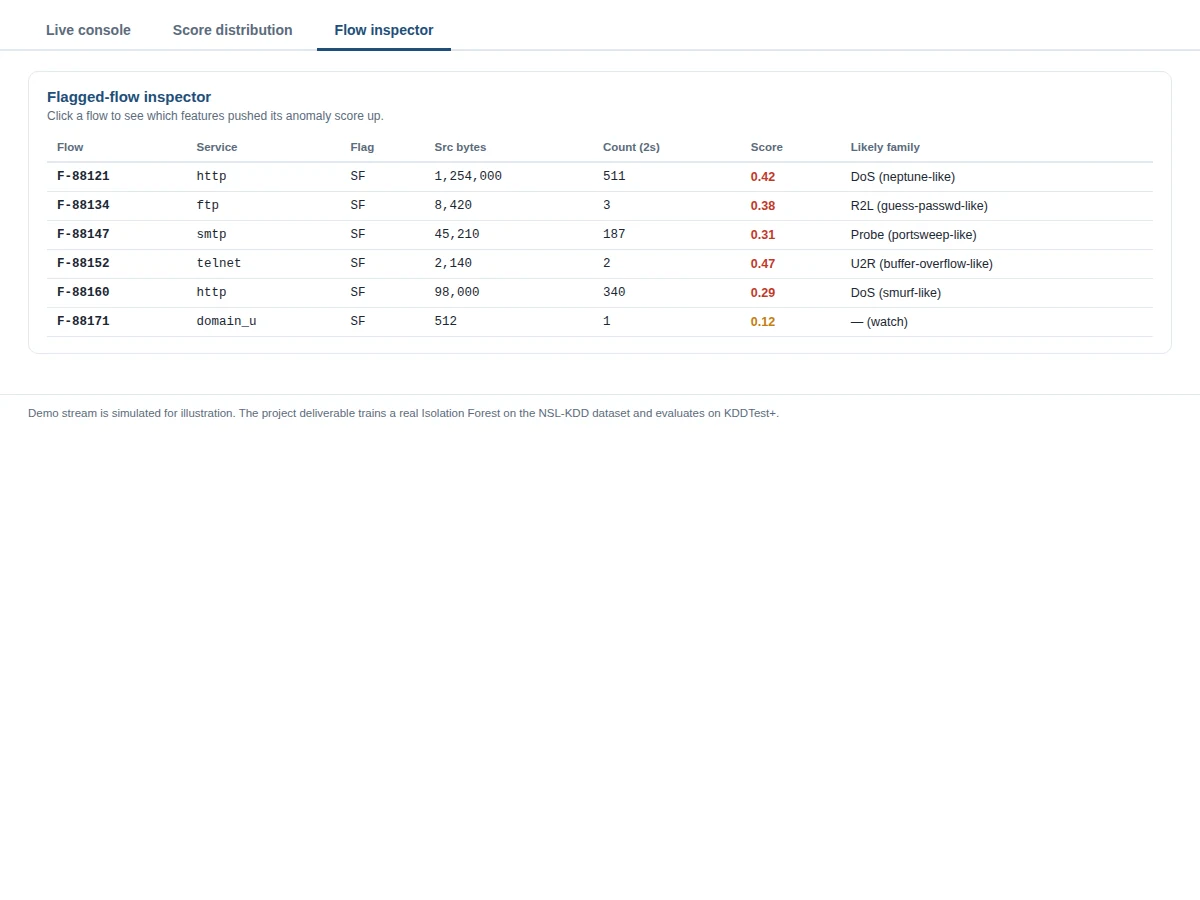
- The demo console streams simulated connections through the same scoring logic, flagging suspicious flows live with per-flow feature contributions.
Tech stack:
- Python 3.10, scikit-learn (Isolation Forest, One-Class SVM, metrics)
- pandas, NumPy (connection tables and scoring)
- Matplotlib, Seaborn (score distributions, ROC curves, family breakdown)
- Jupyter notebook (buyer-run training and evaluation)
- Streamlit demo app (traffic console, threshold tuner, dashboards)
| Parameter | Value |
|---|---|
| Model | Isolation Forest (scikit-learn), trained on normal traffic; one-class SVM baseline |
| Dataset | NSL-KDD — KDDTrain+ 125,973 connections for training, KDDTest+ 22,544 for evaluation (CIC) |
| Features | 41 connection features (basic, content, time-based, host-based groups) |
| Classes | Normal, DoS, Probe, R2L, U2R; 17 test-set attack subtypes unseen in training |
| Scoring | Mean isolation path length converted to an anomaly score |
| Evaluation | Detection rate, false positive rate, ROC-AUC, per-family breakdown — computed on your build by the notebook |
| Design target | Detection rate around 90% at a low single-digit false positive rate; a development target, not a guaranteed result |
| Output | Per-connection anomaly score, alert decision, contributing features |
| Inference | Live simulated console in the demo app plus batch scoring of connection logs |
Project features
- [NSL-KDD data pipeline] Loads KDDTrain+ (125,973 connections, 41 features), encodes protocol, service and flag fields, standardizes numerics, and drops the label-derived difficulty column that must never be used as a feature.
- [Isolation Forest training] Trains the forest on normal traffic only, with the contamination parameter exposed for tuning; anomaly scores derive from mean isolation path length.
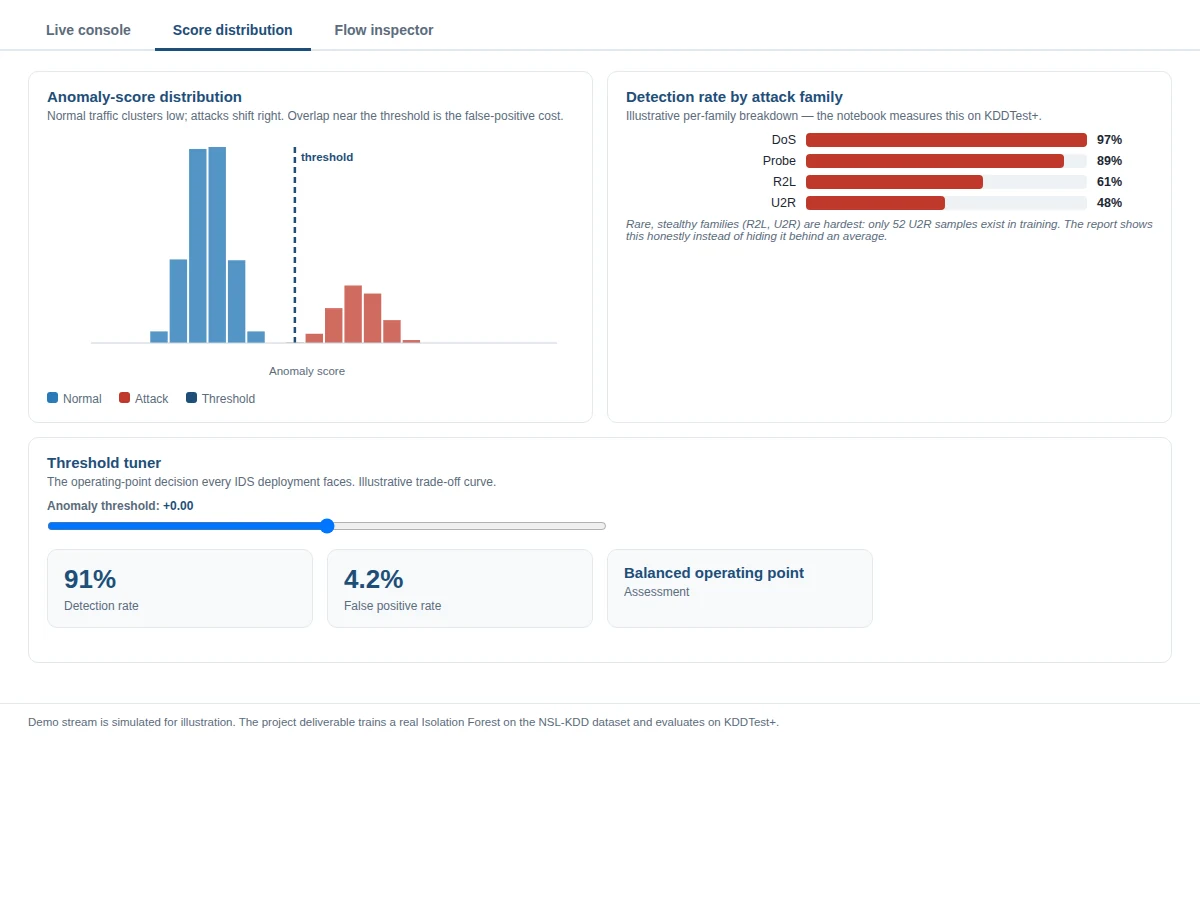
- [Anomaly score distribution view] Plots the score distributions of normal versus attack traffic so the separation — and the overlap that causes false positives — is visible.
- [Live traffic console] A simulated connection stream in the demo (timestamp, source, port, protocol, bytes, duration) with each flow scored and suspicious ones flagged and badged in real time.
- [Attack-family breakdown] Detection performance split by DoS, Probe, R2L and U2R, showing honestly which families the unsupervised approach catches and which it struggles with.
- [Threshold tuner] Move the anomaly threshold and watch detection rate versus false positive rate move — the operating-point decision every IDS deployment faces.
- [One-class SVM baseline] A second unsupervised baseline trained and evaluated identically, compared on detection rate, false positive rate and ROC-AUC.
- [Alert export] Exports flagged connections with scores and top contributing features to a review file for an analyst-style workflow.
What is included
- Complete source code (data pipeline, training, evaluation, demo app)
- Jupyter training and evaluation notebook (buyer-run procedure on NSL-KDD)
- Project report PDF (background, methodology, per-family analysis, evaluation, error analysis)
- PPT presentation for final review
- Viva Q&A preparation document (Isolation Forest, anomaly scores, contamination, ROC trade-offs, IDS concepts)
- Setup guide (environment, dataset download, running the notebook and demo)
Advantages
- Unsupervised by design: the Isolation Forest trains on normal traffic only, so it needs no labelled attack examples to start flagging suspicious flows.
- Built on the NSL-KDD benchmark of 125,973 training connections with 41 features, with results measured on the 22,544-connection KDDTest+ set, so metrics are comparable and reproducible.
- Anomaly scores come from mean isolation path length, and the score-distribution view makes the separation, and the overlap that causes false positives, visible.
- The live traffic console simulates a connection stream and flags suspicious flows in real time, with a threshold tuner that trades detection rate against false positives.
- The attack-family breakdown reports detection separately for DoS, Probe, R2L and U2R, showing honestly which families the approach catches and which it struggles with.
- A one-class SVM baseline trained and evaluated identically, plus alert export with scores and contributing features, gives the report a genuine comparison and an analyst-style workflow.
Disadvantages
- NSL-KDD derives from simulated 1999-era traffic and does not represent modern encrypted, cloud or IoT traffic, so results are a teaching benchmark, not a deployment claim.
- Unsupervised detection produces false positives by design, and every alert needs analyst review; the report shows the false positive cost openly.
- Rare attack families are hard: the training set contains only 52 U2R samples, so expectations for that family must stay modest.
- The base build simulates the live stream; wiring real packet capture, such as CICFlowMeter-style flow extraction, is an optional extension, not included.
- Network behaviour drifts over time, so a deployed model would need periodic retraining, and the pipeline does not retrain itself.
Limitations & prerequisites
- NSL-KDD derives from simulated 1999-era traffic; it does not represent modern encrypted, cloud or IoT traffic, so results are a teaching benchmark, not a deployment claim.
- Unsupervised detection produces false positives by design — every alert needs analyst review, and the report shows the false positive cost openly.
- Rare attack families are hard: the training set contains only 52 U2R samples, so expectations for that family must stay modest.
- The base build simulates the live stream; wiring real packet capture (e.g. CICFlowMeter-style flow extraction) is an optional extension, not included.
- Network behavior drifts over time, so a deployed model would need periodic retraining — the pipeline does not retrain itself.
Frequently Asked Questions
Which dataset is used?
NSL-KDD from the Canadian Institute for Cybersecurity: KDDTrain+ (125,973 connections) for training and KDDTest+ (22,544 connections) for evaluation, each with 41 features. It is the standard teaching benchmark for intrusion detection, and its test set contains 17 attack subtypes never seen in training.
How does Isolation Forest find attacks without labels?
It recursively splits connections on random features. Attacks are few and different, so they get isolated in very few splits; normal connections need many. The average path length across the forest becomes the anomaly score — short path, suspicious connection.
Is the detection rate guaranteed?
No. The design target is a detection rate near 90% at a low single-digit false positive rate — realistic for this method on NSL-KDD — but the notebook measures the actual detection rate, false positive rate and ROC-AUC on your build, and the report documents those numbers.
Can it catch zero-day attacks?
That is the point of the unsupervised approach: it flags deviations from normal rather than matching known signatures, so novel attack types can be caught. The 17 unseen attack subtypes in KDDTest+ let the report demonstrate exactly this.
Which attacks does it struggle with?
Rare, stealthy families: R2L and especially U2R, which have very few training samples and resemble normal traffic closely. The per-family breakdown in the report shows this honestly instead of hiding it behind an average.
Does it capture real network traffic?
The base build scores connection records and simulates the live stream in the demo console. Wiring real packet capture and flow-feature extraction is a realistic extension the report lists under future scope.
Suitable for B.E./B.Tech final-year projects in Computer Science, AI/ML and Data Science.
Components & software requirements
- Python 3.10, scikit-learn (Isolation Forest, One-Class SVM, metrics)
- pandas, NumPy (connection tables and scoring)
- Matplotlib, Seaborn (score distributions, ROC curves, family breakdown)
- Jupyter notebook (buyer-run training and evaluation)
- Streamlit demo app (traffic console, threshold tuner, dashboards)
Delivery information
Built-to-order project. Delivery timeline is shared after order confirmation based on current queue.
Support terms
Complete documentation, setup guide, and viva preparation included. Support for setup and explanation provided.
Download free synopsis (PDF)
Enter your name and WhatsApp number — the synopsis PDF downloads immediately. We may send occasional project updates on WhatsApp; no spam.