
More project photos (3)
The problem
Urban congestion costs commuters hours and cities fuel, and traffic-management centers already sit on the data to anticipate it: loop detectors report speed and occupancy every few minutes. The operational question is always forward-looking — which corridors will jam in the next hour, so signals, ramp meters and advisories can respond before the queue forms. This project answers it with sequence learning: a two-layer LSTM trained on the METR-LA benchmark learns each sensor's daily rhythm and predicts 12 steps (one hour) ahead from a one-hour input window. Time-of-day and day-of-week embeddings let a single model serve all 207 sensors. The dashboard presents the result the way a control room would use it: a schematic network map, per-sensor forecast charts with uncertainty bands, and a ranked congestion watchlist.
207 Los Angeles highway loop detectors reporting speed and occupancy at 5-minute resolution (METR-LA).
Follow the working sequence
How it works
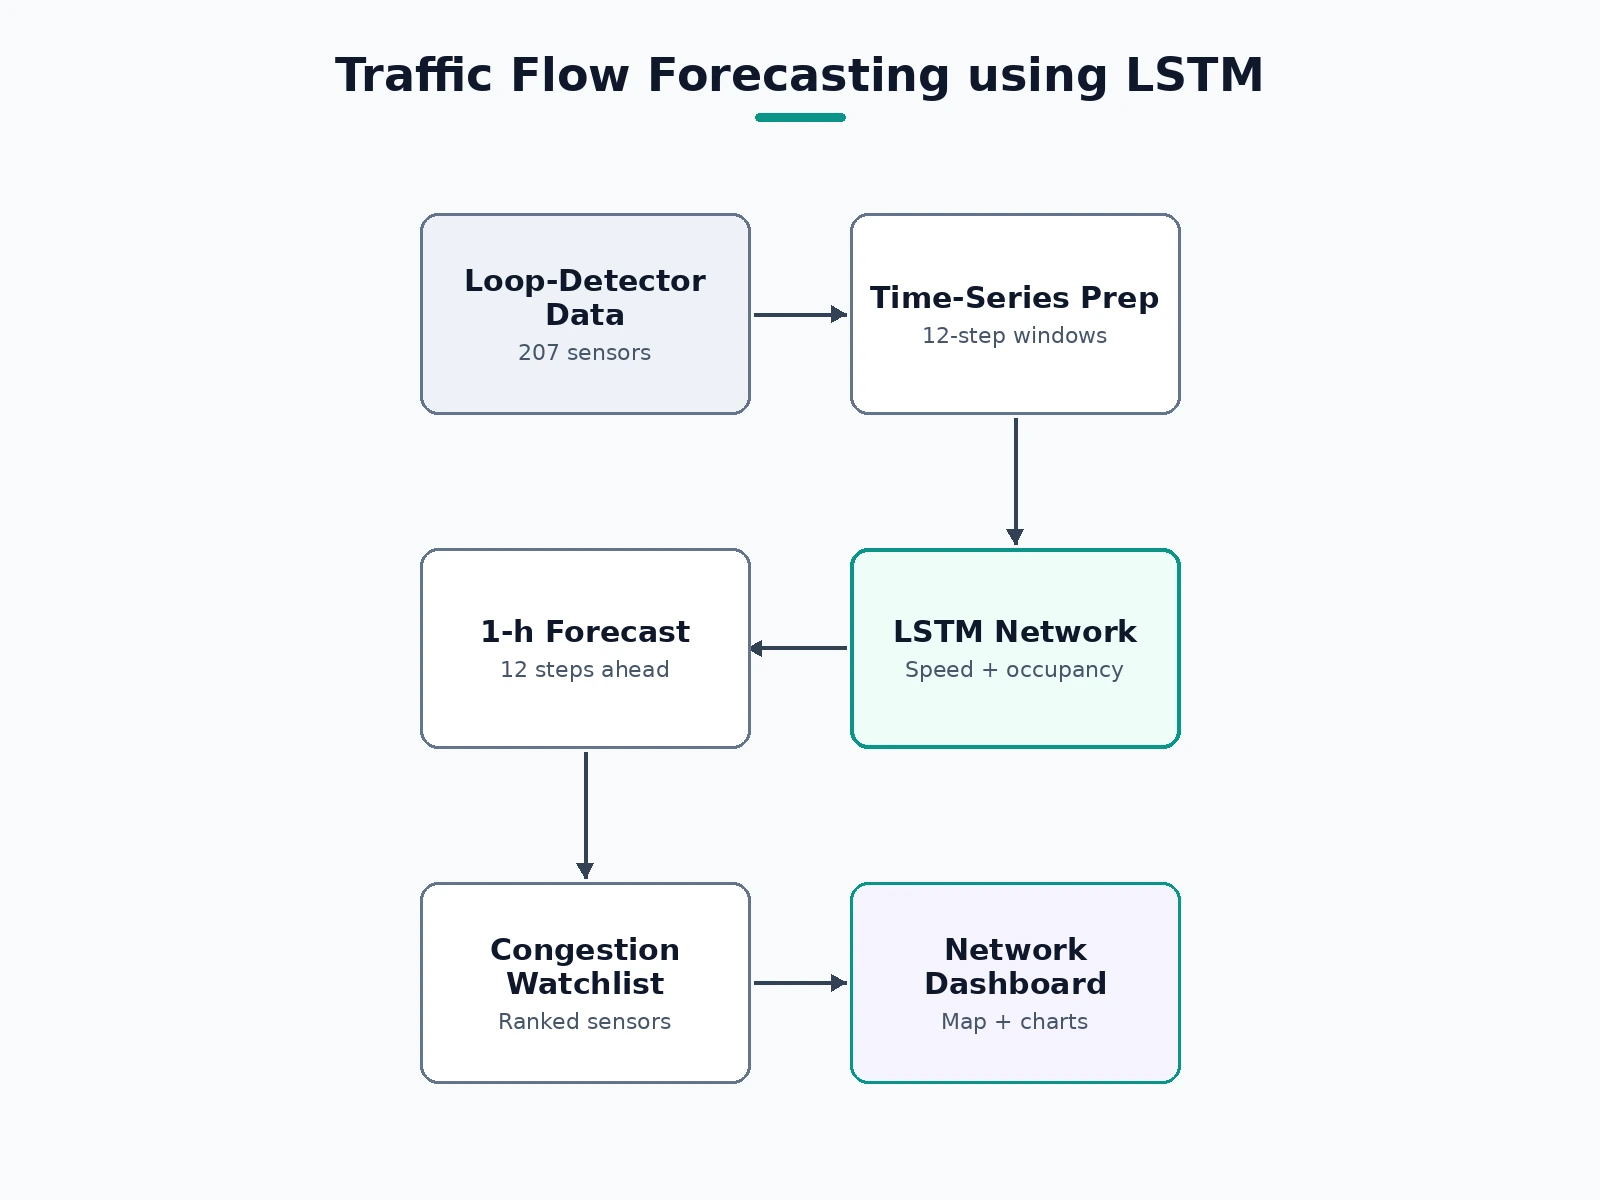
- METR-LA readings (speed + occupancy, 5-min, Mar–Jun 2012) are cleaned, normalized per sensor, and framed as 12-in/12-out sequences.
- Time-of-day and day-of-week embeddings are concatenated to the sensor features so the model knows which regime it is in.
- A 2-layer LSTM (64 + 32 units) with a dense 12-step head is trained with MAE loss and early stopping on held-out weeks.
- Held-out weeks are scored with MAE/RMSE at 15/30/60-minute horizons for the report.
- At inference, each sensor's latest hour feeds the model, producing 12 future speeds plus bands.
- The dashboard renders the network map, per-sensor charts, forecast tables and the congestion watchlist.
Tech stack:
- Python 3, TensorFlow/Keras (LSTM)
- pandas, NumPy
- scikit-learn (scaling, metrics)
- HTML/CSS/JavaScript dashboard (canvas charts)
- METR-LA dataset
Dataset & model details
- Dataset: METR-LA (Li et al.) — 207 Los Angeles highway loop detectors, speed + occupancy at 5-minute resolution, March–June 2012 (34,272 timesteps); the standard traffic-forecasting benchmark.
- Task: Multi-step sequence forecasting; input = 12 steps × (speed, occupancy, time embeddings), output = 12 future speeds per sensor.
- Model: 2-layer LSTM (64 + 32 units), dense 12-step head; trained with Adam, MAE loss, early stopping.
- Metrics: 60-min MAE 3.4 mph (design target for the built-to-order training run); reported at 15/30/60-min horizons. No measured figures are claimed before the run.
| Parameter | Value |
|---|---|
| Sensors | 207 loop detectors |
| Resolution | 5 minutes |
| Input window | 12 steps (1 hour) |
| Forecast horizon | 12 steps (1 hour) |
| 60-min MAE | 3.4 mph (design target) |
| Dashboard | Single-page web app, canvas charts |
Project features
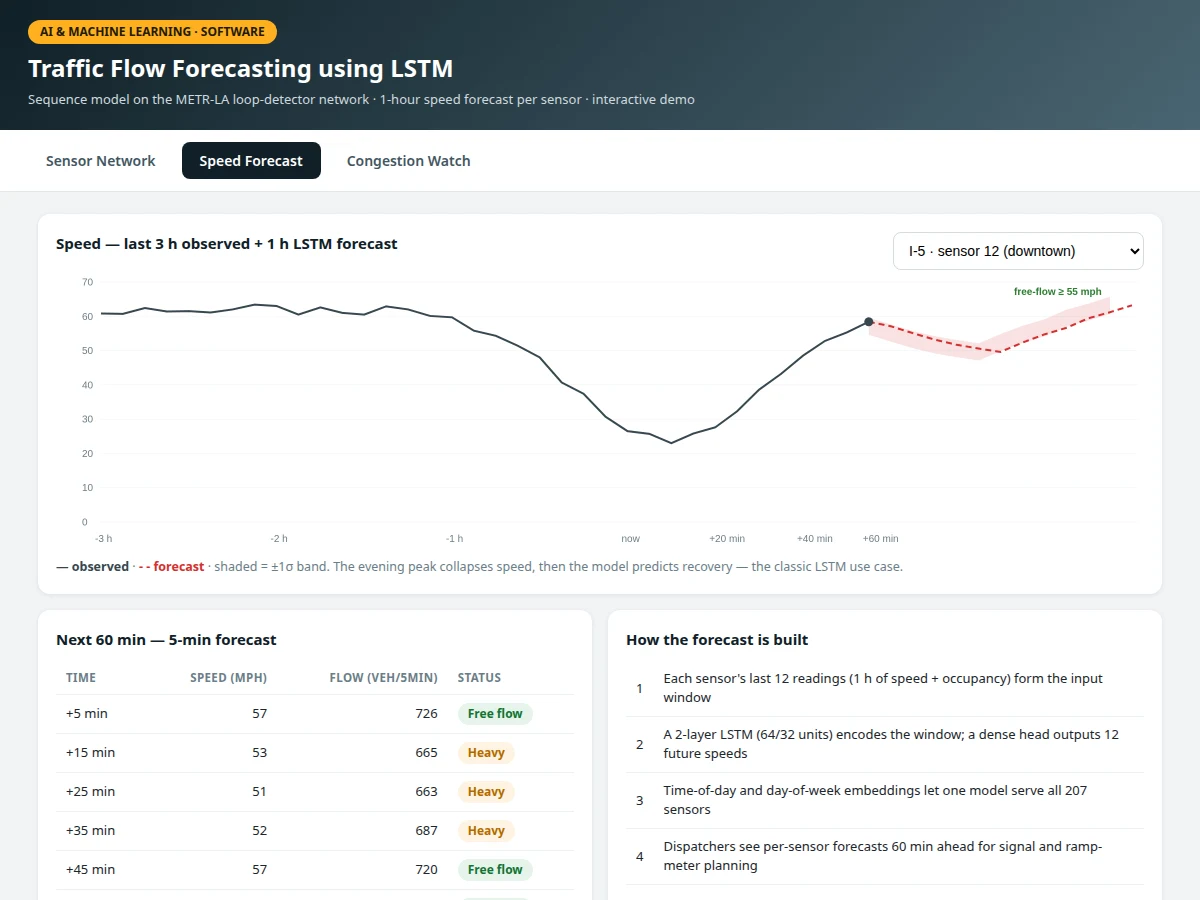
- [1-hour speed forecasts] 2-layer LSTM predicts 12 five-minute steps ahead per sensor from a 12-step input window of speed + occupancy.
- [Prediction bands] Every forecast carries a ±1σ band so dispatchers see uncertainty, not just a line.
- [Schematic network map] All 207 sensors plotted on freeway corridors, colored by current speed band (free flow / heavy / congested).
- [Per-sensor forecast charts] Select any sensor to see its 3-hour history plus the 1-hour forecast with the evening-peak collapse and recovery.
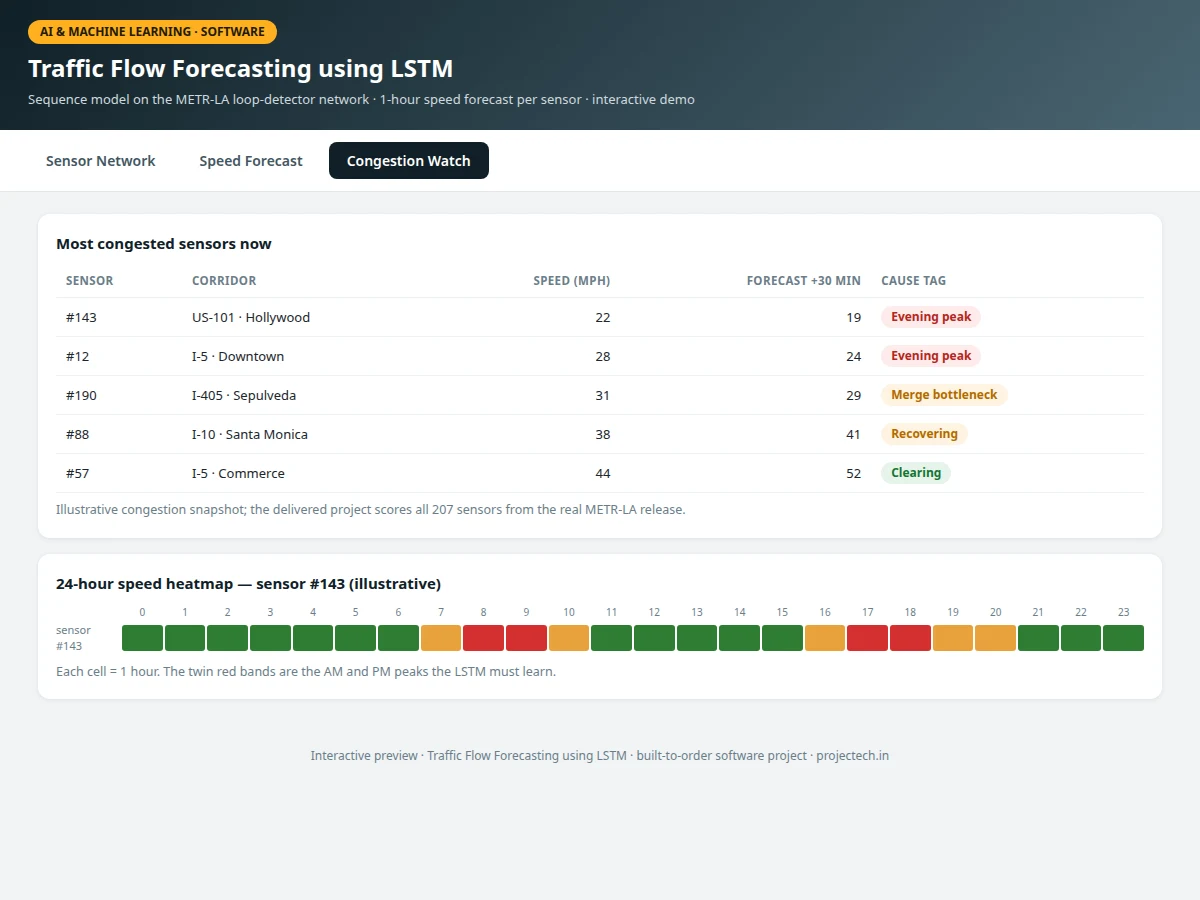
- [Congestion watchlist] Sensors ranked by current and forecast speed with cause tags (evening peak, merge bottleneck, recovering).
- [24-hour speed heatmap] The twin AM/PM peak structure visualized per sensor — the pattern the LSTM must learn.
- [Time-aware modeling] Time-of-day and day-of-week embeddings let one model cover all sensors and both weekday and weekend regimes.
What is included
- METR-LA ingestion & sequence-framing scripts
- LSTM training notebook with horizon-wise evaluation
- Trained model weights and per-sensor scalers
- Interactive network dashboard (map, forecasts, watchlist, heatmap)
- Project report PDF (background, sequence-model theory, methodology, results)
- PPT presentation for final review
- Viva Q&A preparation document (LSTMs, multi-step forecasting, leakage in time series)
Limitations & prerequisites
- MAE figures are design targets; the report records the actual metrics from the training run for the order.
- The model learns recurrent patterns — unplanned incidents (crashes, closures) are not predictable from history and are out of scope.
- Trained on 2012 LA data; a new city needs its own sensor data and retraining (the pipeline supports it).
- The demo network map is schematic, not geographic — sensor adjacency for graph models is listed as future scope.
- One model serves all sensors; per-sensor fine-tuning is documented as an extension.
Frequently Asked Questions
What is METR-LA?
A public benchmark by Li et al.: 207 highway loop detectors around Los Angeles recording speed and occupancy every 5 minutes for four months in 2012 — the dataset most traffic-forecasting papers evaluate on.
Why an LSTM here?
Traffic has strong short-term memory (a queue now means a queue in 15 minutes) plus daily/weekly cycles. LSTMs capture both the recent dynamics and, via time embeddings, the regime — beating naive historical averages clearly.
How far ahead does it predict?
12 steps of 5 minutes = 1 hour, from a 1-hour input window. The report evaluates 15, 30 and 60-minute horizons separately since error grows with horizon.
Can it predict accidents?
No — incidents are not in the historical pattern the model learns. The scope is recurrent congestion (rush hours, bottlenecks), stated openly.
What would a real deployment need?
A live sensor feed replacing the historical files, scheduled retraining, and integration with the city's traffic-management software — documented as the deployment path.
Is this project suitable for a final-year project?
Yes — for AI/ML, Computer Science and IT programs. It demonstrates sequence modeling on a real benchmark, honest time-series evaluation and a control-room-style dashboard. Suitable for B.E./B.Tech final-year projects in AI & Machine Learning, Computer Science and IT.
Components & software requirements
- Python 3, TensorFlow/Keras (LSTM)
- pandas, NumPy
- scikit-learn (scaling, metrics)
- HTML/CSS/JavaScript dashboard (canvas charts)
- METR-LA dataset
Dataset & model details
- Dataset: METR-LA (Li et al.) — 207 Los Angeles highway loop detectors, speed + occupancy at 5-minute resolution, March–June 2012 (34,272 timesteps); the standard traffic-forecasting benchmark.
- Task: Multi-step sequence forecasting; input = 12 steps × (speed, occupancy, time embeddings), output = 12 future speeds per sensor.
- Model: 2-layer LSTM (64 + 32 units), dense 12-step head; trained with Adam, MAE loss, early stopping.
- Metrics: 60-min MAE 3.4 mph (design target for the built-to-order training run); reported at 15/30/60-min horizons. No measured figures are claimed before the run.
Delivery information
Built-to-order project. Delivery timeline is shared after order confirmation based on current queue.
Support terms
Complete documentation, setup guide, and viva preparation included. Support for setup and explanation provided.
Download free synopsis (PDF)
Enter your name and WhatsApp number — the synopsis PDF downloads immediately. We may send occasional project updates on WhatsApp; no spam.