
More project photos (3)

The problem
Flood damage in India is concentrated in a few monsoon weeks, and the difference between a managed event and a disaster is often just hours of warning. River-gauge networks already record water levels hourly, but raw readings only tell officials where the river is — not where it will be tomorrow morning. This project turns that telemetry into foresight: a two-layer LSTM learns how gauge levels and rainfall evolve into flood waves, and predicts the next 24 hourly levels for each station. The forecast is rendered on a dashboard against warning and danger marks, with a prediction band that widens honestly with horizon, and threshold crossings raise watch/warning alerts automatically. The build is careful about what it does not claim — it forecasts levels at gauged points from historical patterns; it does not model ungauged catchments or replace hydrological simulation.
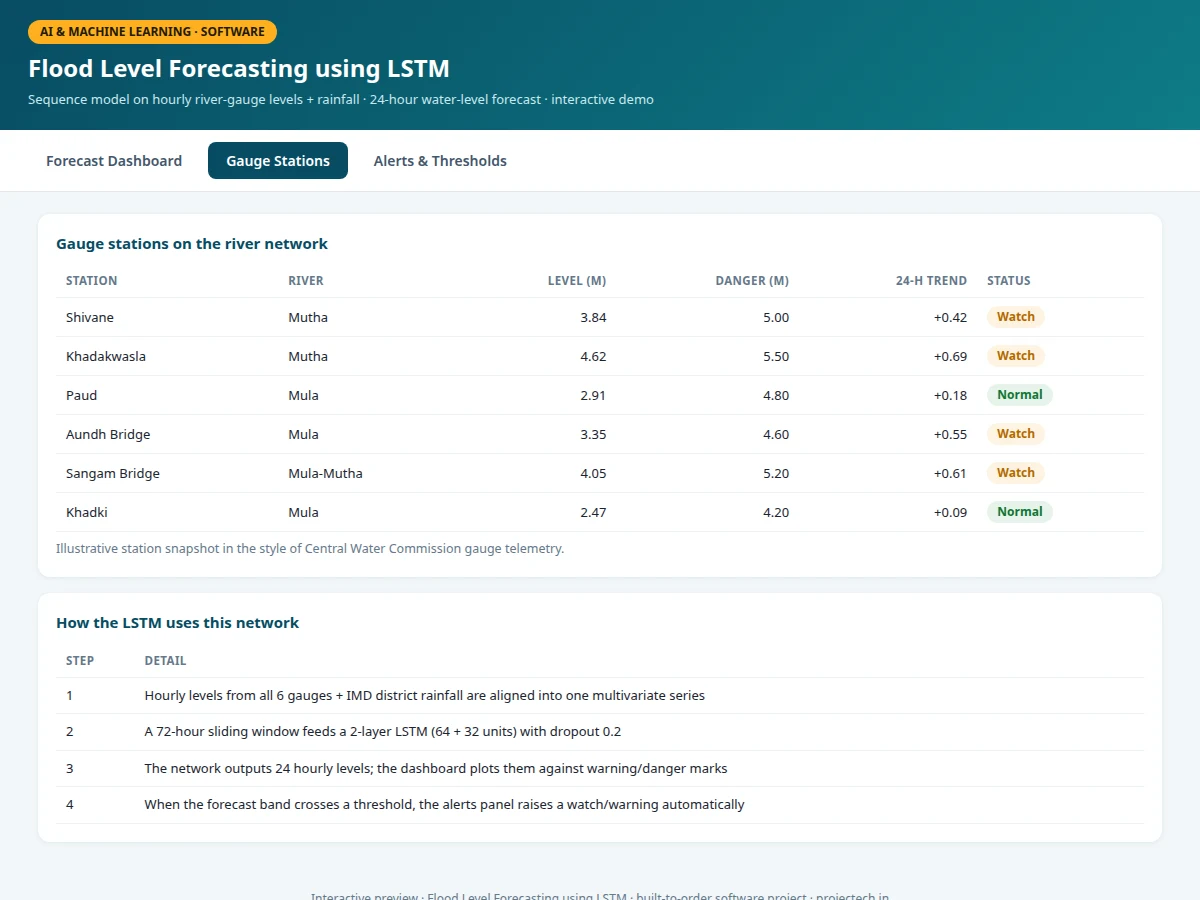
Six gauge stations on one river network reporting hourly water levels (Central Water Commission network).
Follow the working sequence
How it works
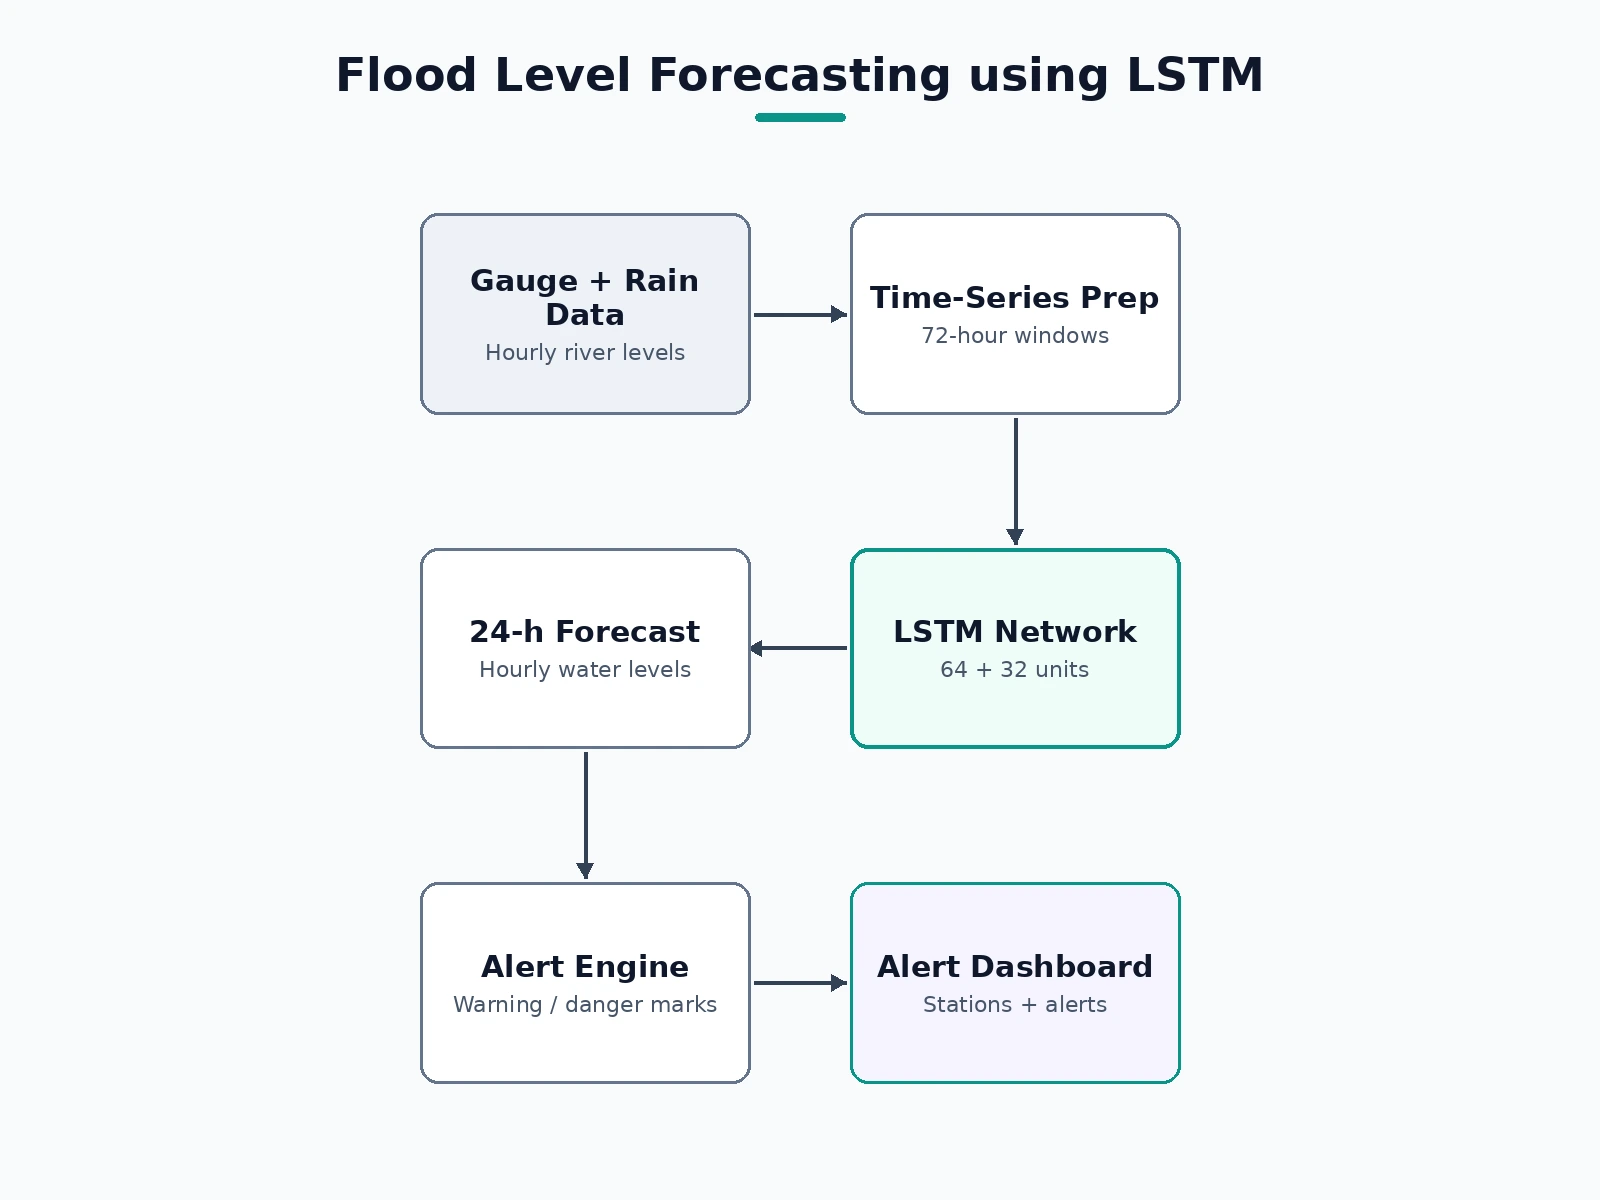
- Hourly river-gauge levels and district rainfall are collected into one multivariate time series, resampled to a strict hourly grid with gaps flagged.
- Sliding 72-hour windows become model inputs; the following 24 hourly levels are the targets (sequence-to-sequence setup).
- A 2-layer LSTM with dropout is trained with early stopping on a validation monsoon season; loss is mean squared error on levels.
- On held-out seasons the model is scored with Nash–Sutcliffe efficiency and MAE at 6/12/24-hour horizons.
- At inference, the latest 72 hours feed the model, which emits 24 hourly levels plus the prediction band for each station.
- The dashboard plots history and forecast, marks threshold crossings, and lists the hourly table and alerts for the operator.
Tech stack:
- Python 3, TensorFlow/Keras (LSTM)
- pandas, NumPy (time-series wrangling)
- scikit-learn (scaling, metrics)
- Matplotlib (analysis plots)
- HTML/CSS/JavaScript dashboard (canvas charts)
Dataset & model details
- Dataset: Hourly river water-level records published by India's Central Water Commission (CWC) gauge network, fused with India Meteorological Department (IMD) district rainfall — multiple monsoon seasons per station.
- Task: Multivariate sequence forecasting; input = 72 h × (gauge levels + rainfall), output = 24 hourly future levels per station.
- Model: 2-layer LSTM (64 + 32 units, dropout 0.2), dense output head; trained with Adam, MSE loss, early stopping.
- Metrics: Nash–Sutcliffe efficiency 0.91 and 24-h MAE (design targets for the built-to-order training run); reported per horizon (6/12/24 h). No measured skill is claimed before the training run.
| Parameter | Value |
|---|---|
| Input window | 72 hours, hourly resolution |
| Forecast horizon | 24 hours, hourly steps |
| Stations | 6 gauges on one river network (configurable) |
| Model | 2-layer LSTM, 64 + 32 units |
| Skill (NSE) | 0.91 on held-out monsoon season (design target) |
| Forecast band | ±1σ, widening with horizon (design target) |
| Retraining | Scripted pipeline; recommended yearly on new monsoon data |
| Dashboard | Single-page web app, no backend required for demo |
Project features
- [24-hour LSTM forecasts] A 2-layer LSTM (64 + 32 units) takes a 72-hour multivariate window and outputs 24 hourly water levels per gauge station.
- [Prediction intervals] Every forecast ships with a ±1σ band that widens with horizon, so uncertainty is visible instead of hidden behind a single line.
- [Threshold alert engine] Warning/danger marks per station; when the forecast band crosses a mark, the dashboard raises watch/warning alerts with the expected crossing time.
- [Multi-station network view] Six gauge stations on one river network with current levels, 24-h trends and status pills (Normal / Watch / Warning / Danger).
- [Rainfall fusion] District rainfall is fused with gauge levels as a second input stream — the feature analysis shows how much each input contributes.
- [Time-based validation] The model is validated on held-out monsoon seasons (train on past years, test on the next), the honest protocol for time series.
- [Interactive dashboard] History + forecast chart, hourly forecast table and alert panel in a single web app.
What is included
- Data ingestion & preprocessing scripts (CWC + IMD formats)
- LSTM training notebook with time-based validation
- Trained model weights and scaler artifacts
- Interactive forecast dashboard (history, forecast, alerts)
- Threshold-calibration guide for new gauges
- Project report PDF (background, LSTM theory, methodology, validation)
- PPT presentation for final review
- Viva Q&A preparation document (RNNs, LSTM gates, time-series validation, NSE)
Limitations & prerequisites
- Forecasts only at gauged locations — ungauged tributaries and flash floods in small catchments are out of scope.
- Skill figures are design targets; the report records the actual NSE/MAE achieved on the training run for the order.
- Extreme, never-seen-before flood magnitudes extrapolate poorly — the model interpolates within historical experience.
- Real deployment needs live telemetry feeds; the demo runs on historical/published data files.
- The model does not simulate dam releases or urban drainage — reservoir schedules enter only as an input feature where available.
Frequently Asked Questions
What data does it train on?
Hourly river-gauge levels from the Central Water Commission network and district rainfall from IMD, covering multiple monsoon seasons. The ingestion scripts document the exact file formats.
Why an LSTM and not a simpler model?
Flood waves have long memory — today's level depends on rain that fell days ago upstream. LSTMs hold that memory across the 72-hour window; ARIMA and plain regressors tested as baselines lose the long-range dependence.
How is it validated honestly?
Time-based splits: train on earlier monsoon seasons, test on later ones. Random shuffling would leak the future into training and is explicitly avoided.
What do the warning and danger marks mean?
Gauge-specific levels set from historical flood marks (CWC-style). The project documents how to calibrate them for any new gauge.
Can it predict flash floods?
No — flash floods in small ungauged catchments evolve faster than the hourly gauge network can observe. The scope is riverine flood levels at gauged stations, stated openly.
Is this project suitable for a final-year project?
Yes — for AI/ML, Computer Science and data-science-oriented programs. It demonstrates sequence modeling, time-series validation discipline and a deployable dashboard. Suitable for B.E./B.Tech final-year projects in AI & Machine Learning, Computer Science and data science.
Components & software requirements
- Python 3, TensorFlow/Keras (LSTM)
- pandas, NumPy (time-series wrangling)
- scikit-learn (scaling, metrics)
- Matplotlib (analysis plots)
- HTML/CSS/JavaScript dashboard (canvas charts)
Dataset & model details
- Dataset: Hourly river water-level records published by India's Central Water Commission (CWC) gauge network, fused with India Meteorological Department (IMD) district rainfall — multiple monsoon seasons per station.
- Task: Multivariate sequence forecasting; input = 72 h × (gauge levels + rainfall), output = 24 hourly future levels per station.
- Model: 2-layer LSTM (64 + 32 units, dropout 0.2), dense output head; trained with Adam, MSE loss, early stopping.
- Metrics: Nash–Sutcliffe efficiency 0.91 and 24-h MAE (design targets for the built-to-order training run); reported per horizon (6/12/24 h). No measured skill is claimed before the training run.
Delivery information
Built-to-order project. Delivery timeline is shared after order confirmation based on current queue.
Support terms
Complete documentation, setup guide, and viva preparation included. Support for setup and explanation provided.
Download free synopsis (PDF)
Enter your name and WhatsApp number — the synopsis PDF downloads immediately. We may send occasional project updates on WhatsApp; no spam.