
More project photos (2)
The problem
WiFi Analyzer Android App with Channel Graph and Signal Strength is an Android app that answers a question every home and hostel faces: why is Wi-Fi slow in one room and fine in another. Most people guess — restart the router, move closer, or buy a repeater — because the phone's Wi-Fi settings show a network name and signal bars, never the channel, the band, or the strength in dBm. The real cause is often invisible: neighbouring routers sharing the same 2.4 GHz channel, so packets collide and retry even though the signal looks strong. A channel graph makes that crowding visible, and a live signal meter in dBm turns 'walk around until it feels faster' into a measurement the student can record and explain. This project builds that analyzer as a real Android app on the platform's own WifiManager scan results, teaching Android permissions, background scanning, and signal measurement on a tool the student can genuinely use at home.
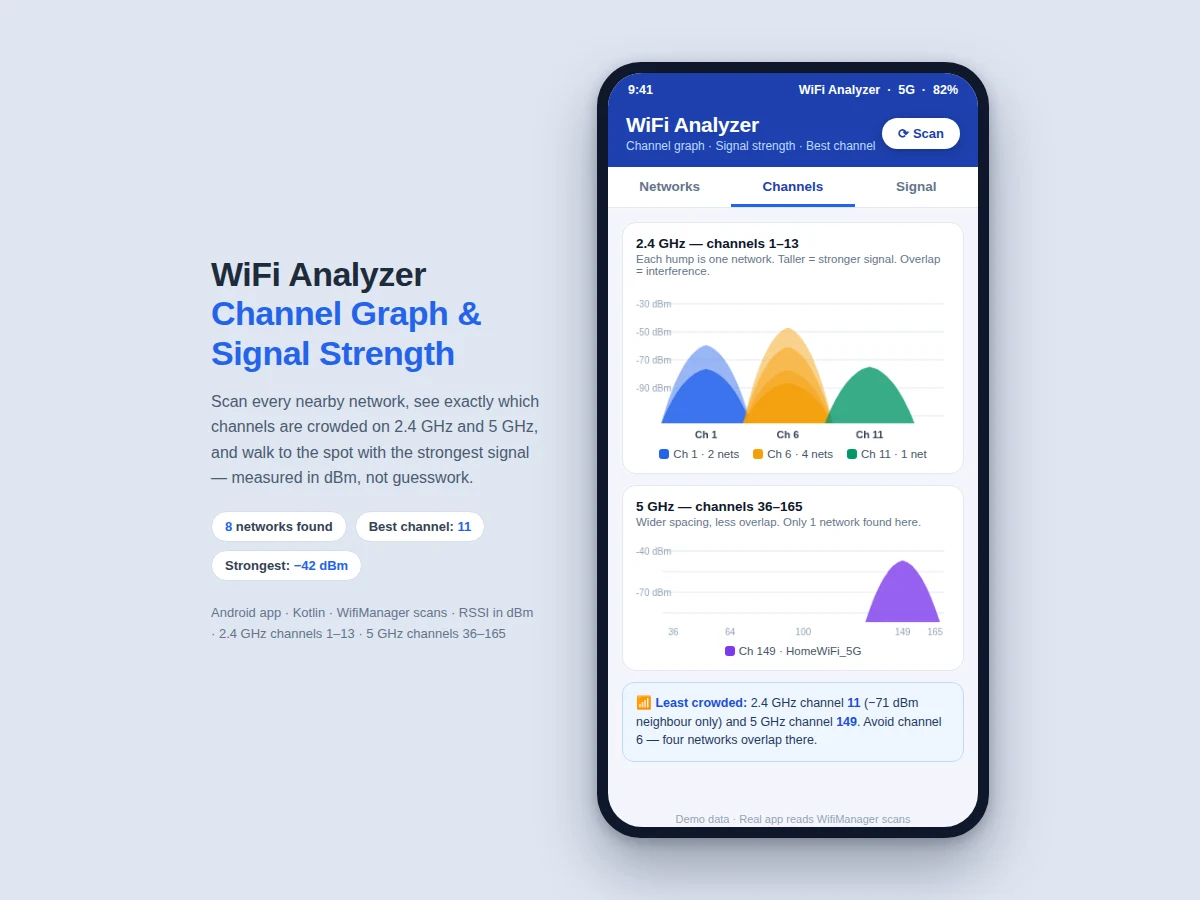
Builder note from the build: the working demo built for this listing holds 8 sample networks in one scan — 7 on 2.4 GHz and 1 on 5 GHz — and the channel graph shows 4 of the 7 overlapping on channel 6, the exact crowding the best-channel recommendation (channel 11) avoids. The scan code is written so the first scan runs only after location permission is granted, because on Android 10 and above WifiManager returns an empty result list without it — the single most common reason a student demo shows no networks found.
Android API returns ScanResult list with SSID, channel and RSSI.
Follow the working sequence
How it works
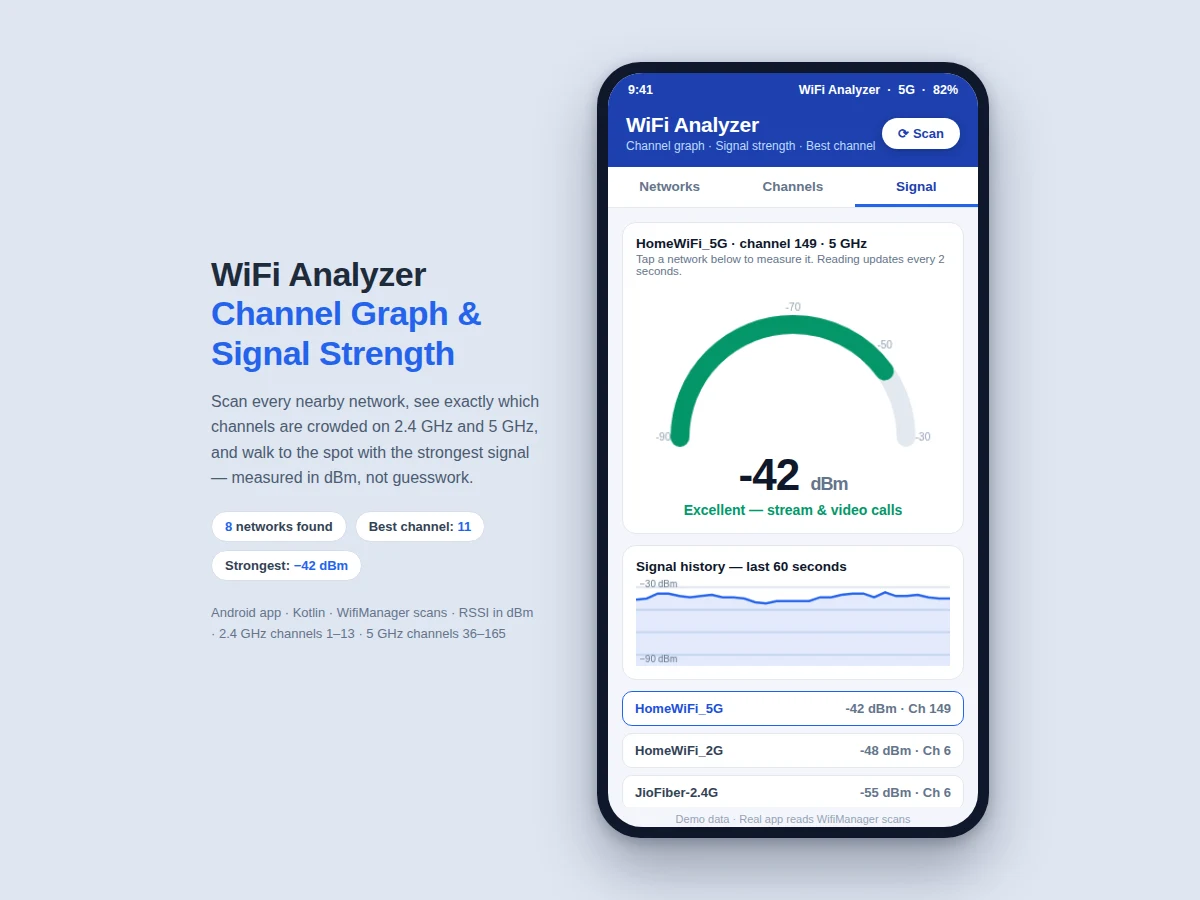
From tapping Scan to a channel recommendation takes four stages a student can trace and test. The app first asks for the location permission Android requires for Wi-Fi scanning, then calls WifiManager to start a scan and reads the ScanResult list the system returns — each entry carrying the SSID, BSSID, frequency, channel, and RSSI in dBm. The app converts each frequency to its channel number (2.4 GHz channels 1–13, 5 GHz channels 36–165), groups the results by channel, and draws the channel graph with one curve per network, taller where the signal is stronger. A ranking step counts overlapping networks per channel and recommends the least crowded one, while the signal meter polls the currently connected network's RSSI every 2 seconds and plots it on a 60-second history trace. All of this runs on the phone itself: no server, no account, and no data leaves the device.
- The user grants location permission, which Android 10 and above requires before any app can read Wi-Fi scan results.
- Tapping Scan calls WifiManager to start a scan; the system returns a ScanResult list with SSID, BSSID, frequency and RSSI in dBm for each network found.
- The app converts each network's frequency to its channel number and groups the results by band — 2.4 GHz channels 1–13 and 5 GHz channels 36–165.
- The channel graph is drawn with one curve per network, taller where the signal is stronger, so overlapping networks on the same channel are visible at a glance.
- The recommendation step counts overlapping networks on each channel and picks the least crowded one, breaking ties by the weakest neighbouring signal.
- The signal meter polls the selected network's RSSI approximately every 2 seconds and plots it on a 60-second history trace, with a quality label from Excellent to Poor.
Tech stack:
- Kotlin
- Jetpack Compose
- Android WifiManager API
- Android Studio
- Material Design 3
- Kotlin coroutines · background scans
- Jetpack Compose Canvas · channel graph
- Gradle · Android build
| Parameter | Value |
|---|---|
| Platform | Android 10 and above · API level 29 and above |
| Scan API | WifiManager startScan · ScanResult list (Android framework) |
| Bands covered | 2.4 GHz channels 1–13 · 5 GHz channels 36–165 |
| Signal display range | −30 dBm to −90 dBm (RSSI, measured by the device) |
| Signal meter refresh | Approximately 2-second interval (Expected) |
| History trace | 60-second rolling window · approximately 30 samples (Design target) |
| Demo scan list | 8 networks in the demo scan (Illustration) |
| Channel width | 20 MHz per 2.4 GHz channel (Standard value) |
| Best-channel rule | Fewest overlapping networks · then weakest neighbour RSSI (Algorithm) |
| Permissions | Location permission · required on Android 10 and above for scan results |
Project features
The app stands on four capabilities. First, the network scanner: one tap lists every network in range with its SSID, band, channel, signal strength in dBm, and security type, so the student sees the full radio environment instead of the two or three networks the settings screen shows. Second, the channel graph: overlapping curves for 2.4 GHz channels 1–13 and a separate 5 GHz view show exactly where networks pile up, and the app recommends the least crowded channel for the user's own router. Third, the signal meter: a live gauge and a 60-second history trace turn RSSI into a number the student can walk around with, finding the strongest spot in a room or the dead zone behind a wall. Fourth, open-network flagging: networks with no password are marked clearly, so the app also teaches why an open hotspot is a risk. Together these turn a phone into a measurement instrument for the invisible radio environment around it.
- [Network scanner] One tap on Scan lists every network in range with SSID, band, channel, signal strength in dBm and security type (WPA2, WPA3 or Open), sorted strongest first — implemented in the base build.
- [2.4 GHz channel graph] Overlapping curves for channels 1–13 show which channels are crowded; taller curves mean stronger signals, and the graph marks the channel with the fewest overlapping networks — implemented in the base build.
- [5 GHz channel graph] A separate view for 5 GHz channels 36–165 shows the wider spacing and lower overlap of the 5 GHz band, with its own least-crowded recommendation — implemented in the base build.
- [Live signal meter] A gauge shows the selected network's RSSI in dBm, refreshed approximately every 2 seconds, with a 60-second history trace so the student can watch the signal change as they move — implemented in the base build.
- [Best-channel recommendation] The app counts overlapping networks per channel and recommends the least crowded one, breaking ties by the weakest neighbouring signal, so the advice is a calculation, not a guess — implemented in the base build.
- [Open-network flagging] Networks with no password are marked Open in the list, so the student can see at a glance which nearby networks anyone can join — implemented in the base build.
- [Signal quality labels] Each reading is labelled Excellent, Good, Fair or Poor from its dBm value, with a plain-language note on what the level is good for, from video calls to basic browsing — implemented in the base build.
What is included
- Complete Android source code in Kotlin with Jetpack Compose (scanner, channel graphs, signal meter, recommendation logic)
- Working demo app with the network list, 2.4 GHz and 5 GHz channel graphs, and live signal meter
- Setup guide: Android Studio build steps, permission handling, and how to run the app on a real phone
- Project report PDF (Wi-Fi bands and channels, dBm and RSSI, scan API, channel-overlap reasoning, honest measurement limits)
- PPT presentation for final review
- Viva Q&A preparation document (why location permission is needed, what dBm means, why channels 1, 6 and 11 matter, what the graph proves)
- Build timeline of approximately 3–4 weeks from confirmed scope, with setup guidance after delivery
- Support for setup and explanation included after delivery
Limitations & prerequisites
- Android scan throttling: Android 9 and above limits each app to 4 scans per 2-minute period, so rapid repeated scans are paced by the system, not by the app.
- Location permission is mandatory: on Android 10 and above, WifiManager returns an empty result list without location permission, so the app cannot show networks until it is granted.
- RSSI varies with position and orientation: holding the phone differently or standing behind a wall changes the reading by several dBm, so comparisons must be made from the same spot.
- Hidden networks show no SSID: networks that hide their name appear without an SSID in the scan results, and the app cannot reveal it.
- The app cannot change the router's channel: the recommendation is advice for the user to apply in the router's own settings; the app has no access to the router.
- 5 GHz range is shorter than 2.4 GHz: a 5 GHz network can read weaker than a 2.4 GHz one from the same router simply because the higher band is absorbed more by walls, not because the router is faulty.
Frequently Asked Questions
Is this project suitable for a final-year project?
Yes, for Computer Science, IT and Electronics & Telecommunication programmes, because it combines Android development, a real platform API, signal measurement in dBm, and a visible data-visualisation problem (the channel graph) into one working app with a clear review thread around why a channel is crowded.
Why does the app need location permission?
Because Android 10 and above treats Wi-Fi scan results as location data — nearby network names can reveal where the phone is — so WifiManager returns an empty list without it. The app asks for the permission before the first scan and explains why, and no location is stored or sent anywhere.
What does dBm mean, and what is a good value?
dBm measures signal power on a logarithmic scale where values closer to zero are stronger: around −30 dBm to −50 dBm is excellent, −50 dBm to −60 dBm is good, −60 dBm to −70 dBm is fair, and below −70 dBm is poor. A 10 dBm difference means a tenfold difference in power, which is why the meter shows dBm instead of bars.
How does the channel graph help choose a router channel?
Each curve is one network, taller where its signal is stronger, so a tall pile of curves on one channel means several routers are competing there. The app counts the overlap and recommends the channel with the fewest networks; on 2.4 GHz the only fully non-overlapping choices are channels 1, 6 and 11, so the recommendation is usually one of those three.
Can the app change my router's channel itself?
No. The app only measures and recommends; changing the channel has to be done in the router's own admin page, which the report explains step by step, so the student can apply the recommendation in a minute once the scan is done. The app has no access to the router, and that boundary is part of the design — it is a measurement tool, not a router controller.
Does the app need internet, and does it send my data anywhere?
No to both. Scanning, graphing and the signal meter all run on the phone using the Android Wi-Fi APIs, with no server and no account, so no scan result, SSID or location ever leaves the device and the app works fully offline.
Components & software requirements
- Kotlin
- Jetpack Compose
- Android WifiManager API
- Android Studio
- Material Design 3
- Kotlin coroutines · background scans
- Jetpack Compose Canvas · channel graph
- Gradle · Android build
Delivery information
Built-to-order project. Delivery timeline is shared after order confirmation based on current queue.
Support terms
Complete documentation, setup guide, and viva preparation included. Support for setup and explanation provided.
Download free synopsis (PDF)
Enter your name and WhatsApp number — the synopsis PDF downloads immediately. We may send occasional project updates on WhatsApp; no spam.