
More project photos (2)
The problem
Canteens, banks, ticket counters and clinics all suffer the same problem: queues build silently until customers are already angry, and staff only react when someone complains. The cameras are already on the ceiling — what is missing is software that watches them. Counting people in a queue is harder than it looks: perspective shrinks distant people, crowds occlude each other, and a naive detector misses half the line. This project uses the density-map approach from crowd-counting research — a CSRNet-style CNN regresses a per-pixel density map whose integral is the count, which handles occlusion far better than bounding-box detectors. Counts inside each configured ROI feed a wait-time estimator (Little's-law style, calibrated per counter), and the dashboard shows live counts, wait times, hourly trends and threshold alerts.
How it works
- CCTV frames (or recorded footage) are ingested per camera and the operator draws ROI polygons over each service line once during setup.
- Each frame's ROI crop is passed through the density-map CNN, which outputs a per-pixel density map; integrating it gives the people count.
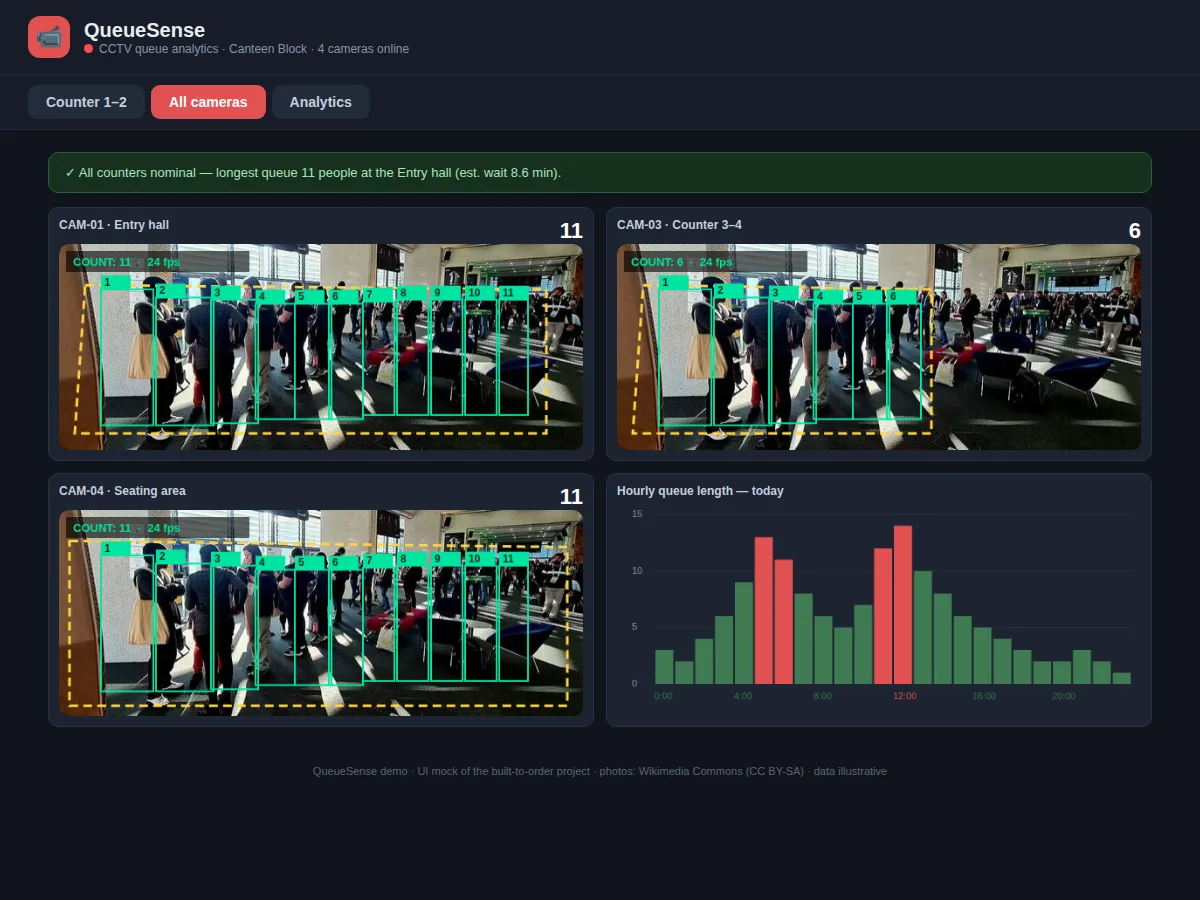
- Person bounding boxes from a lightweight detector are overlaid for visualization, while the density integral remains the authoritative count.
- A per-counter service rate (people served per minute, calibrated from historical data) converts the count into an estimated wait time.
- The dashboard polls the pipeline and renders live counts, wait times, alert banners and the hourly trend chart.
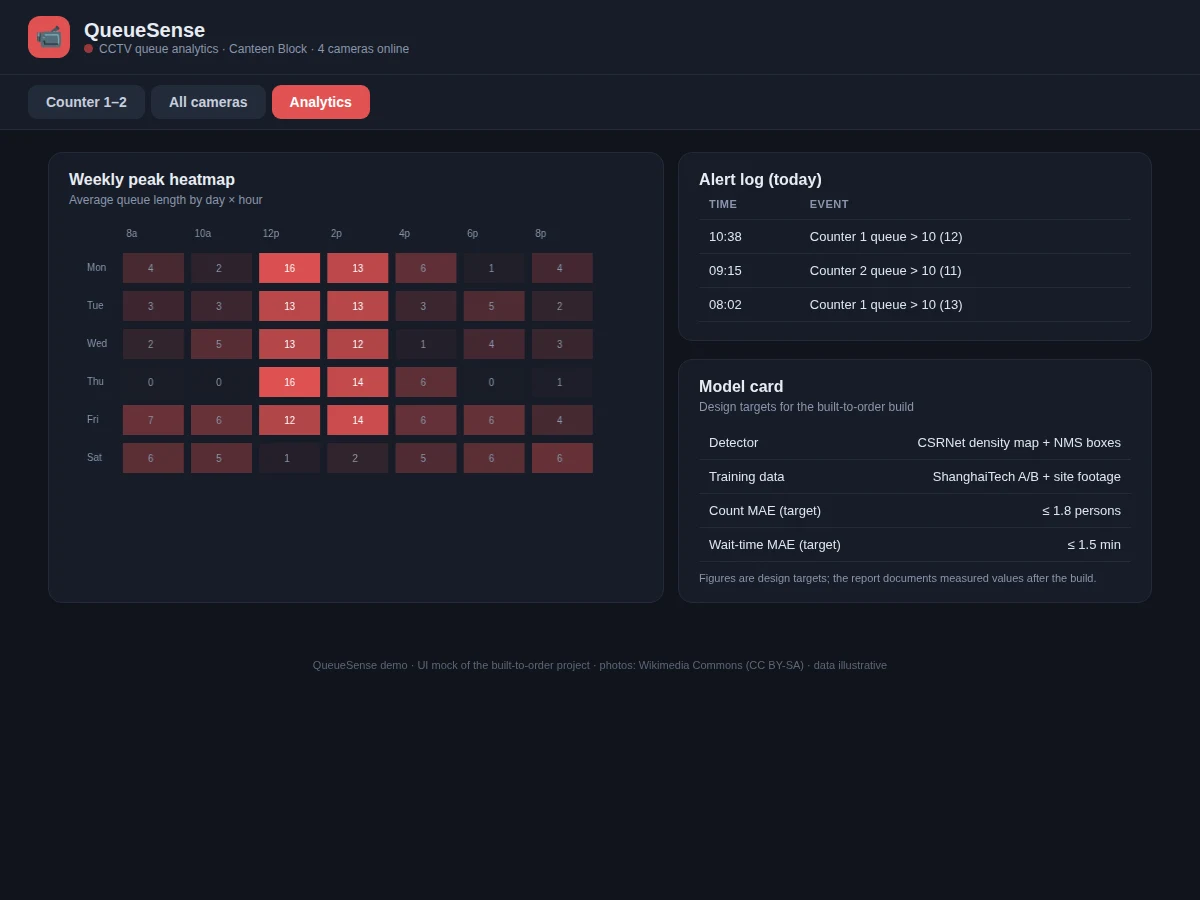
- When a count crosses its threshold, an alert is raised and logged with timestamp, camera and count.
- The model is evaluated on ShanghaiTech crowd-counting splits and on annotated site footage for count MAE and wait-time MAE.
Tech stack:
- Python 3, PyTorch (CSRNet density CNN)
- OpenCV (frame capture, ROI, overlays)
- ShanghaiTech crowd dataset (benchmark)
- NumPy, Matplotlib
- HTML/CSS/JavaScript dashboard (canvas)
- SQLite (alert log)
- Git
Dataset & model details
- Dataset: ShanghaiTech crowd-counting Parts A/B (1,198 images, ≈330k annotated heads) for density-map training; fine-tuned and evaluated on site-collected queue footage with ROI annotations gathered at build time.
- Task: Crowd density estimation; input = ROI frame crop, output = per-pixel density map whose integral is the people count; wait time regressed from count × calibrated service rate.
- Model: CSRNet-style CNN — VGG-16 frontend with dilated-convolution backend, trained with Euclidean loss on Gaussian density ground truth.
- Metrics: Count MAE ≤ 1.8 persons and wait-time MAE ≤ 1.5 min (design targets) on annotated site footage. No accuracy is claimed as measured until the build is completed for the order.
| Parameter | Value |
|---|---|
| Input | CCTV frames, ROI crops |
| Counting method | Density-map integral (CSRNet-style) |
| Count MAE | ≤ 1.8 persons (design target, not a measured claim) |
| Wait-time MAE | ≤ 1.5 min (design target, not a measured claim) |
| Throughput | Approximately 24 fps per camera on GPU, 6 fps CPU (expected) |
| Cameras | 4+ supported, per-camera ROI config |
| Alert latency | Under 5 s from threshold crossing (expected) |
| Dashboard | Single-file web app + Python service |
Project features
- [Density-map people counting] CSRNet-style CNN regresses crowd density maps — robust to occlusion and perspective, unlike box detectors in dense queues.
- [ROI queue definition] Click-to-draw polygons per camera define each service line; counts are computed only inside the ROI.
- [Wait-time estimation] Calibrated per-counter service rates convert queue counts into estimated wait times shown on the dashboard.
- [Multi-camera dashboard] Live grid of camera feeds with overlaid counts, ROI polygons, wait times and threshold alert banners.
- [Threshold alerts] Configurable per-counter limits (e.g. 10 people) trigger visual alerts suggesting staff action like opening another counter.
- [Hourly and weekly analytics] Queue-length time series and day×hour heatmaps reveal peak patterns for staffing decisions.
- [Alert log] Timestamped history of every threshold crossing for the operations report.
What is included
- Density-map CNN training and inference pipeline
- ROI drawing and per-counter calibration tool
- Multi-camera monitoring dashboard with alerts
- Hourly/weekly analytics and alert log
- Evaluation on ShanghaiTech splits + site footage
- Project report PDF (background, crowd-counting theory, methodology, results)
- PPT presentation for final review
- Viva Q&A preparation document (density maps, CSRNet, perspective, Little's law)
Limitations & prerequisites
- 1.8-person MAE is a design target, stated honestly — the report documents the actual achieved figure after the build.
- Needs a reasonably elevated camera angle; top-down or steep views count best, while head-on views suffer occlusion.
- Very dense crowds (50+ in one ROI) exceed the calibrated range and are reported with a low-confidence flag.
- The wait-time estimate assumes the calibrated service rate holds; a slow cashier or a complex transaction breaks the estimate.
- Privacy: the system counts people and stores no identities — face recognition is explicitly out of scope.
Frequently Asked Questions
Why density maps instead of detecting each person?
In a real queue people occlude each other — a detector sees one box where three people stand. A density map assigns fractional presence per pixel, so the integral stays accurate in crowds. The report compares both approaches.
Which dataset is used?
ShanghaiTech Parts A/B (≈330,000 annotated heads) for training the counter, then fine-tuning on queue footage from the deployment site with ROI annotations — because canteen queues look different from internet crowd photos.
How is wait time estimated?
Queue count divided by the counter's calibrated service rate (people/minute), smoothed over a 5-minute window. It is an estimate, and the dashboard shows it as such.
Does it store video of people?
The pipeline processes frames in memory for counting; only counts, wait times and alert events are logged. No face recognition, no identity storage — the report documents the privacy design.
Can it handle multiple counters?
Yes — each camera gets its own ROI polygons and thresholds, and the dashboard shows all cameras with per-counter alerts.
Is this project suitable for a final-year project?
Yes — for Computer Science, IT and AI/ML programs. It applies crowd-counting research to a visible real-world operations problem. Suitable for B.E./B.Tech final-year projects in Computer Science, IT and AI & Machine Learning.
Components & software requirements
- Python 3, PyTorch (CSRNet density CNN)
- OpenCV (frame capture, ROI, overlays)
- ShanghaiTech crowd dataset (benchmark)
- NumPy, Matplotlib
- HTML/CSS/JavaScript dashboard (canvas)
- SQLite (alert log)
- Git
Dataset & model details
- Dataset: ShanghaiTech crowd-counting Parts A/B (1,198 images, ≈330k annotated heads) for density-map training; fine-tuned and evaluated on site-collected queue footage with ROI annotations gathered at build time.
- Task: Crowd density estimation; input = ROI frame crop, output = per-pixel density map whose integral is the people count; wait time regressed from count × calibrated service rate.
- Model: CSRNet-style CNN — VGG-16 frontend with dilated-convolution backend, trained with Euclidean loss on Gaussian density ground truth.
- Metrics: Count MAE ≤ 1.8 persons and wait-time MAE ≤ 1.5 min (design targets) on annotated site footage. No accuracy is claimed as measured until the build is completed for the order.
Delivery information
Built-to-order project. Delivery timeline is shared after order confirmation based on current queue.
Support terms
Complete documentation, setup guide, and viva preparation included. Support for setup and explanation provided.