
More project photos (3)
The problem
A Python network port scanner with service detection and report export is a defensive auditing tool that probes the TCP ports of a host on the student's own lab network and reports which ports are open, which service listens on each one and what banner it returns. It answers one question first: what is actually listening on this machine? In a college lab, students run web servers, databases and remote-login services across several machines, yet rarely keep a clear inventory of what is exposed, so forgotten services stay listening and test databases stay reachable. The scanner closes that gap by connecting to each port in a chosen range, reading the banner where one is offered, and matching the port against 30 well-known assignments — port 22 for SSH, port 80 for HTTP, port 443 for HTTPS and port 3306 for MySQL — then writing the findings into a CSV or JSON report to compare with the next scan.
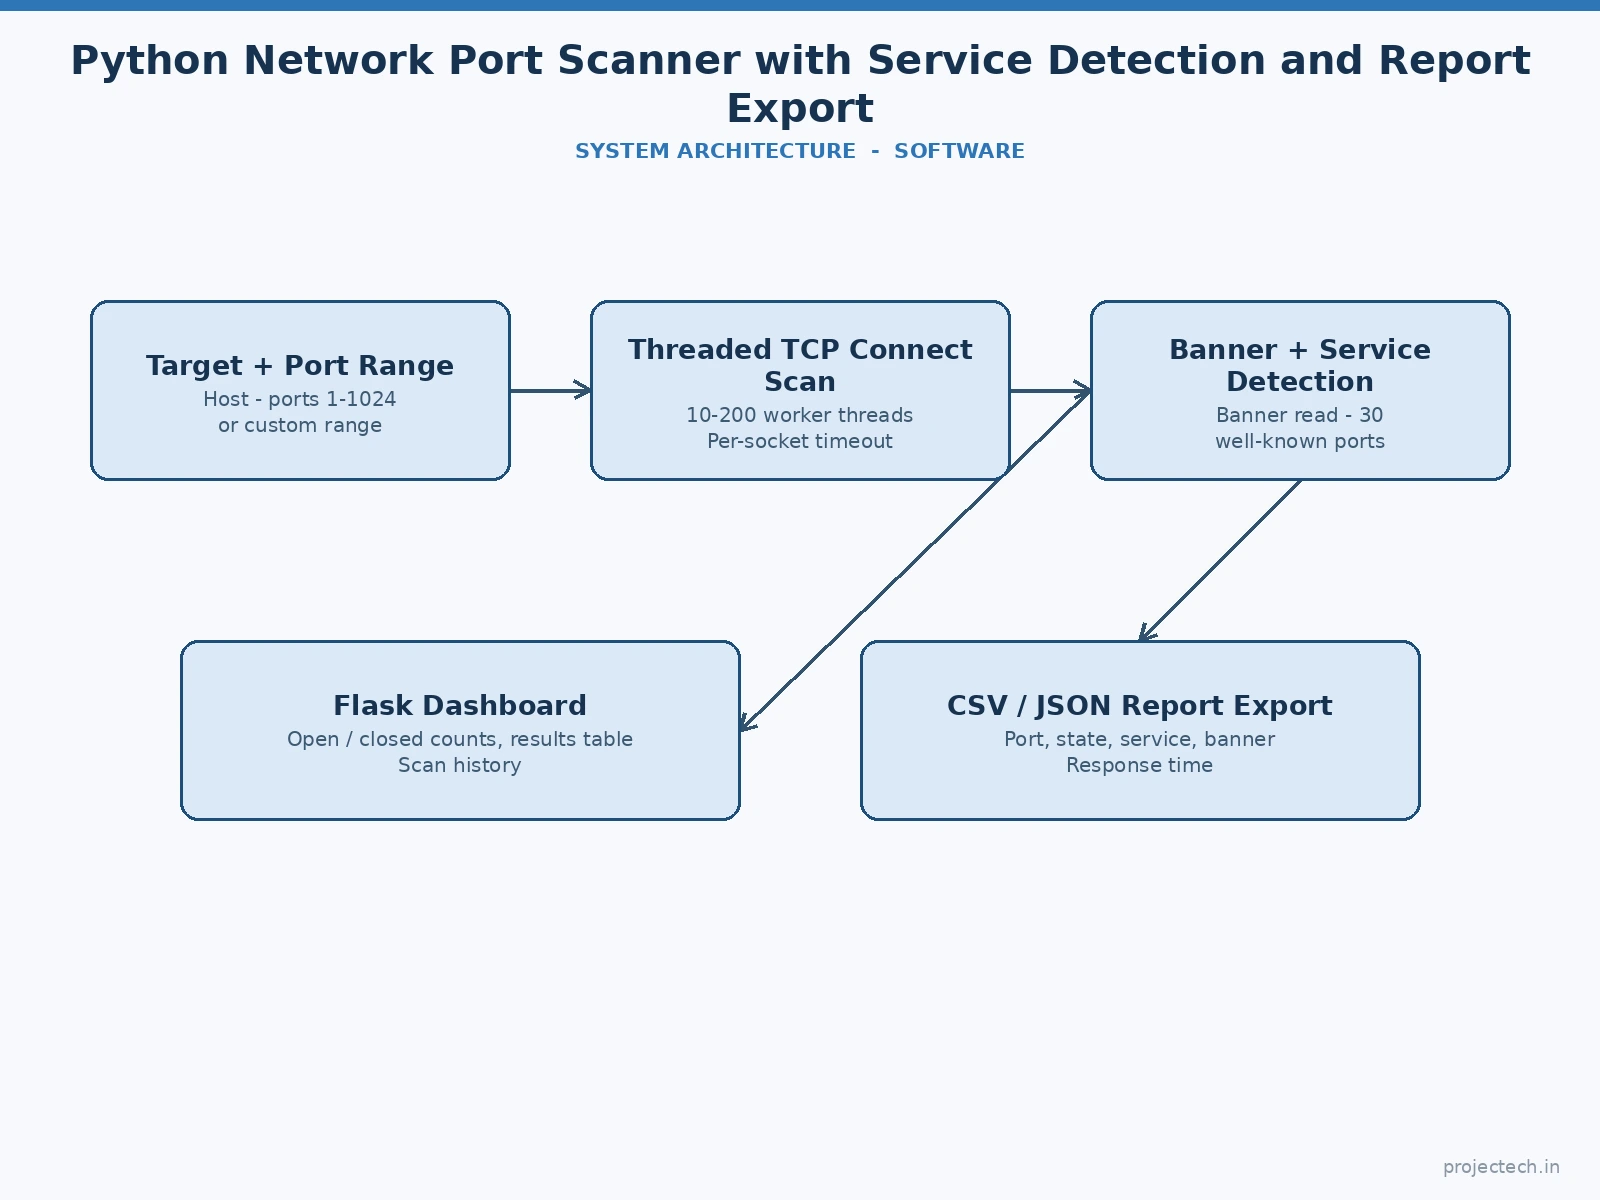
Enters the target host, port range, thread count and per-socket timeout.
Follow the working sequence
How it works
The scan starts when the student enters a target host — usually localhost or a lab machine — and picks a port range, a thread count and a per-socket timeout. The scanner then opens a TCP connection to each port in the range, using a pool of worker threads so dozens of connection attempts run at the same time instead of one after another. For every port that answers, the scanner learns it is open from the completed handshake: the target replies to the connection request with a SYN-ACK packet, the scanner completes the handshake with an ACK, and then closes the connection cleanly. The scanner reads the banner the service sends on connection, matches the port against the well-known assignments table, and records the port, state, service, banner and response time. When the range is finished, the results appear in the dashboard and are written to a CSV or JSON report that lists every scanned port.
- The student enters the target host (default 127.0.0.1), a port range (default 1–1024), a thread count (default 50 threads) and a per-socket timeout (default 1.0 s).
- A thread pool issues socket.connect_ex() calls to every port in the range, with dozens of connection attempts running at the same time.
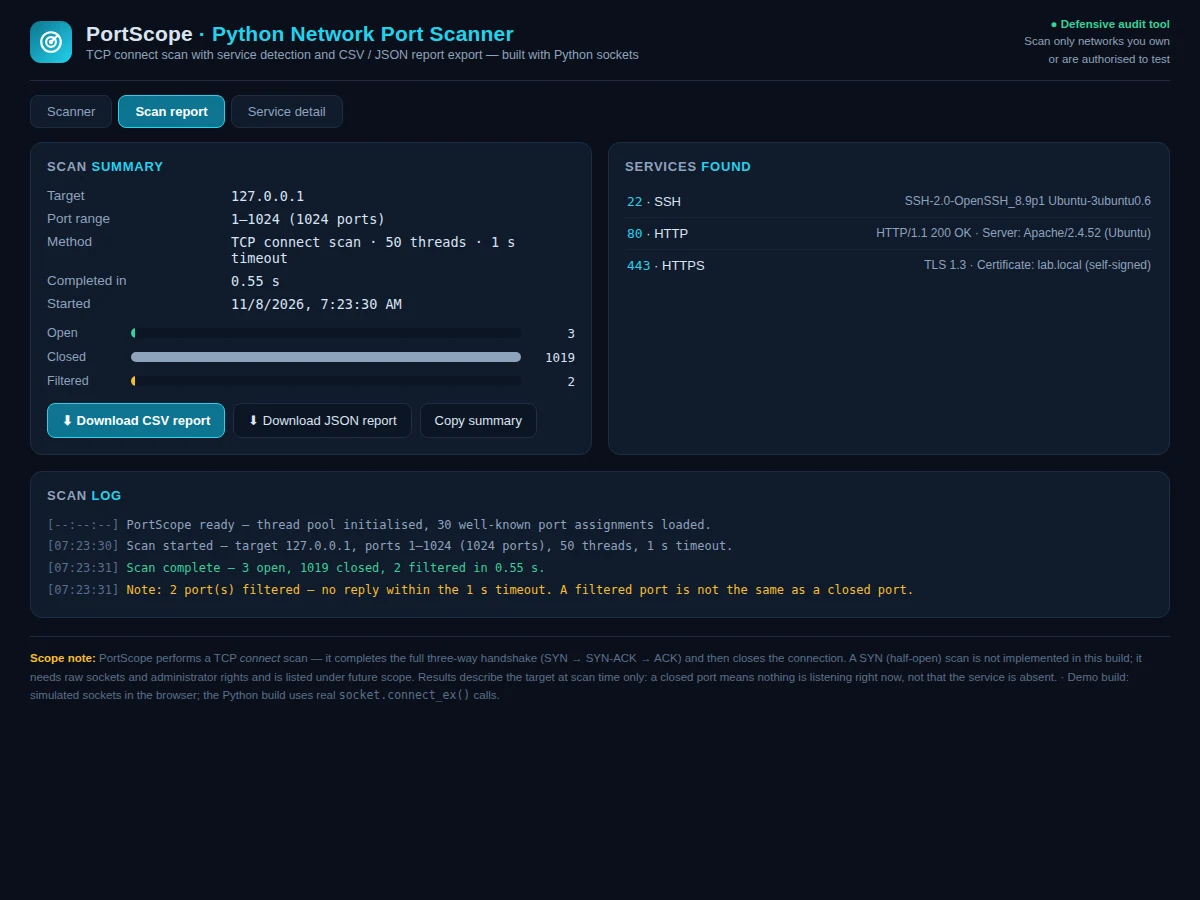
- Each port is classified from the connection outcome: a completed handshake means open, a connection-refused reply means closed, and no reply within the timeout means filtered.
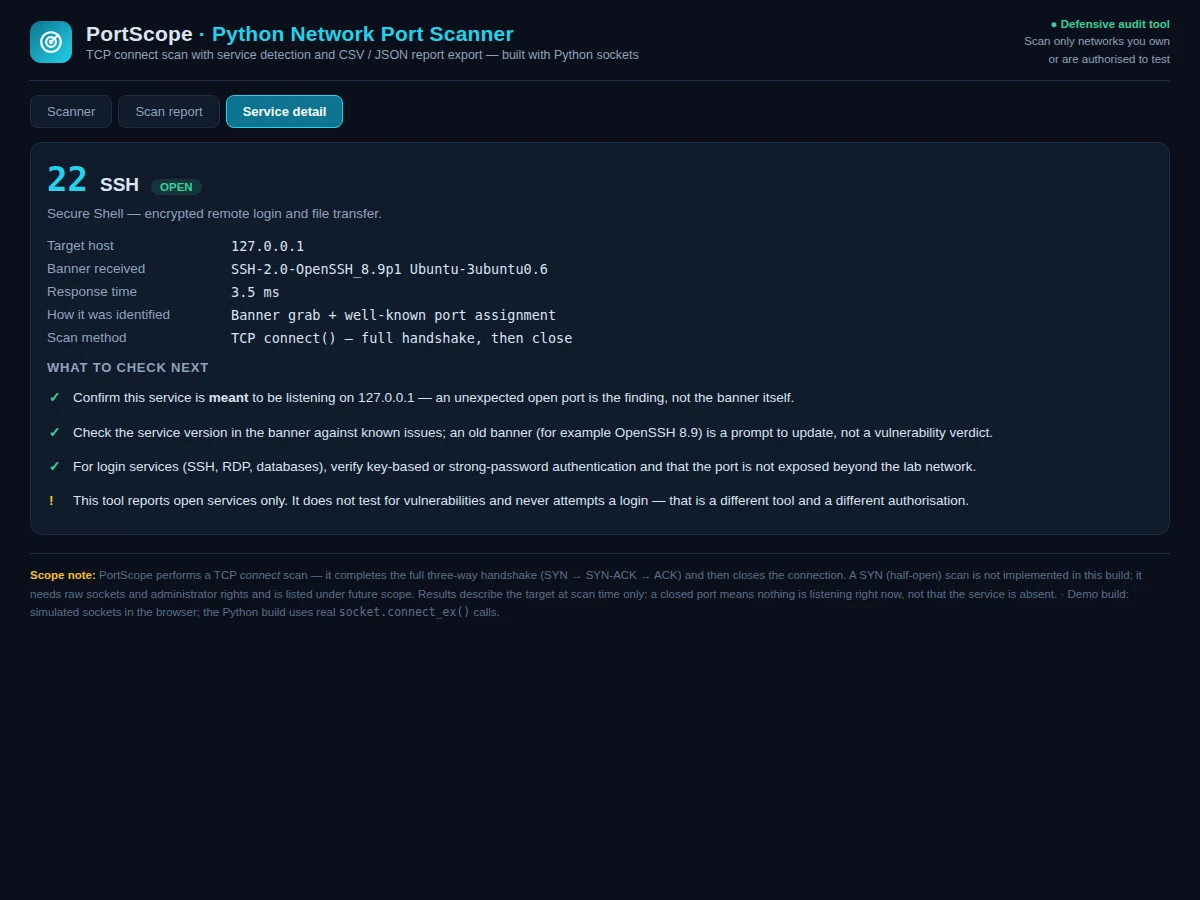
- For open ports the scanner reads the service banner where one is offered, then matches the port against the table of 30 well-known assignments to name the service.
- Results stream into the dashboard table with port, state, service, banner and response time, while the scan log records the start, the counts and the elapsed time.
- When the range is finished, the full result set is exported as a CSV or JSON report covering every scanned port, including the closed ones hidden from the on-screen table.
- The student can re-scan the same host later and compare the new report with the earlier one to spot services that appeared or disappeared.
Tech stack:
- Python 3.11
- Python sockets · concurrent.futures
- Flask (results dashboard)
- HTML · CSS · JavaScript (dashboard demo)
- CSV · JSON report export
- argparse (command-line interface)
- pytest (scan-logic tests)
- Git
| Parameter | Value |
|---|---|
| Scan method | TCP connect scan via Python sockets (SYN scan is future scope, not implemented) |
| Default port range | 1–1024 (configurable up to 1–65535) |
| Default thread count | 50 threads (configurable, 10–200 threads) |
| Per-socket timeout | 1.0 s default (configurable, 0.5–5.0 s) |
| Demo scan time | Approximately 0.6 s for a 1–1024 localhost scan (measured in the demo build; runs timed 0.55–0.58 s) |
| Well-known port table | 30 standard assignments (IANA) |
| Report formats | CSV and JSON |
| Target scope | 1 host per scan (authorized lab networks only) |
| Platform | Python 3.11 or newer on Windows, Linux or macOS |
| Dashboard | Single-file HTML demo, runs offline in a browser |
Project features
The scanner's three strongest capabilities are its threaded TCP connect scan, its banner-based service detection and its one-click report export. The connect scan opens a real TCP connection to each port in the chosen range using a pool of worker threads, so a 1–1024 scan of a lab host completes in seconds instead of the minutes a one-port-at-a-time scan would take, and a per-socket timeout stops a silent port from freezing the whole run. Service detection then reads the banner a service volunteers on connection — for example the OpenSSH version string on port 22 — and falls back to the well-known port table when a service stays silent. Finally, every result is written to a CSV or JSON report with port, state, service, banner and response time, so the findings can be reviewed in the dashboard, attached to the project report, or compared with a later scan of the same host.
- [Threaded TCP connect scan (Implemented)] A pool of worker threads opens socket connections to every port in the chosen range at the same time, so a 1–1024 scan of a lab host finishes in seconds. The thread count is configurable from 10 to 200 threads.
- [Banner-based service detection (Implemented)] For each open port the scanner reads the banner the service sends on connection and matches the port against a table of 30 well-known assignments, so port 22 is reported as SSH with its OpenSSH banner and port 3306 as MySQL.
- [CSV and JSON report export (Implemented)] Every scan writes a full report — port, state, service, banner and response time for each scanned port, plus target, range, thread count, timeout and elapsed time — downloadable as CSV or JSON from the dashboard.
- [Port-range and target selection (Implemented)] The student enters any target host and picks a preset range (1–100, 1–1024 or 1–65535) or a custom range, with presets for localhost, the lab router and a lab PC.
- [Results dashboard with scan history (Implemented)] The dashboard shows open, closed and filtered counts, elapsed time, a state distribution, a per-port results table and a scan log, and keeps earlier scans in the session history for comparison.
- [Custom port profiles (Configurable)] Named profiles can be saved for recurring targets — for example a "lab server" profile with ports 22, 80, 443 and 3306 — so a routine audit is one click instead of re-entering the range each time.
- [SYN scan mode (Future scope)] A half-open SYN scan is not part of the base build: it needs raw sockets and administrator rights, and it is listed as a future extension rather than an implemented feature.
What is included
- Complete Python scanner source code (command-line interface and thread-pool scan engine)
- Flask results dashboard with the single-file HTML demo
- Sample CSV and JSON reports from a localhost scan
- Project report PDF (background, TCP handshake theory, methodology, results)
- PPT presentation for final review
- Viva Q&A preparation document (sockets, TCP handshake, connect scan vs SYN scan, banner grabbing, timeouts)
- Project abstract PDF
Limitations & prerequisites
- TCP connect scan only — a SYN (half-open) scan is not implemented, because it needs raw sockets and administrator rights; it is listed as future scope.
- Only for networks the student owns or is authorized to test — scanning any other network without permission is out of scope for this project and may be unlawful.
- Banner grabbing works only for services that send a banner on connect; silent services are identified by the port assignment alone.
- A filtered port (firewall dropping packets) is reported as filtered, not closed — without an ICMP check, which is not implemented, the scanner cannot tell a filtered port from a host that is down.
- Scan speed depends on network latency and thread count; a 1–65535 scan of a remote host takes proportionally longer than the approximately 0.6 s localhost demo timing.
- The tool reports open services only; it does not test for vulnerabilities, attempt logins or exploit anything.
Frequently Asked Questions
Is this project suitable for a final-year project?
Yes — for Computer Science, IT and Computer Engineering programmes, because it demonstrates socket programming, the TCP handshake, multithreading, banner-based service identification and report generation in one working tool. The viva discussion maps cleanly onto networking syllabus topics, and the dashboard demo makes the result visible to reviewers without any extra setup. Students can explain every part of the pipeline from the connect() call to the CSV export, and the single-host scope keeps the build achievable inside one semester.
What is the difference between a connect scan and a SYN scan?
A connect scan completes the full TCP three-way handshake (SYN, then SYN-ACK, then ACK) and closes the connection, so the target logs an ordinary connection. A SYN scan stops after receiving the SYN-ACK and never sends the final ACK, so it is faster and quieter, but it needs raw sockets and administrator rights. The base build implements the connect scan only; the SYN scan is future scope, not an implemented feature.
Is it legal to run this scanner?
Only on networks you own or have written permission to test — your own machine, your college lab with the lab-in-charge's approval, or a host whose owner has agreed in writing. Scanning any other network without permission is out of scope for this project and can be unlawful. The tool itself is a defensive auditing aid: it reports what is listening and never attempts a login, a vulnerability test or any exploitation.
How does service detection work?
It reads the banner a service volunteers when a connection opens — for example the OpenSSH version string on port 22 — and falls back to a table of 30 well-known port assignments when the service sends no banner. Each open port is therefore reported with both the evidence (the banner text) and the identification (the service name). Services that stay silent are labelled from the port assignment alone, and the report shows which identification method was used for each port.
Can it scan a whole network or several hosts at once?
Not in the base build — it scans one host per run, which keeps the design, the code and the viva explanation simple and focused on port and service enumeration. Scanning a list of hosts from a file is a realistic extension and is listed as a customization option. The single-host design is also deliberate for the authorized-use scope: each target is entered explicitly rather than swept automatically.
What reports does it produce?
Every scan writes a CSV and a JSON report listing each scanned port with its state, service, banner and response time, plus the target, port range, thread count, timeout and total elapsed time. The dashboard also shows the summary counts, a state distribution and a scan log. Sample reports from a localhost scan are included, so the report format can be checked before the build is ordered.
Components & software requirements
- Python 3.11
- Python sockets · concurrent.futures
- Flask (results dashboard)
- HTML · CSS · JavaScript (dashboard demo)
- CSV · JSON report export
- argparse (command-line interface)
- pytest (scan-logic tests)
- Git
Delivery information
Built-to-order project. Delivery timeline is shared after order confirmation based on current queue.
Support terms
Complete documentation, setup guide, and viva preparation included. Support for setup and explanation provided.
Download free synopsis (PDF)
Enter your name and WhatsApp number — the synopsis PDF downloads immediately. We may send occasional project updates on WhatsApp; no spam.