
More project photos (3)
The problem
A Programmable AC Load Bank with Step Load Switching and Power Measurement answers a basic testing problem: a generator, UPS or inverter cannot be properly tested without a load, yet loading it with random heaters is uncontrolled, unsafe and unrepeatable. Labs solve this with a load bank — resistive elements switched in steps so the source under test sees a precise, repeatable load profile while voltage, current and power are measured. Student labs rarely own one, and the usual workaround — geyser elements or halogen lamps wired by hand — gives coarse steps, no sequencing and no measurement, so generator droop and UPS transfer tests stay approximate. This project builds a student-scale programmable AC load bank: eight 500 W resistive steps switched by contactors under Arduino control, a PZEM-004T module for true-RMS measurement, a 20×4 LCD, and SD-card logging. It is a supervised-lab bench instrument only — a prototype, never to be connected to the live utility grid.
How it works
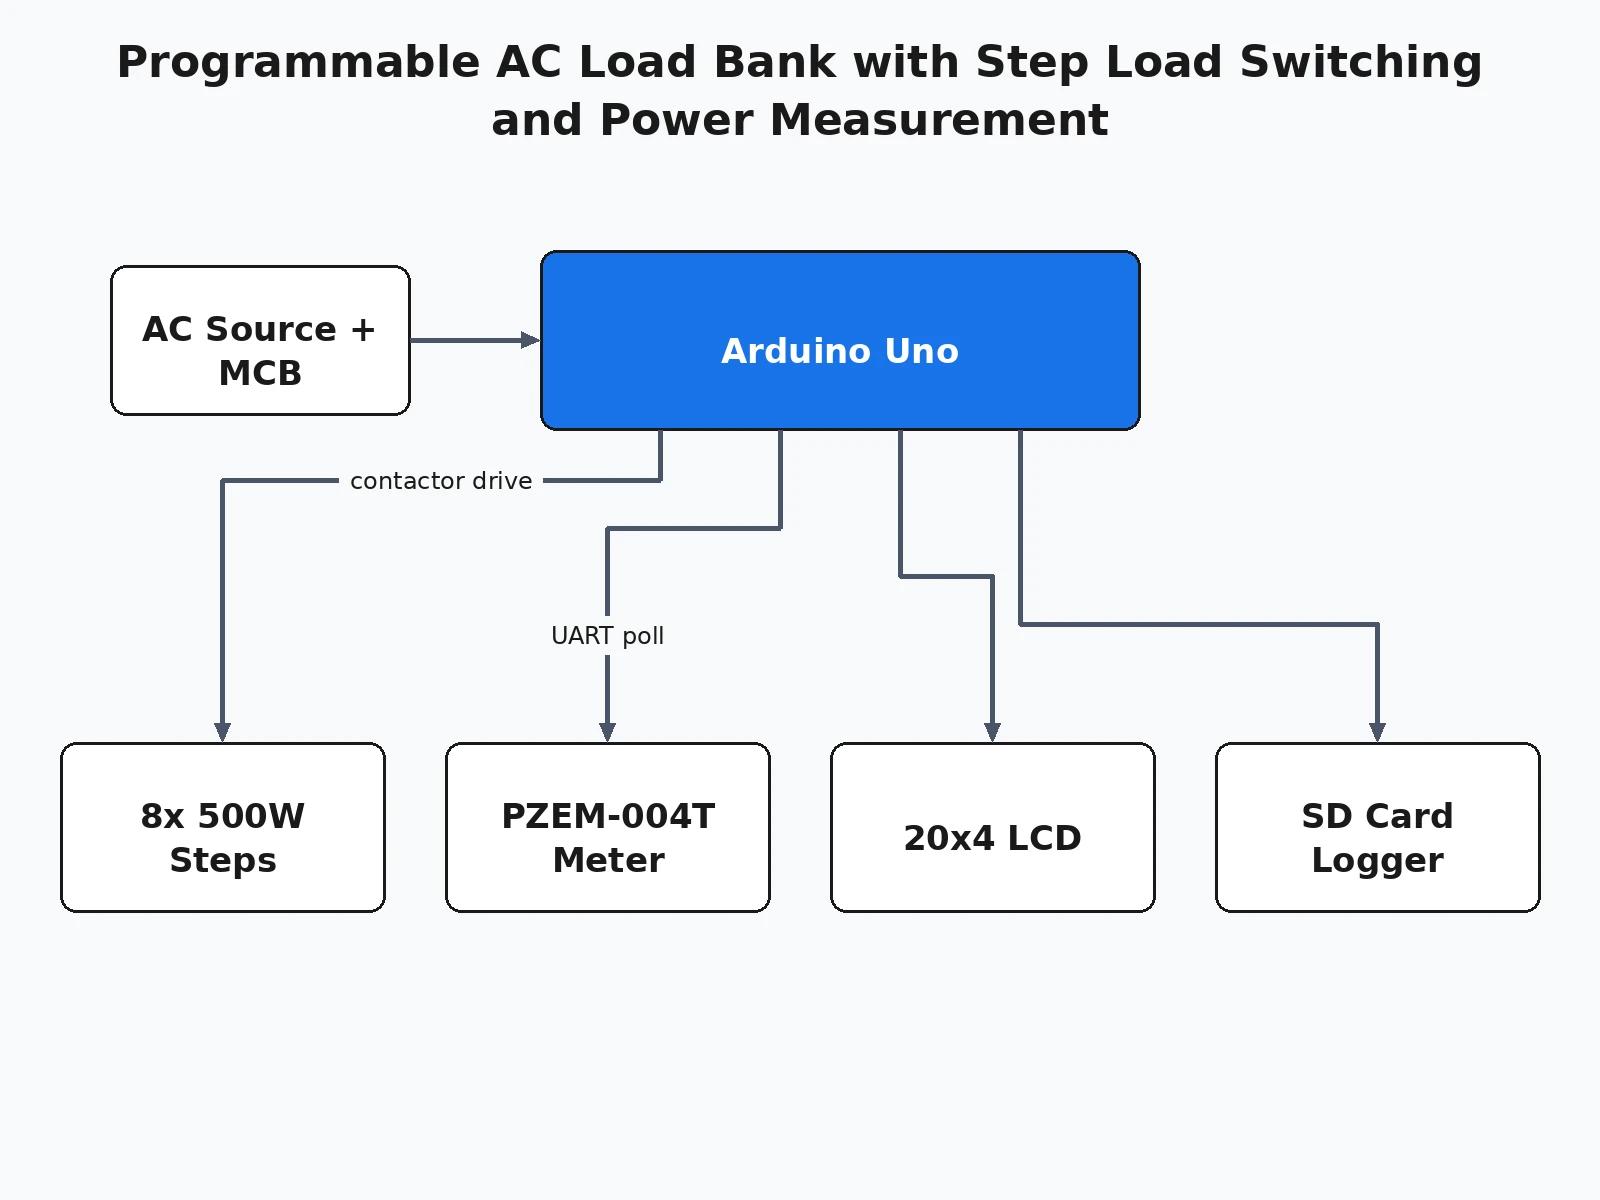
End to end, the Programmable AC Load Bank works as a controlled way to spend energy: 230 V AC from the source under test enters through an MCB and an emergency-stop contactor loop into eight parallel branches, one per load step. Each branch holds a 500 W tubular heater in series with a 10 A contactor; the Arduino drives the coils through a relay driver, so each step command closes one branch and adds one 500 W load step — steps close in order with a settle delay so the full 4 kW never slams on at once. A PZEM-004T-100A senses mains voltage directly and load current through its clamp CT, computing true-RMS voltage, current, power, frequency, power factor and energy; the Arduino polls it once per second over 9600-baud UART, refreshes the 20×4 LCD, and logs a timestamped row to the SD card. Timed profiles replay the same sequence every run, making generator droop or UPS transfer tests repeatable.
- The source under test (generator, UPS or inverter) is connected to the load bank's input through a 25 A MCB; the Arduino boots and the LCD shows the idle status screen.
- The operator selects manual step up/down or a timed profile, with dwell per step configurable from 5 to 600 seconds in firmware.
- The Arduino energizes each contactor coil through the relay driver in a defined order with a settle delay, closing one heater branch per step — each step adds approximately 500 W (design target).
- The PZEM-004T samples true-RMS voltage, current, power, frequency and power factor; the Arduino polls it once per second over 9600-baud UART.
- The LCD refreshes with live readings and active-step count while the SD card appends a timestamped row per second for the whole test run.
- The run ends with a reverse-order step-down; the accumulated energy reading holds until a software reset, and any emergency stop drops all contactor coils immediately.
- The buyer verifies each step against the LCD and the log during commissioning — the build's test procedure, not a claimed result.
Tech stack:
- Arduino Uno (ATmega328P)
- PZEM-004T-100A energy meter
- 10 A AC contactors × 8
- 230 V tubular heater elements × 8
- 20×4 character LCD
- SD-card module with CSV logging
- 25 A MCB + emergency-stop loop
- Ventilated MS enclosure
| Parameter | Value |
|---|---|
| Mains supply | 230 V AC, single phase (nominal) |
| Total load capacity | 4 kW (design target: 8 steps × 500 W) |
| Step size | 500 W per step (design target, element-dependent) |
| Load element | 230 V tubular heater, Approximately 500 W each (design target) |
| Switching | 8 contactors, 10 A contact rating (datasheet) |
| Measurement module | PZEM-004T-100A: 80–260 V AC, 0–100 A, 0–23 kW, 0.5% (Datasheet) |
| Sampling and logging | Approximately 1 s measurement refresh, 1 s log row (design default) |
| Display | 20 × 4 character LCD |
| Input protection | 25 A MCB (component rating) |
| Sequencing control | Arduino Uno, ATmega328P (datasheet) |
| Enclosure | Ventilated MS enclosure, Approximately 450 × 350 × 250 mm (approximate) |
Project features
The four capabilities that define the Programmable AC Load Bank are stepped resistive loading, programmable sequencing, true-RMS measurement with logging, and a supervised-safety switching chain. Eight 500 W tubular heater elements, each switched by its own 10 A contactor, let the source under test see any load from 500 W to 4 kW in 500 W increments — fine enough to draw a generator's voltage-droop curve point by point. Programmable sequencing lets the Arduino run the steps itself: manual up/down, automatic step-up and step-down, or a timed profile with configurable dwell per step, so a test repeats exactly. True-RMS measurement uses a PZEM-004T-100A module (datasheet: 80–260 V AC, 0–100 A, 0–23 kW at 0.5% accuracy), showing voltage, current, power, frequency, power factor and energy on a 20×4 LCD and logging a timestamped row to the SD card every second. A 25 A MCB, an emergency-stop contactor loop and a ventilated steel enclosure keep mains power behind procedure.
- [Eight 500 W resistive load steps] (Implemented) Eight 230 V tubular heater elements, each switched by its own 10 A contactor, load the source under test from 500 W to 4 kW in 500 W increments (design target) — a genuine step-load instrument, not a fixed heater.
- [Programmable step sequencing] (Implemented) Manual step up/down buttons, automatic step-up and step-down sequences, and timed profiles with configurable dwell per step, all sequenced by the Arduino with a settle delay between steps.
- [True-RMS power measurement with SD logging] (Implemented) A PZEM-004T-100A module measures 80–260 V AC, 0–100 A and 0–23 kW at 0.5% accuracy (datasheet), polled over 9600-baud UART; every second a timestamped V/I/P/frequency/PF/energy row is written to the SD card.
- [Live 20×4 LCD readout] (Implemented) Voltage, current, active power, frequency, power factor, accumulated energy and the number of active steps, updated as the steps change.
- [Safety switching chain] (Implemented) 25 A MCB on the input, an emergency-stop loop that drops every contactor coil independently of the Arduino, and a ventilated steel enclosure — mains safety is part of the design, not an afterthought.
- [Configurable step size and profile timing] (Configurable) Element wattage (250 W, 500 W or 1000 W designs), dwell time per step from 5 to 600 seconds, and step order are all firmware constants the buyer can change.
- [Wi-Fi test dashboard] (Optional customization) An ESP32-based wireless readout of the same measurement stream can be added on request; it is not part of the base build.
What is included
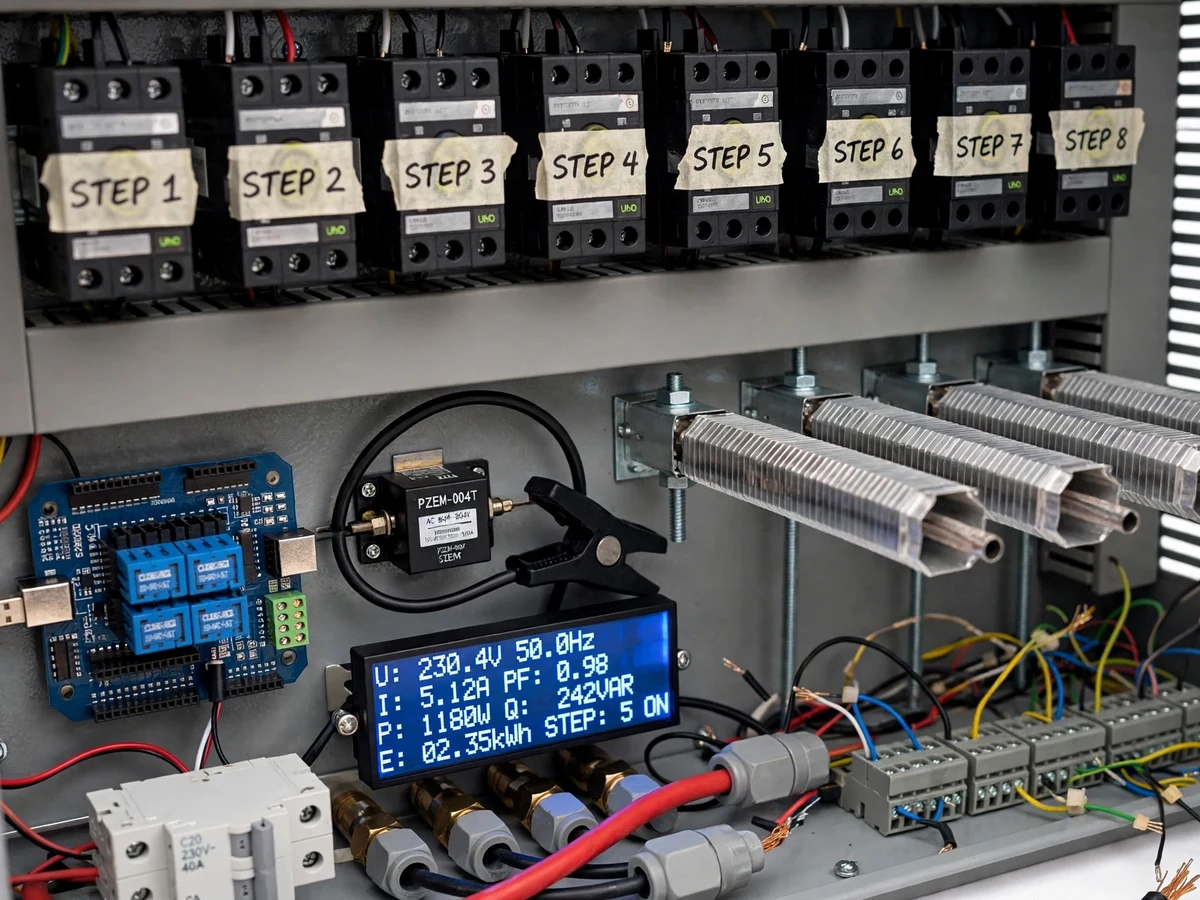
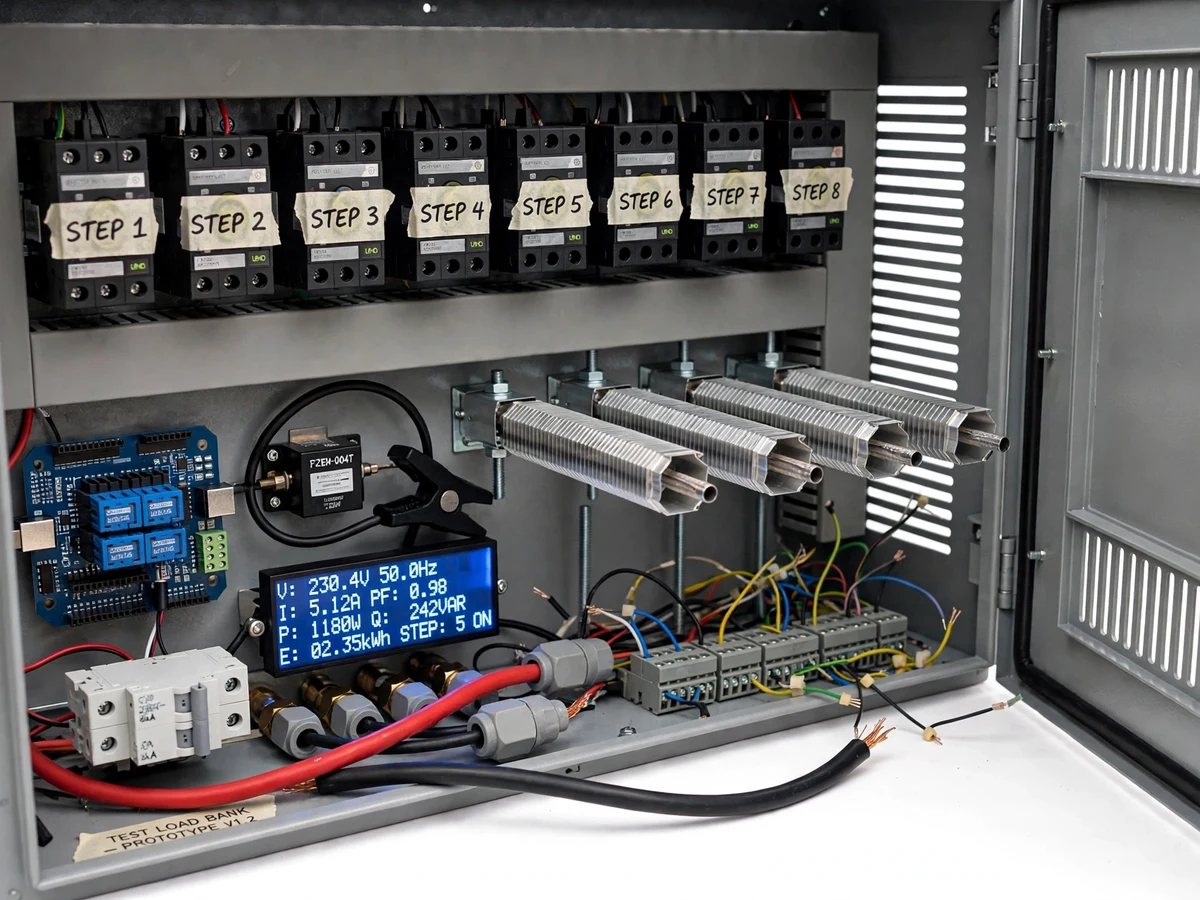
- Working load-bank prototype: 8-step contactor panel, heater bank, PZEM-004T measurement module, 20×4 LCD, ventilated steel enclosure
- Arduino firmware: step sequencing, PZEM-004T polling, LCD driver, SD-card CSV logging
- Wiring and schematic documentation with mains-safety notes on every high-voltage page
- Step-calibration and supervised commissioning procedure (buyer verifies each step's V/I/P on the LCD and in the log)
- Project report PDF (load-bank theory, contactor switching, measurement chain, methodology)
- PPT presentation for final review
- Viva Q&A preparation document (load testing, true-RMS vs average measurement, contactor vs relay selection, safety)
Limitations & prerequisites
- 230 V mains is present inside the enclosure — wiring, commissioning and first power-up must be done under faculty supervision; this is a student prototype, not certified test equipment.
- The rig must never be connected to the live utility grid; it is for bench testing of small generators, UPS units and inverters in a supervised lab only.
- Resistive load only — it cannot emulate inductive or capacitive loads; the bank itself draws a power factor of approximately 1.
- The 500 W step size is coarse for sub-500 W sources, and actual step power follows P ∝ V², so a 230 V element delivers less on a sagging supply (expected).
- Heater elements run hot: ventilation is mandatory and enclosure surfaces get hot at sustained full load (expected).
- Builder note from the prototype: the heater elements are mounted raised with free airflow above and below — elements bolted flat to the base trap their own heat and brown the wiring insulation on the first full-load run.
- The 0.5% measurement figure is the PZEM-004T datasheet accuracy; the build is not lab-calibrated, and the buyer cross-checks readings against a reference meter during commissioning.
Frequently Asked Questions
What does a load bank actually do?
A load bank is a controlled way to spend energy: it gives a generator, UPS or inverter a known, switchable load so you can test how the source behaves under stress. Instead of guessing with random heaters, this rig applies 500 W to 4 kW in eight steps while measuring true-RMS voltage, current, power and energy — so a voltage-droop curve or an overload test is repeatable, not approximate.
The measurement stream is logged to the SD card every second, so the student can plot the test results after the run and defend them in the viva.
How does the step switching work?
Each of the eight 500 W heater elements sits on its own branch in series with a 10 A contactor; the Arduino energizes the contactor coils through a relay driver board. A step command closes one more branch, adding exactly one 500 W step (design target), and steps close in a defined order with a settle delay so the full 4 kW never slams on at once.
Manual up/down, automatic step-up/step-down and timed profiles with configurable dwell are all sequenced by the firmware.
What exactly does the PZEM-004T measure?
The PZEM-004T-100A module measures AC voltage (80–260 V), current (0–100 A through its clamp CT), active power (0–23 kW), frequency, power factor and accumulated energy at 0.5% accuracy — all datasheet values, polled by the Arduino once per second over 9600-baud UART. The readings appear on the 20×4 LCD and are written to the SD card as a timestamped CSV row every second.
It computes true RMS values, which is the correct measurement for distorted inverter waveforms — worth a viva question.
Is it safe to build and use?
As safe as a mains project gets, which still means strict procedure: 230 V AC is present inside the enclosure, so wiring and first power-up happen under faculty supervision. The design carries its own safety chain — a 25 A MCB on the input and an emergency-stop loop that drops every contactor coil independently of the Arduino, so a firmware crash cannot leave the load connected.
The rig must never be connected to the live utility grid, and it is not certified test equipment.
What sources can it test?
Small single-phase sources a student lab actually has: portable petrol generators (up to approximately 4 kVA), home UPS/inverter units, and inverter prototypes built for other projects. The 500 W step granularity suits sources above about 1 kW; below that the steps are too coarse for fine droop curves.
It cannot test three-phase sources, and as a resistive bank it cannot emulate the inductive starting surge of a motor.
Is this project suitable for a final-year project?
Yes — for Electrical Engineering programs. It demonstrates load testing practice, contactor switching and sequencing, true-RMS energy measurement, data logging, and above all the safety engineering that mains-voltage projects demand — all classic electrical syllabus territory with real, defensible behavior to demonstrate.
The logged test runs give the student genuine measured curves to present at the final review.
Components & software requirements
- Arduino Uno (ATmega328P)
- PZEM-004T-100A energy meter
- 10 A AC contactors × 8
- 230 V tubular heater elements × 8
- 20×4 character LCD
- SD-card module with CSV logging
- 25 A MCB + emergency-stop loop
- Ventilated MS enclosure
Delivery information
Built-to-order project. Delivery timeline is shared after order confirmation based on current queue.
Support terms
Complete documentation, setup guide, and viva preparation included. Support for setup and explanation provided.
Download free synopsis (PDF)
Enter your name and WhatsApp number — the synopsis PDF downloads immediately. We may send occasional project updates on WhatsApp; no spam.