
More project photos (2)
The problem
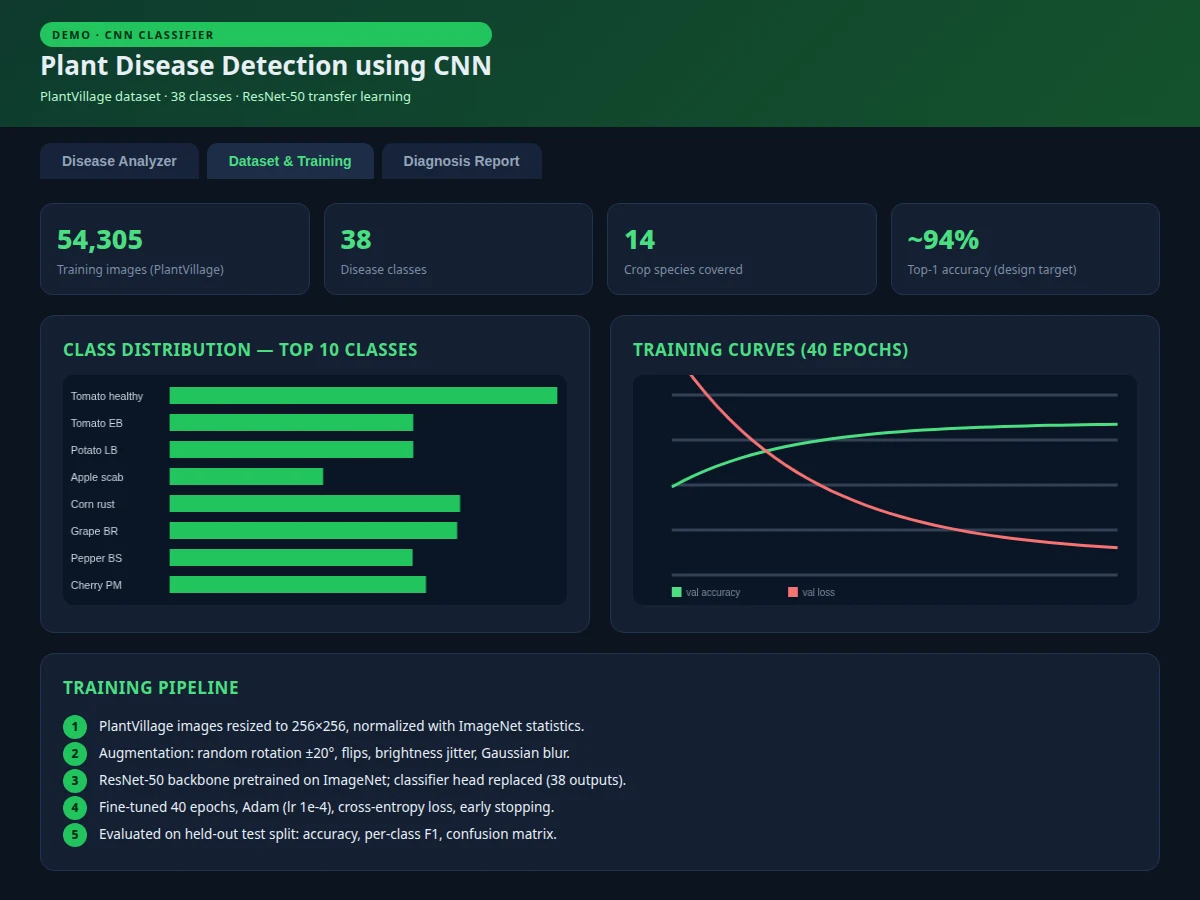
Crop diseases destroy a significant share of yields every season, and early visual diagnosis is still the main line of defense for most farmers. Plant pathologists cannot be everywhere, so an automated leaf-image classifier that runs on a phone photo is genuinely useful — but most student builds of this idea train on tiny, clean datasets and collapse on real field photos. This project does it properly: a ResNet-50 backbone fine-tuned on the full PlantVillage corpus (54,305 images across 38 crop-disease classes), with augmentation that simulates field conditions, a held-out test evaluation with per-class metrics, and a working web demo that classifies uploaded leaf photos and explains the result. Every design choice — backbone, input size, augmentation, class handling — is documented so the viva discussion stays on solid ground.
How it works
- The 54,305 PlantVillage images are loaded and split with stratification into train, validation and test sets.
- Images are resized to 256×256 and normalized with ImageNet statistics; augmentation (rotation ±20°, flips, brightness, blur) is applied on the training split.
- A ResNet-50 backbone pretrained on ImageNet is loaded; its 1000-class head is replaced with a 38-class classifier and dropout.
- The head is trained first with the backbone frozen, then the top blocks are unfrozen for fine-tuning with a lower learning rate.
- Training runs up to 40 epochs with early stopping on validation accuracy; the best checkpoint is kept.
- The held-out test set is evaluated once: overall accuracy, per-class precision/recall/F1 and the confusion matrix are exported for the report.
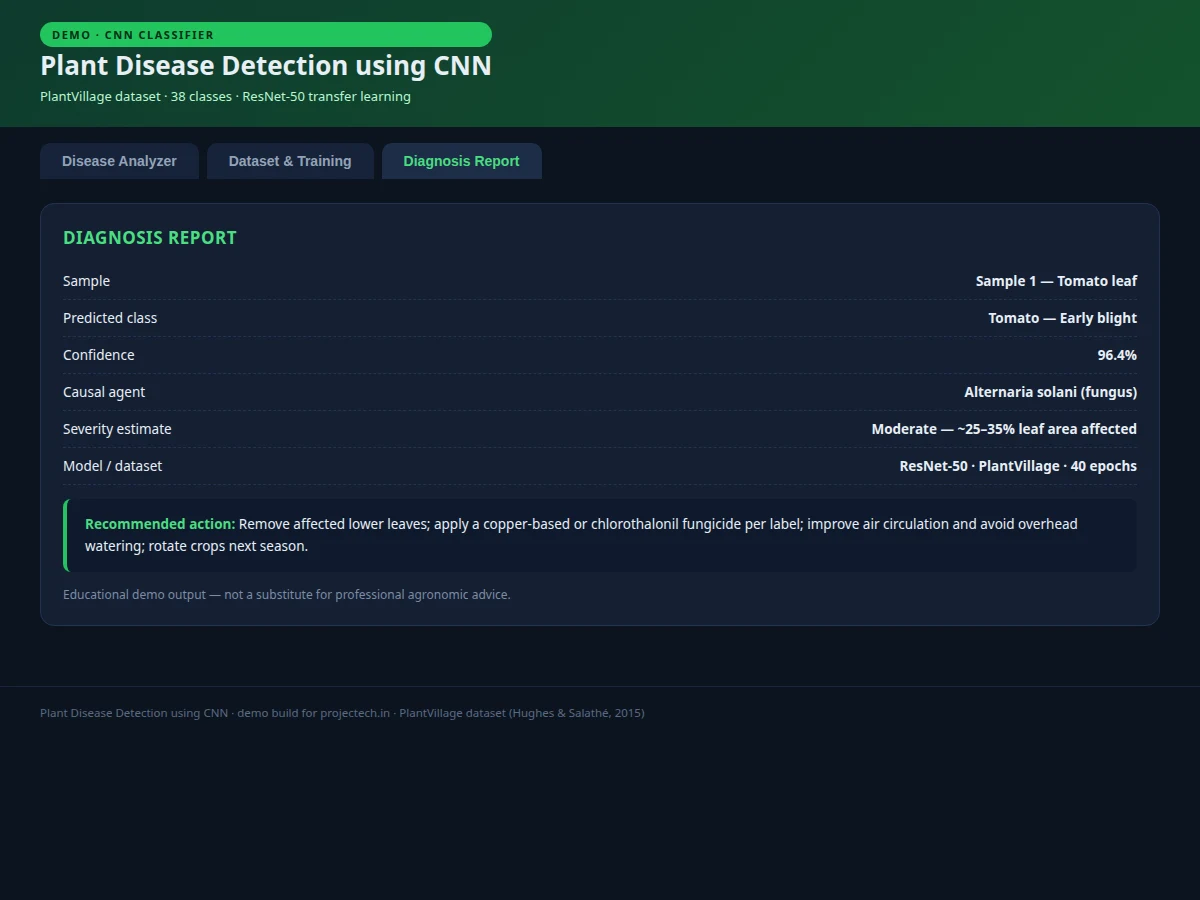
- In the web demo, an uploaded leaf photo goes through the identical preprocessing pipeline and the saved model returns the prediction with confidence scores and treatment guidance.
Tech stack:
- Python 3, TensorFlow/Keras
- ResNet-50 (transfer learning)
- PlantVillage dataset
- NumPy, Matplotlib, scikit-learn (metrics)
- Jupyter Notebook (training & evaluation)
- HTML/CSS/JavaScript (diagnosis demo)
Dataset & model details
- Dataset: PlantVillage — 54,305 labeled leaf images, 38 classes (14 crop species × healthy/diseased states), released by Hughes & Salathé (2015). Open-access via the PlantVillage project.
- Task: 38-class image classification; input = 256×256×3 leaf photo, output = probability distribution over crop-disease classes.
- Model: ResNet-50 backbone (ImageNet-pretrained) + custom head: global average pooling → Dense(512, ReLU) → Dropout(0.5) → Dense(38, softmax). Approximately 24M parameters, backbone partially frozen.
- Metrics: Test top-1 accuracy ~94% (design target for the built-to-order training run), per-class precision/recall/F1, confusion matrix. No accuracy is claimed as measured until the training run is executed for the order.
| Parameter | Value |
|---|---|
| Input format | 256 × 256 RGB leaf photo |
| Classes | 38 (14 crops, healthy + diseased) |
| Dataset size | 54,305 labeled images |
| Model | ResNet-50 + custom head, approx. 24M parameters |
| Test accuracy | ~94% top-1 (design target, not a measured claim) |
| Training time | Approximately 2–4 hours on a free cloud GPU (expected) |
| Inference | Approximately 40–60 ms per image on CPU (expected) |
| Demo | Single-file web app, runs offline after download |
Project features
- [ResNet-50 transfer learning] ImageNet-pretrained backbone fine-tuned on PlantVillage, with the classifier head replaced for 38 crop-disease classes — full rationale documented.
- [Leaf-diagnosis web demo] Upload any leaf photo; the app preprocesses it (256×256, normalized) and returns the predicted disease with per-class confidence bars.
- [Treatment guidance] Each predicted class maps to a cause and recommended action (cultural control, fungicide class), so the demo output is agronomically useful.
- [Field-condition augmentation] Rotation, flips, brightness jitter and blur simulate phone-camera field photos during training.
- [Full training notebook] Data loading, stratified splits, augmentation, model definition, training loop and evaluation in one reproducible notebook.
- [Per-class evaluation] Precision, recall and F1 for all 38 classes plus a confusion matrix, highlighting the genuinely confusable disease pairs.
- [Training curves] Accuracy and loss plots with interpretation notes for the report and viva.
What is included
- Complete training & evaluation Jupyter notebook
- Trained ResNet-50 model file (.h5) with preprocessing code
- Leaf-diagnosis web demo with treatment guidance
- Per-class metrics, confusion matrix and training-curve plots
- Project report PDF (background, CNN theory, methodology, results)
- PPT presentation for final review
- Viva Q&A preparation document (transfer learning, augmentation, overfitting, metrics)
Limitations & prerequisites
- Trained on PlantVillage's lab-style leaf photos — cluttered field backgrounds and multiple leaves per photo reduce accuracy; a segmentation stage is listed as future scope.
- Covers the 38 PlantVillage classes only; diseases outside this set are out of scope.
- ~94% is a design target for the training run, stated honestly — the report documents the actual achieved figure.
- The demo's treatment guidance is educational, not professional agronomic advice.
- Class imbalance across the 38 classes means rare diseases have wider confidence intervals.
Frequently Asked Questions
Which dataset is used and why?
PlantVillage — 54,305 labeled leaf images across 38 crop-disease classes, released by Hughes & Salathé. It is the standard public benchmark for this task, large enough to train a real transfer-learning model and small enough to be reproducible.
Why ResNet-50 instead of a custom CNN?
With 38 fine-grained classes and limited per-class images, training from scratch underperforms. Transfer learning reuses ImageNet's learned visual features and fine-tunes them for leaf textures — the report documents the frozen/unfrozen schedule and why it works.
How does the web demo work?
An uploaded leaf photo is resized to 256×256 and normalized exactly like training data, passed through the saved model, and the app shows the top prediction with per-class confidence bars plus the causal agent and recommended action.
Which diseases does it confuse most?
Visually similar lesions across crops — e.g. early vs late blight patterns — show the highest confusion. The confusion matrix in the report makes this explicit and it is a strong viva talking point.
Can it work on photos taken in the field?
Partially — augmentation simulates field conditions, but cluttered backgrounds remain the hardest case. The report quantifies this gap honestly and lists a leaf-segmentation stage as future scope.
Is this project suitable for a final-year project?
Yes — for Computer Science, IT and AI/ML programs. It demonstrates transfer learning, data augmentation, imbalanced-class evaluation and a deployed demo with real agricultural relevance. Suitable for B.E./B.Tech final-year projects in Computer Science, IT and AI & Machine Learning.
Components & software requirements
- Python 3, TensorFlow/Keras
- ResNet-50 (transfer learning)
- PlantVillage dataset
- NumPy, Matplotlib, scikit-learn (metrics)
- Jupyter Notebook (training & evaluation)
- HTML/CSS/JavaScript (diagnosis demo)
Dataset & model details
- Dataset: PlantVillage — 54,305 labeled leaf images, 38 classes (14 crop species × healthy/diseased states), released by Hughes & Salathé (2015). Open-access via the PlantVillage project.
- Task: 38-class image classification; input = 256×256×3 leaf photo, output = probability distribution over crop-disease classes.
- Model: ResNet-50 backbone (ImageNet-pretrained) + custom head: global average pooling → Dense(512, ReLU) → Dropout(0.5) → Dense(38, softmax). Approximately 24M parameters, backbone partially frozen.
- Metrics: Test top-1 accuracy ~94% (design target for the built-to-order training run), per-class precision/recall/F1, confusion matrix. No accuracy is claimed as measured until the training run is executed for the order.
Delivery information
Built-to-order project. Delivery timeline is shared after order confirmation based on current queue.
Support terms
Complete documentation, setup guide, and viva preparation included. Support for setup and explanation provided.