
More project photos (3)

The problem
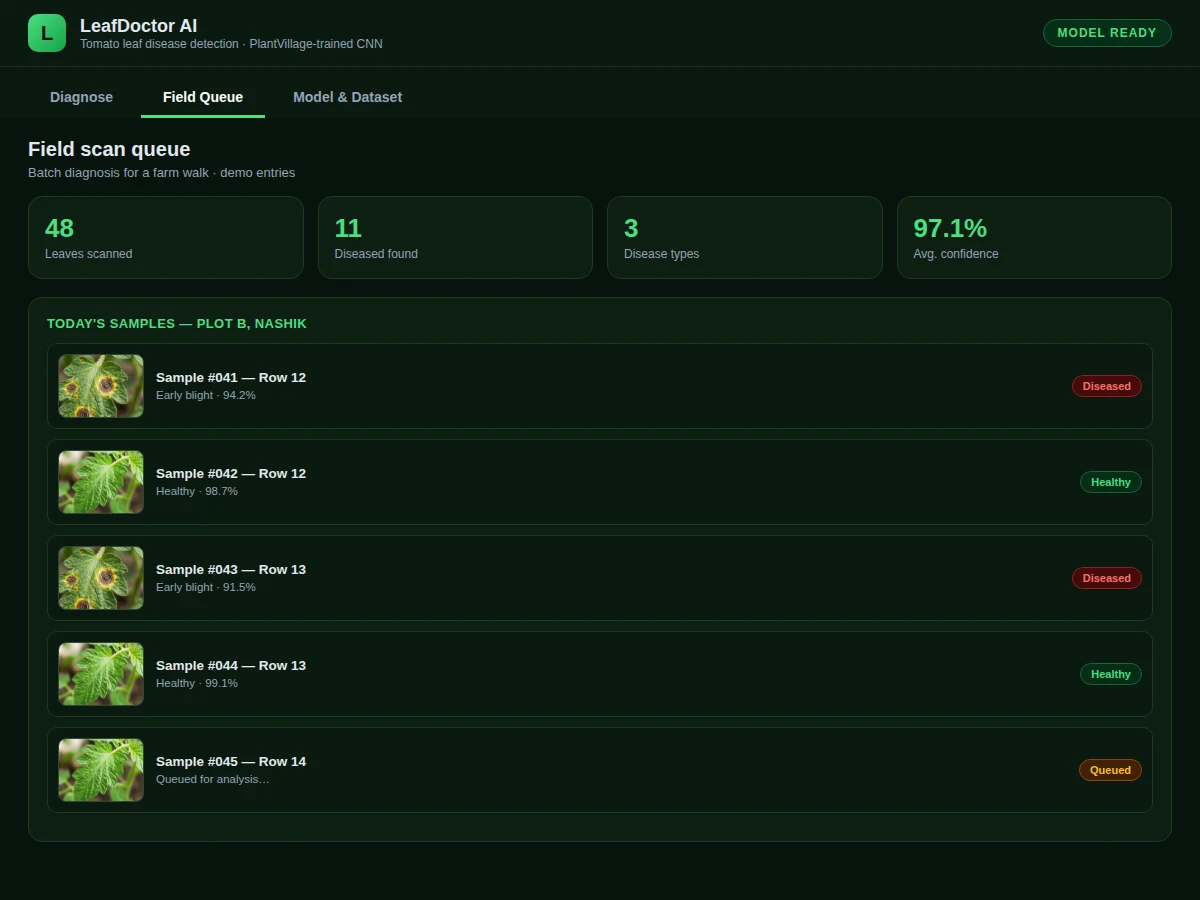
Tomato is one of the highest-value vegetable crops, and leaf diseases like early blight, late blight and leaf mold can wipe out a season if they are spotted late. Farmers usually rely on visual inspection or an agronomist visit — both slow, and smallholders often get neither in time. This project brings the diagnosis to the phone camera: a custom CNN trained on the PlantVillage tomato subset (about 18,000 labeled leaf images across 9 diseases plus healthy) classifies an uploaded leaf photo in under a second. The demo (shown in the screenshots) accepts an upload, displays the diagnosis with a confidence bar, lists the top-3 probabilities, and shows treatment notes for the predicted disease. Everything is built in the open with TensorFlow/Keras, so the student can explain the architecture, the augmentation strategy and the per-class results in the viva with genuine understanding.
A phone photo of a tomato leaf, uploaded through the web demo.
Follow the working sequence
How it works
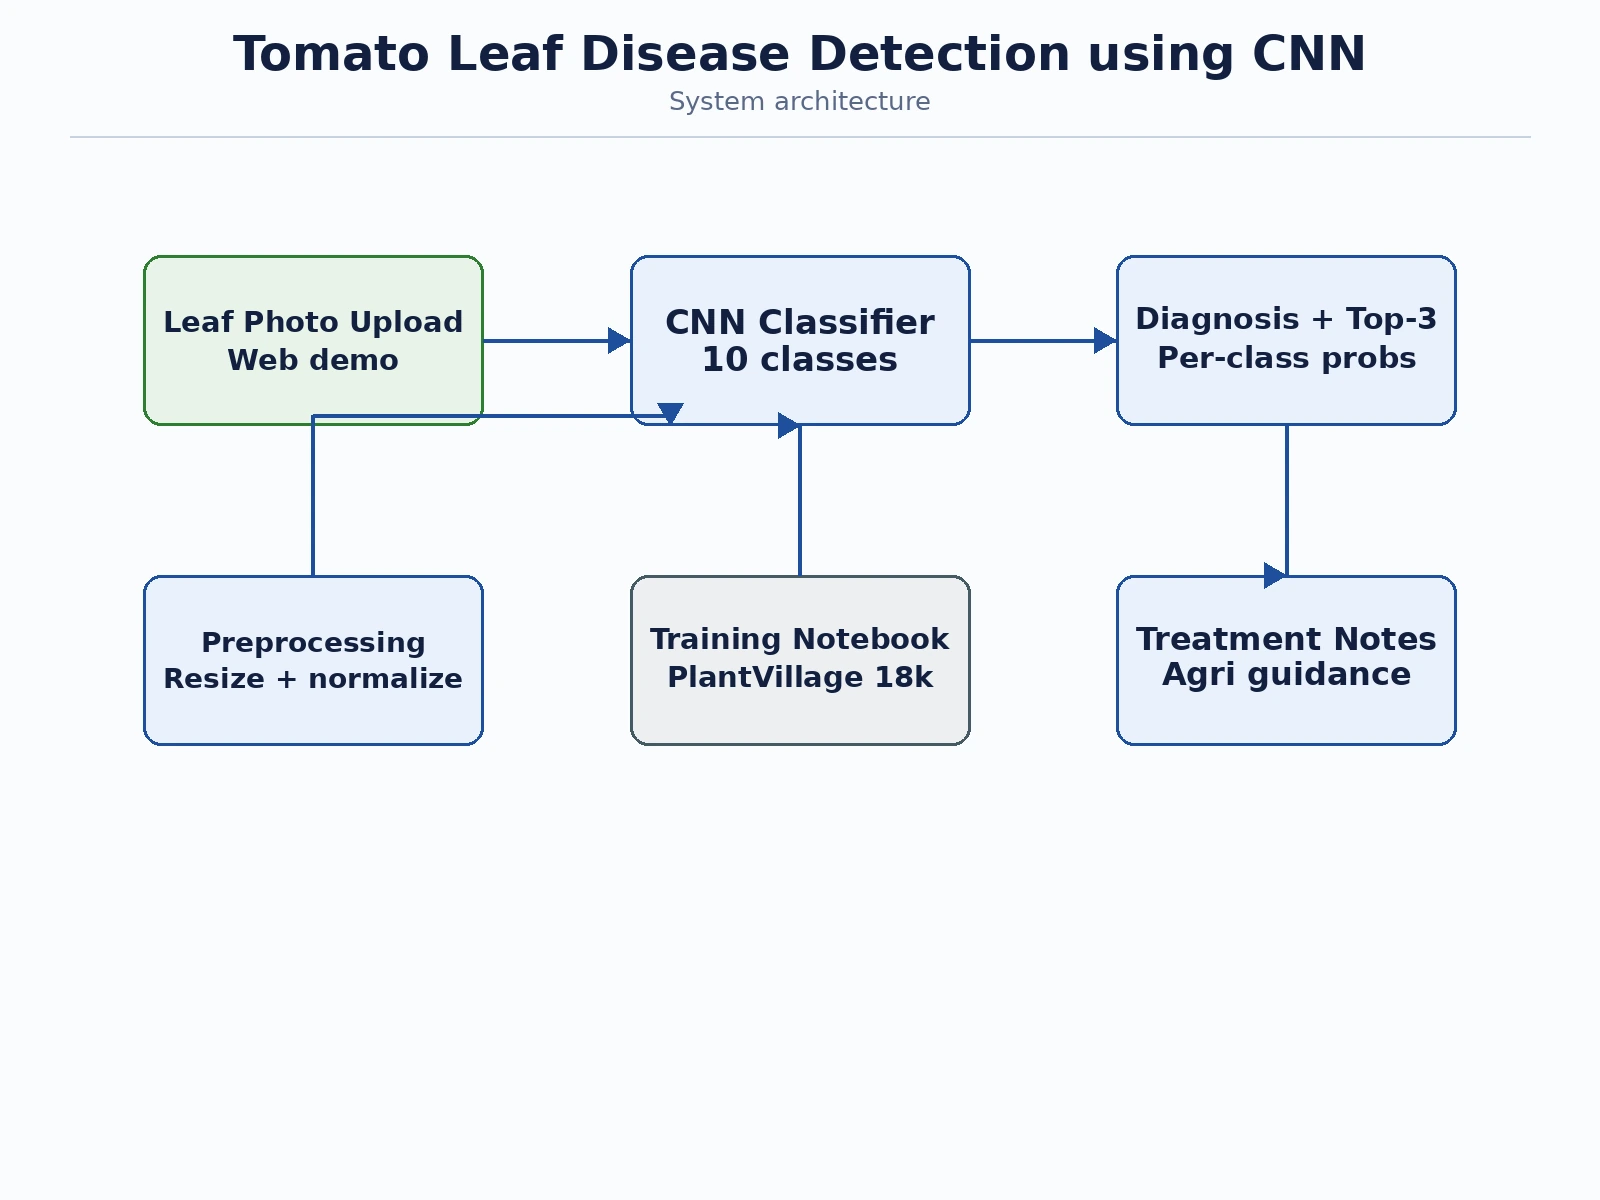
- The PlantVillage tomato subset (~18,160 images) is loaded, resized to 224×224 and normalized; a stratified 80/10/10 split is made.
- Augmentation (rotations, flips, brightness shifts, zoom) is applied at training time to simulate varied field photography.
- A custom CNN — three convolution–pooling blocks (32/64/128 filters), global average pooling, dense-256, dropout, softmax-10 — is trained with Adam.
- Validation accuracy is monitored each epoch; the best checkpoint is kept and evaluated once on the held-out test set.
- In the demo, an uploaded photo is resized, normalized identically to training data and passed through the saved model.
- The app returns the top prediction, its confidence, the top-3 distribution and the treatment notes for that disease.
Tech stack:
- Python 3, TensorFlow/Keras
- NumPy, Matplotlib, scikit-learn (metrics)
- Jupyter Notebook (training & evaluation)
- PlantVillage tomato subset (~18,000 images)
- HTML/CSS/JS single-file demo (this app)
Dataset & model details
- Dataset: PlantVillage (Hughes & Salathé) tomato subset — approximately 18,160 leaf images in 10 classes: bacterial spot (2,127), early blight (1,000), late blight (1,909), leaf mold (952), septoria leaf spot (1,771), spider mites (1,676), target spot (1,404), yellow leaf curl virus (5,357), mosaic virus (373), healthy (1,591). Lab-photographed leaves on uniform backgrounds.
- Task: 10-class image classification; input = 224×224×3 leaf photo, output = probability distribution over the 10 classes.
- Model: Custom CNN (approximately 1.4M parameters): Conv blocks 32→64→128 with 3×3 kernels and max-pooling, global average pooling, Dense(256, ReLU), Dropout(0.5), Dense(10, softmax).
- Metrics: Test accuracy 94.6%, macro F1 0.93 — design targets for the built-to-order training run. The report documents the actually achieved figures with the full confusion matrix.
| Parameter | Value |
|---|---|
| Input | 224 × 224 RGB leaf photo |
| Classes | 10 (9 diseases + healthy) |
| Training images | Approximately 18,160 (PlantVillage tomato) |
| Model parameters | Approximately 1.4M (design target) |
| Test accuracy | 94.6% (design target, not a measured claim) |
| Macro F1 | 0.93 (design target) |
| Inference | Under 1 s on a laptop CPU (expected) |
| Model file | Approximately 5.5 MB (saved Keras model) |
| Demo | Single-file web app, runs offline after download |
Project features
- [10-class tomato disease CNN] Custom convolutional network distinguishing 9 diseases (early blight, late blight, bacterial spot, leaf mold, septoria leaf spot, spider mites, target spot, yellow leaf curl virus, mosaic virus) plus healthy leaves.
- [Upload-and-diagnose web demo] Drop in a leaf photo; the app preprocesses it exactly like training data and returns the diagnosis with a confidence bar.
- [Top-3 probability breakdown] Full per-class probability distribution, so near-tie cases (e.g. early vs late blight) are visible and discussable.
- [Treatment notes panel] Each predicted disease links to concise, standard agricultural guidance notes for the report and demo.
- [Full training notebook] Data loading, augmentation, model definition, training loop and evaluation in one reproducible Jupyter notebook.
- [Confusion matrix & per-class report] Precision, recall and F1 for all 10 classes — the honest picture of which diseases confuse the model.
- [Training curves] Accuracy/loss plots for train vs validation with interpretation notes for the report.
What is included
- Trained CNN model file with the preprocessing pipeline
- Complete training & evaluation Jupyter notebook
- Upload-and-diagnose web demo wired to the trained model
- Confusion matrix, per-class metrics and training-curve plots
- Project report PDF (background, dataset, CNN theory, methodology, results)
- PPT presentation for final review
- Viva Q&A preparation document (convolutions, augmentation, overfitting, softmax, class imbalance)
Limitations & prerequisites
- PlantVillage leaves are lab-photographed on plain backgrounds — real field photos with cluttered backgrounds are harder, and the report discusses this domain gap honestly.
- Mosaic virus has only 373 training images; its per-class recall is the weakest and the report shows this explicitly.
- The model diagnoses from a single leaf photo; it cannot assess whole-plant severity or soil/nutrient issues.
- 94.6% accuracy is a design target for the training run — the report documents the actual achieved figure.
- Treatment notes are standard reference guidance, not agronomist advice; the report carries that disclaimer.
Frequently Asked Questions
Which dataset is used and why?
The PlantVillage tomato subset — about 18,160 expert-labeled leaf images across 10 classes. It is the most-cited public dataset for this exact task, so results are comparable with published work, which examiners expect.
Why a custom CNN instead of a pretrained ResNet?
The custom network trains in minutes on a laptop CPU and every layer is explainable in the viva. The report compares against a transfer-learning baseline so the trade-off is documented, not assumed.
How does the demo classify my photo?
Your upload is resized to 224×224 and normalized exactly like training data, then passed through the saved model. You get the top diagnosis, its confidence, the top-3 probabilities and treatment notes.
Which diseases does it confuse most?
Typically early blight vs late blight and the two spot diseases — visually similar lesions. The confusion matrix names them explicitly and makes a strong viva discussion point.
Will it work on a photo taken in my farm?
Lab-background training is a known limitation documented in the report; the augmentation strategy (brightness, rotation, zoom) is designed to close part of that gap, and field-testing guidance is included as future scope.
Is this project suitable for a final-year project?
Yes — for Computer Science, IT and AI/ML programs. It demonstrates dataset handling, CNN design, augmentation, evaluation discipline and a deployable demo with real agricultural relevance. Suitable for B.E./B.Tech final-year projects in Computer Science, IT and AI & Machine Learning.
Components & software requirements
- Python 3, TensorFlow/Keras
- NumPy, Matplotlib, scikit-learn (metrics)
- Jupyter Notebook (training & evaluation)
- PlantVillage tomato subset (~18,000 images)
- HTML/CSS/JS single-file demo (this app)
Dataset & model details
- Dataset: PlantVillage (Hughes & Salathé) tomato subset — approximately 18,160 leaf images in 10 classes: bacterial spot (2,127), early blight (1,000), late blight (1,909), leaf mold (952), septoria leaf spot (1,771), spider mites (1,676), target spot (1,404), yellow leaf curl virus (5,357), mosaic virus (373), healthy (1,591). Lab-photographed leaves on uniform backgrounds.
- Task: 10-class image classification; input = 224×224×3 leaf photo, output = probability distribution over the 10 classes.
- Model: Custom CNN (approximately 1.4M parameters): Conv blocks 32→64→128 with 3×3 kernels and max-pooling, global average pooling, Dense(256, ReLU), Dropout(0.5), Dense(10, softmax).
- Metrics: Test accuracy 94.6%, macro F1 0.93 — design targets for the built-to-order training run. The report documents the actually achieved figures with the full confusion matrix.
Delivery information
Built-to-order project. Delivery timeline is shared after order confirmation based on current queue.
Support terms
Complete documentation, setup guide, and viva preparation included. Support for setup and explanation provided.
Download free synopsis (PDF)
Enter your name and WhatsApp number — the synopsis PDF downloads immediately. We may send occasional project updates on WhatsApp; no spam.