
More project photos (3)
The problem
A network monitoring system is the screen a network administrator opens each morning: every switch, router, server and access point on the LAN, its reachability, its link utilization, and what broke overnight. Most small offices, college labs and campus networks do not have a network monitoring system — commercial suites are priced per device and carry enterprise features a small network never uses, so outages surface only when users complain, with the evidence of what failed first already gone. This project builds that missing screen from open-source parts: a Flask application that polls SNMP agents on every managed device, stores interface counters, CPU, memory and uptime as a time series, and raises threshold alerts. SNMP fits because it is the standard every managed device already speaks — no agent software to install, just UDP queries against the MIB counters the hardware maintains. The result is a laptop-runnable monitor a student can explain end to end: discovery, polling, storage, alerting, dashboard.
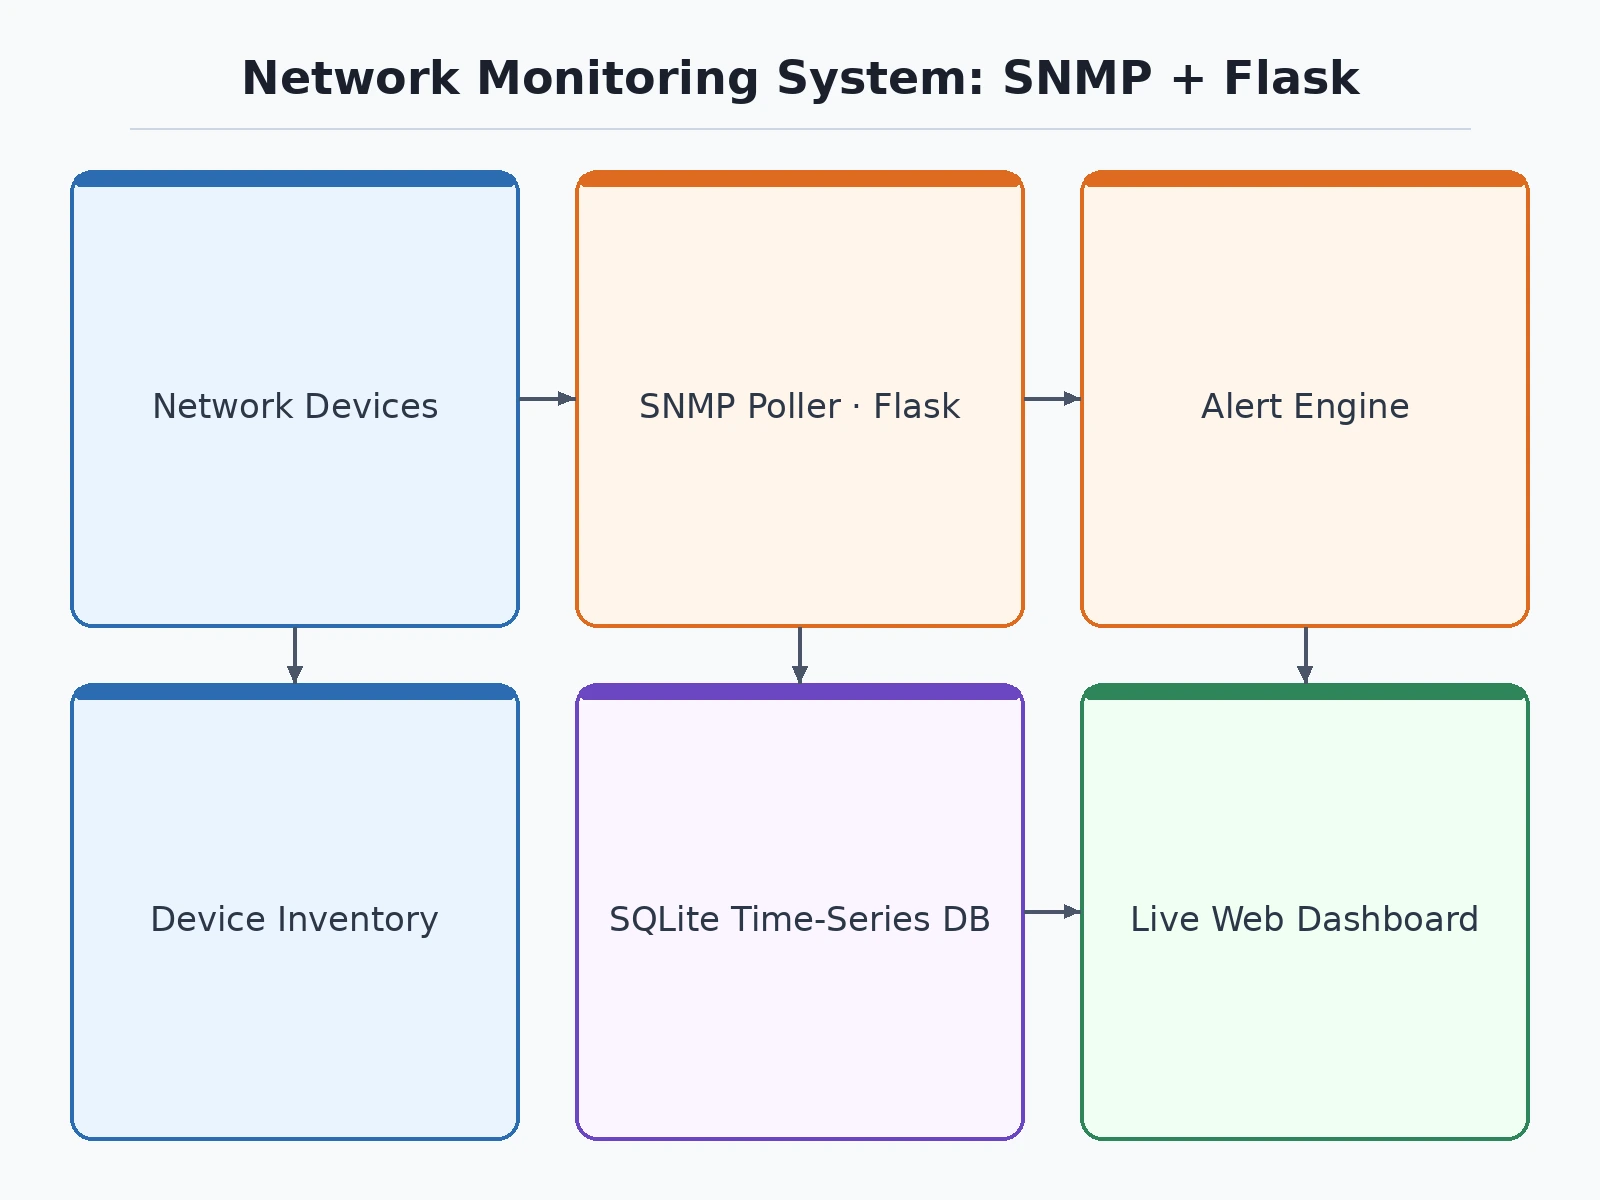
Switches, routers and servers on the LAN that answer SNMP queries about their counters.
Follow the working sequence
How it works
The pipeline runs end to end in four stages. Discovery comes first: the poller scans the configured subnet, sends an SNMP GET for sysDescr to each address, and promotes every responder into the inventory with its hostname and IP. Then the SNMP poll: each interval (60 seconds by default) the poller requests the system MIB — sysDescr, sysName, sysUpTime under 1.3.6.1.2.1.1 — and GETBULK-walks the ifTable (1.3.6.1.2.1.2.2) for interface counters, over UDP port 161 with a 5-second timeout and 3 retries. Processing turns counters into meaning: samples are timestamped and stored, bandwidth comes from counter deltas divided by elapsed time (SNMP counters only increase, so rates are derived, never read), and the rule engine compares CPU, memory, link state, error deltas and utilization against thresholds — firing after two consecutive breaches, clearing after three clean polls. Finally the dashboard renders it all: Flask serves the overview, inventory, interfaces and alert log from the stored series.
- Discovery scans the subnet with SNMP GET requests for sysDescr and registers responding devices with hostname and IP.
- Every poll interval, the scheduler walks the inventory: system MIB via GET, interface table via GETBULK, over UDP/161 with timeout and 3 retries.
- Samples are timestamped and stored; bandwidth is derived from counter deltas over elapsed time since SNMP counters are monotonically increasing.
- The rule engine evaluates link-down, CPU, memory, error-counter and utilization thresholds against the fresh samples.
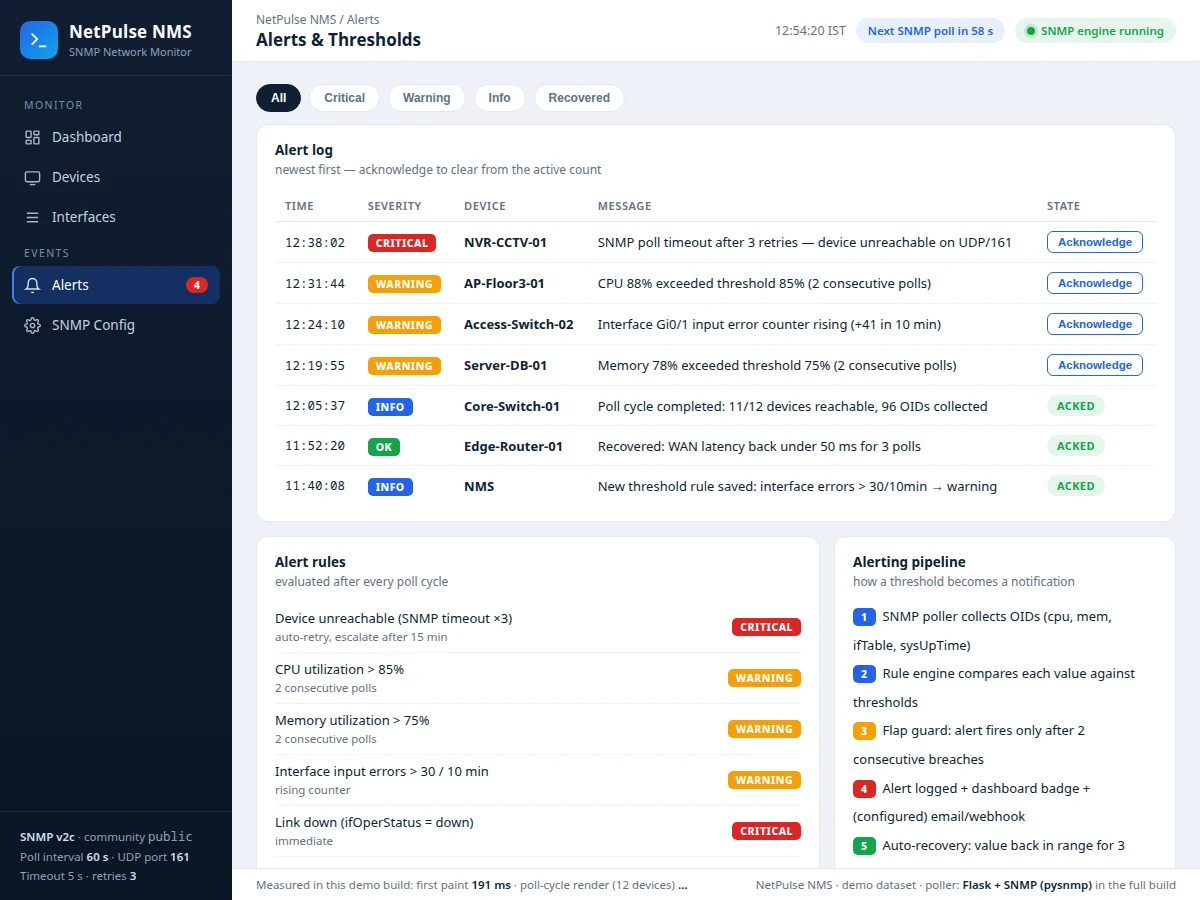
- Alerts fire after 2 consecutive breaches (flap guard), appear in the log and dashboard badge, and can be acknowledged.
- Three consecutive clean polls auto-recover an alert; the full history stays in the log with severity and timestamps.
- The Flask dashboard renders inventory, charts, interface counters and alerts from the stored series on every page load and poll cycle.
Tech stack:
- Python 3, Flask (web app, routes, poll scheduler)
- pysnmp (SNMP GET / GETBULK over UDP port 161)
- SQLite (timestamped samples, device inventory, alert log)
- HTML5, CSS, JavaScript (dashboard UI)
- Canvas 2D (bandwidth and traffic charts)
- Jinja2 templates (server-side page rendering)
- Interval scheduler (configurable poll cycle)
- Git (version control)
| Parameter | Value |
|---|---|
| SNMP transport | UDP port 161 (per RFC 1157) |
| SNMP versions | v1 / v2c / v3 (community or authPriv credentials) |
| MIBs polled | system MIB 1.3.6.1.2.1.1, ifTable 1.3.6.1.2.1.2.2 |
| sysUpTime unit | Hundredths of a second (TimeTicks, per MIB-II) |
| Counter width | 32-bit standard, 64-bit HC counters for high-speed interfaces (wrap at 4,294,967,295 for 32-bit) |
| Default poll interval | 60 seconds (configurable 30–300 s) |
| Poll timeout / retries | 5 s timeout, 3 retries per device (design target) |
| Demo inventory | 12 devices, 16 interfaces (design target) |
| Dashboard first paint | Tens to low-hundreds of ms (measured live in the demo build, varies per run) |
| Poll-cycle render, 12 devices | Low single-digit ms (measured live in the demo build, varies per run) |
| Avg SNMP latency, demo set | 3.6 ms across reachable agents (measured in the demo build) |
| Alert flap guard | Fire after 2 consecutive breaches, recover after 3 clean polls |
| Deployment | Laptop-runnable; one always-on host for production polling |
Project features
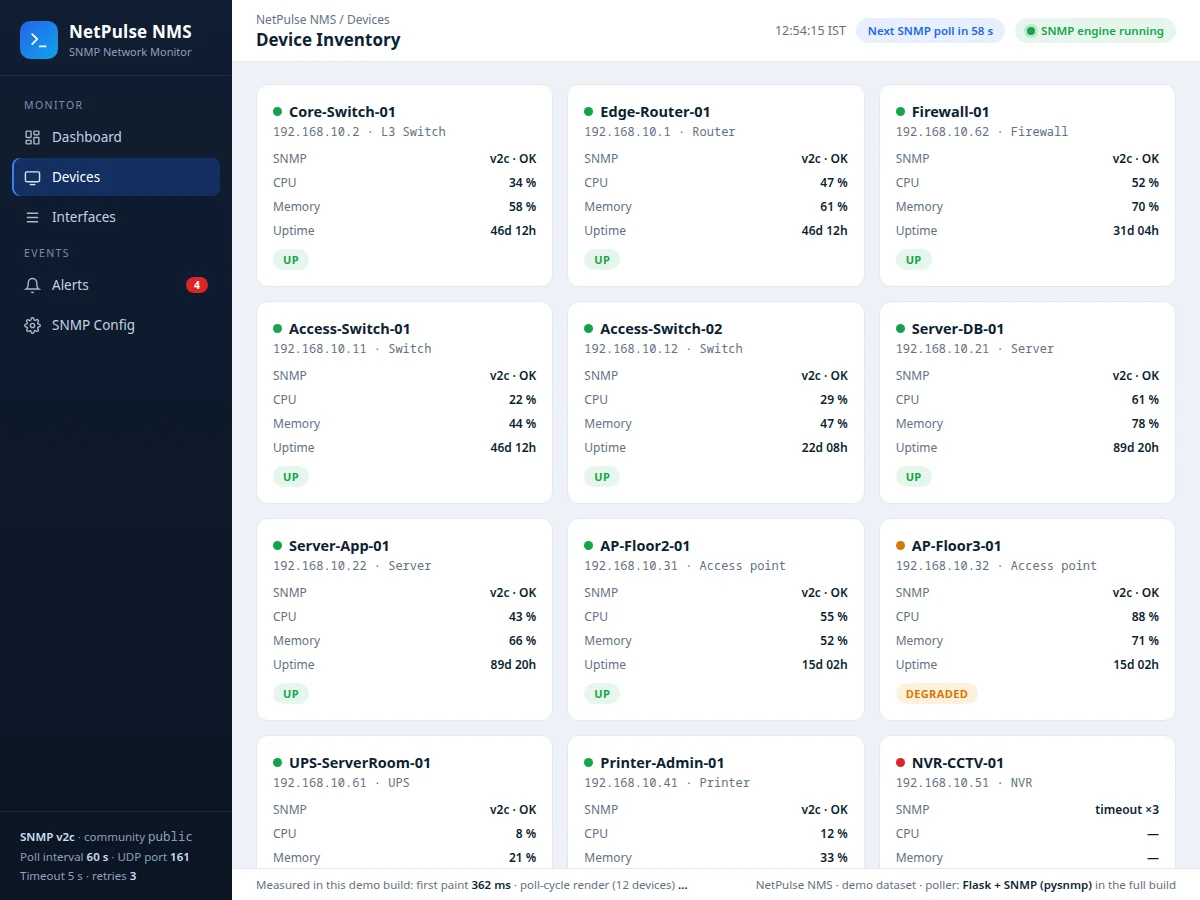
A network monitoring system lives or dies on four capabilities, and this build implements all four: a live dashboard that answers "what is happening right now" at a glance, an SNMP poller that collects real counters on a schedule with failure handling, a threshold alert engine that fires on genuine breaches without flapping, and a device inventory tying every number to a specific box. The dashboard shows aggregate bandwidth charts, top interfaces by utilization, per-device reachability and the latest alerts on one screen. The poller walks the standard MIBs — system identity from 1.3.6.1.2.1.1 and interface counters from 1.3.6.1.2.1.2.2 — over UDP port 161 with timeout and retries, marking a device down only after every retry fails. The alert engine evaluates link-down, CPU, memory, interface-error and utilization rules after each cycle, fires after two consecutive breaches, and auto-recovers after three clean polls. The inventory keeps hostname, IP, SNMP status, CPU, memory and uptime per device, with a per-interface detail view.
- [Live dashboard] Aggregate throughput chart, top interfaces by utilization, device-status table and latest alerts on one screen, refreshed every poll cycle with a visible countdown to the next SNMP poll.
- [SNMP poller with retries] Scheduled GET/GETBULK walks over UDP port 161; per-device timeout (5 s default) with 3 retries — a device is marked down only after all retries fail, because over connectionless UDP a dead device is indistinguishable from a dropped packet.
- [Threshold alert engine] Rules for link-down, CPU, memory, interface errors and bandwidth utilization; alerts fire after 2 consecutive breaches (flap guard) and auto-recover after 3 clean polls.
- [Device inventory + detail views] 12-device demo inventory with hostname, IP, SNMP status, CPU, memory and uptime; click-through detail shows per-interface traffic charts, ifTable counters and the system MIB identity block.
- [Interface counters page] Every polled interface with live in/out Mbps, utilization against ifSpeed, and 64-bit ifInOctets totals — the raw material for capacity planning.
- [Acknowledge workflow] One-click acknowledge moves an alert out of the active count; the log keeps the full history with severity, device, message and timestamp.
- [SNMP configuration page] Version (v1/v2c/v3), community string, UDP port, timeout, retries and poll interval editable from the UI and applied at the next cycle; devices can be added to the inventory from a form.
- [Measured demo build] The shipped demo reports its own real timings in the footer — first paint in the tens-to-low-hundreds of ms, poll-cycle render for 12 devices in low single-digit ms — so performance claims are observed, not asserted.
Optional at order time: SNMPv3 authPriv credentials, email/webhook notification wiring, trap (event-driven) reception alongside polling. Future scope: NetFlow/sFlow ingestion, ML-based anomaly detection on the time series, multi-poller federation.
What is included
- Flask application: SNMP poller, scheduler, threshold alert engine and dashboard
- Device inventory, interface-counters and alert-log pages with working acknowledge workflow
- SNMP configuration page (version, community, port, timeout, retries, interval, add-device)
- Working demo build with a 12-device simulated agent set, exercisable without hardware
- Project report PDF (background, SNMP/MIB theory, architecture, methodology, results)
- PPT presentation for final review
- Viva Q&A preparation document (SNMP, MIB/OID structure, UDP vs TCP polling, counter deltas, flap-guard logic)
Limitations & prerequisites
- Polling is interval-based (default 60 s): sub-minute outages between polls are not caught — event-driven trap reception is future scope.
- SNMPv2c community strings travel in cleartext on the LAN; use SNMPv3 authPriv for any production deployment.
- Counter-derived bandwidth is only as accurate as poll regularity; delayed polls skew the computed rate for that interval.
- 32-bit counters on fast interfaces wrap frequently — the build uses 64-bit HC counters where the agent supports them, but old devices may not.
- The demo build simulates agents; a live deployment needs real SNMP-enabled devices with credentials configured.
- Alerting is log + dashboard based as shipped; email/webhook delivery is an optional add-on, not included by default.
- Capacity guidance (how many devices per poller host) is a design target, not a measured benchmark — it depends on network latency and agent response times.
Frequently Asked Questions
How does SNMP actually collect the data?
The poller sends SNMP GET requests for named counters — sysName, sysUpTime, interface byte counters — to each device's agent over UDP port 161, and GETBULK walks to pull whole tables like ifTable efficiently. The agent replies with current counter values; the poller timestamps them, stores them, and computes bandwidth from the difference between consecutive polls. No software is installed on the monitored devices.
Why UDP and not TCP for polling?
Because that is how SNMP is specified (RFC 1157): requests go out as datagrams on UDP port 161 with no connection setup, which keeps polling cheap at scale. The trade-off is that a dead device looks exactly like a dropped packet, so the poller cannot trust a single timeout — this build uses a 5-second timeout with 3 retries and only marks a device down when all retries fail.
How are the bandwidth graphs computed?
SNMP interface counters (ifInOctets/ifOutOctets) only ever increase, so the poller subtracts the previous sample from the current one and divides by the elapsed seconds to get bits per second. On 32-bit counters a fast interface can wrap between polls, which is why the build prefers 64-bit high-capacity counters where the agent supports them and guards the delta math against wraps.
What stops alerts from flapping on and off?
A flap guard in the rule engine: a threshold must be breached on two consecutive poll cycles before an alert fires, and the value must stay clean for three consecutive cycles before the alert auto-recovers. Single-sample spikes from a delayed poll therefore never page anyone, and genuine sustained problems still surface within about two minutes at the default 60-second interval.
Can this monitor a real college lab network?
Yes, with real hardware. Any managed switch, router or access point with SNMP enabled answers the same OIDs the demo uses — the only change is pointing the poller at real IPs with the correct community string or SNMPv3 credentials. The demo build ships with a 12-device simulated agent set so every screen works without hardware, and the configuration page is where real devices get added.
Is this project suitable for a final-year project?
Yes — for Computer Science, IT and Computer Engineering programs. It covers computer networks (SNMP, MIB/OID structure, UDP telemetry), backend development (Flask, scheduling, SQLite) and frontend work (dashboard, charts), and every layer is visible enough to defend in a viva.
Components & software requirements
- Python 3, Flask (web app, routes, poll scheduler)
- pysnmp (SNMP GET / GETBULK over UDP port 161)
- SQLite (timestamped samples, device inventory, alert log)
- HTML5, CSS, JavaScript (dashboard UI)
- Canvas 2D (bandwidth and traffic charts)
- Jinja2 templates (server-side page rendering)
- Interval scheduler (configurable poll cycle)
- Git (version control)
Delivery information
Built-to-order project. Delivery timeline is shared after order confirmation based on current queue.
Support terms
Complete documentation, setup guide, and viva preparation included. Support for setup and explanation provided.
Download free synopsis (PDF)
Enter your name and WhatsApp number — the synopsis PDF downloads immediately. We may send occasional project updates on WhatsApp; no spam.