
More project photos (3)

The problem
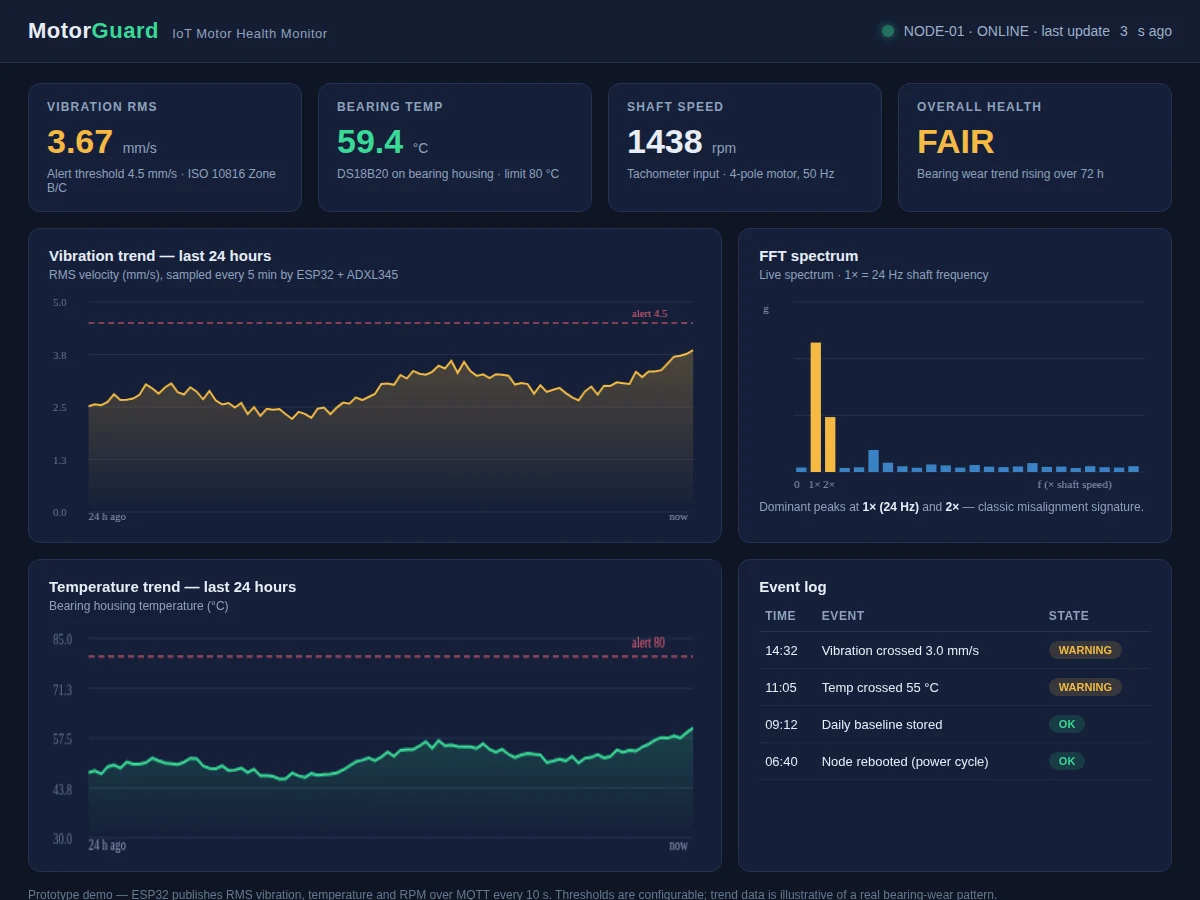
Motors rarely fail without warning — bearings wear, misalignment grows, and vibration rises for days or weeks first. Industry watches this with condition-monitoring systems that cost more than the motors in a college lab, so students learn "vibration analysis" as a chapter and never touch a sensor. This project brings it to the bench: a small DC motor on a test stand, a MEMS accelerometer glued to its housing, a temperature probe on the bearing, and an ESP32 that streams RMS vibration, temperature and RPM to a dashboard over Wi-Fi. The dashboard plots trends, computes a live FFT spectrum, and logs threshold crossings. The student learns what 1x and 2x spectral peaks mean, sets alert bands, and watches a real wear trend develop — the full sense-to-dashboard pipeline of industrial condition monitoring, at student scale.
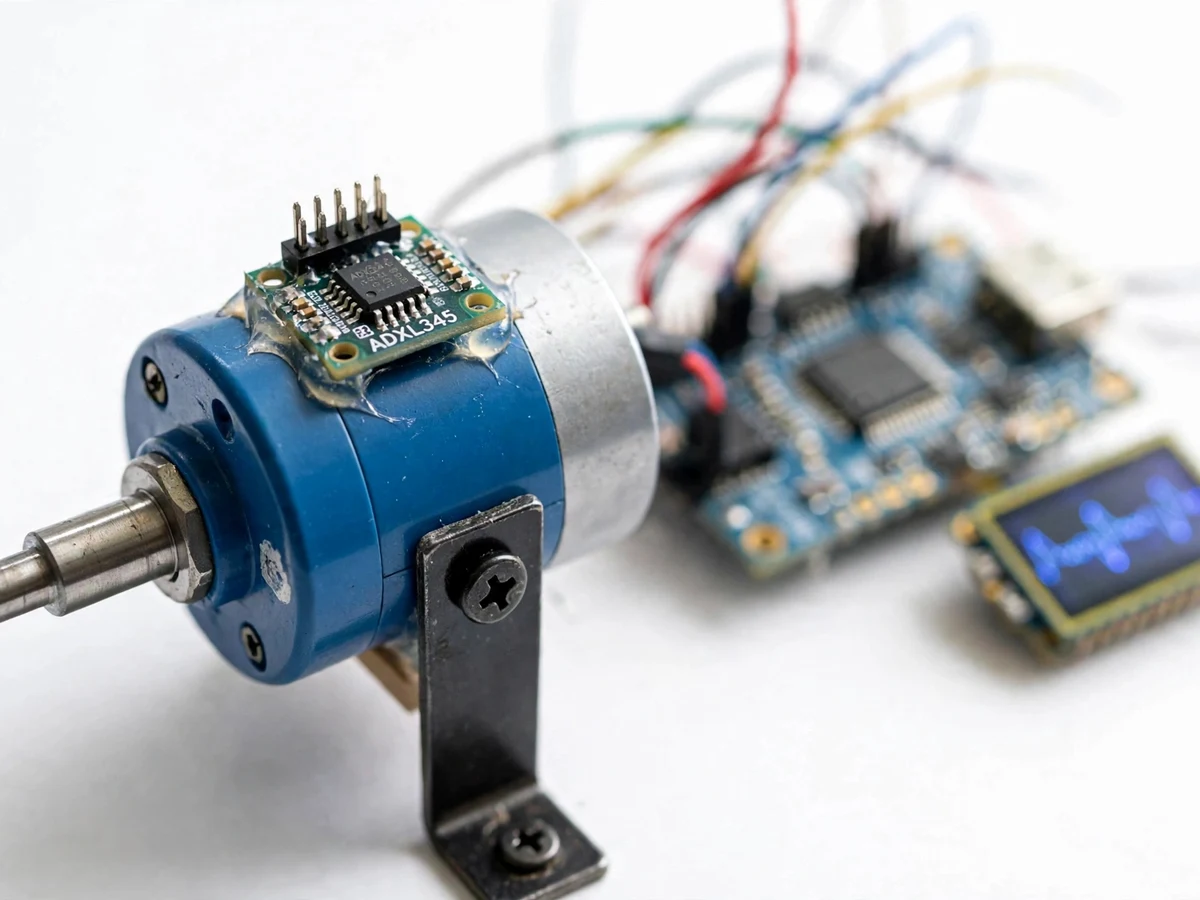
Small DC motor on the test stand whose health is monitored.
Follow the working sequence
How it works
- The ADXL345 is rigidly mounted on the motor housing; the DS18B20 probe sits on the bearing housing.
- The ESP32 samples acceleration at a fixed rate, computes RMS vibration velocity, and reads temperature and RPM.
- Every few seconds the node publishes the readings over Wi-Fi (MQTT/HTTP) to the dashboard backend.
- The dashboard appends the data to 24-hour trend charts and runs an FFT on the latest vibration window for the spectrum view.
- Thresholds (set by the student against ISO 10816-style zones) are checked on each update; crossings are written to the event log with timestamps.
- The student introduces a known condition (e.g. slight shaft misalignment via a shim) and observes the 1x/2x spectral response.
- Over a multi-day run, the rising RMS trend demonstrates bearing-wear detection — the core value proposition of condition monitoring.
Tech stack:
- ESP32 development board (Wi-Fi)
- ADXL345 MEMS accelerometer
- DS18B20 temperature probe
- Small DC motor on test stand
- Tachometer/pulse RPM input
- MQTT broker + web dashboard (HTML/JS)
- Arduino IDE (C/C++ firmware)
- 5 V power supply
| Parameter | Value |
|---|---|
| Vibration sensor | ADXL345 MEMS accelerometer, housing-mounted |
| Computed metric | RMS vibration velocity (mm/s), firmware-computed |
| Temperature | DS18B20 on bearing housing, alert limit configurable (design 80 C) |
| Speed input | Tachometer pulse, RPM displayed |
| Update rate | Every few seconds over Wi-Fi (design) |
| Spectrum | Live FFT with 1x shaft-frequency marking |
| Alerting | Configurable vibration/temperature thresholds + event log |
| Threshold basis | ISO 10816-style zones used as guidance; student sets final values |
Project features
- [Vibration sensing] ADXL345 MEMS accelerometer on the motor housing; firmware computes RMS velocity from the acceleration samples.
- [Bearing temperature] DS18B20 probe on the bearing housing tracks the thermal side of bearing health.
- [Live IoT dashboard] Web dashboard with 24-hour vibration and temperature trend charts, updating every few seconds over MQTT/Wi-Fi.
- [FFT spectrum view] Live spectrum with shaft-frequency (1x) marking — 1x/2x peaks indicate misalignment, the classic teaching signature.
- [Configurable alerts] Vibration and temperature thresholds with an event log; crossing a threshold raises a dashboard warning.
- [RPM input] Tachometer/pulse input records shaft speed so spectra are interpreted against the true running speed.
- [Wear-trend experiment] A documented procedure runs the motor over days and records the rising vibration trend — the student's own condition-monitoring dataset.
What is included
- Working motor health monitor (test-stand motor, sensor node, dashboard)
- Complete ESP32 firmware source code (sampling, RMS, MQTT publish)
- Dashboard web app (trends, FFT, event log, thresholds)
- Sensor mounting and wiring documentation
- Threshold-setting guide with ISO 10816 zone reference
- Wear-trend experiment procedure and data sheet template
- Project report PDF (condition monitoring theory, signal chain, methodology, experiment)
- PPT presentation for final review
- Viva Q&A preparation document (vibration analysis, FFT, RMS, ISO zones, MQTT)
- Setup and demonstration guide
Limitations & prerequisites
- A MEMS accelerometer on a small demo motor is a teaching proxy — it demonstrates the method, not certified industrial vibration analysis; no diagnostic claims beyond what the student's data shows.
- The FFT resolution is limited by the ESP32's sampling rate and window size; fine bearing-defect frequencies are indicative, not definitive.
- Thresholds are guidance-based (ISO 10816 zones); the student sets and justifies final values for their rig.
- Wi-Fi dropouts pause the dashboard feed; the node does not buffer long outages in the base build.
- Temperature and vibration trends need multi-day runs to show wear — a single-day demo shows the pipeline, not the trend.
Frequently Asked Questions
What does the FFT spectrum show?
It breaks the vibration signal into frequencies. A peak at 1x (shaft speed) with a smaller 2x peak is the classic misalignment signature — the student learns to read it, then creates it deliberately with a shim to verify.
What are the ISO 10816 zones?
An international standard's vibration-severity bands (A/B/C/D) for machines. They are used as guidance for setting the dashboard's alert thresholds; the student sets final values for their own rig.
Can it detect a bad bearing?
It demonstrates the detection method — rising RMS trend plus spectral changes. Definitive bearing-defect diagnosis needs higher-resolution analysis; this build teaches the pipeline honestly.
How does data reach the dashboard?
The ESP32 publishes readings over Wi-Fi via MQTT/HTTP every few seconds; the dashboard subscribes and updates the charts live.
What are the main limitations?
Teaching-grade MEMS sensing, limited FFT resolution, guidance-based thresholds, no long outage buffering, and wear trends need multi-day runs.
Is this project suitable for a final-year project?
Yes — for Mechatronics, Electrical and IoT programs. It demonstrates vibration analysis, embedded sensing, FFT, and IoT dashboards, all strong viva material. Suitable for B.E./B.Tech final-year projects in Mechatronics, Electrical and IoT engineering.
Components & software requirements
- ESP32 development board (Wi-Fi)
- ADXL345 MEMS accelerometer
- DS18B20 temperature probe
- Small DC motor on test stand
- Tachometer/pulse RPM input
- MQTT broker + web dashboard (HTML/JS)
- Arduino IDE (C/C++ firmware)
- 5 V power supply
Delivery information
Built-to-order project. Delivery timeline is shared after order confirmation based on current queue.
Support terms
Complete documentation, setup guide, and viva preparation included. Support for setup and explanation provided.
Download free synopsis (PDF)
Enter your name and WhatsApp number — the synopsis PDF downloads immediately. We may send occasional project updates on WhatsApp; no spam.