
More project photos (2)
The problem
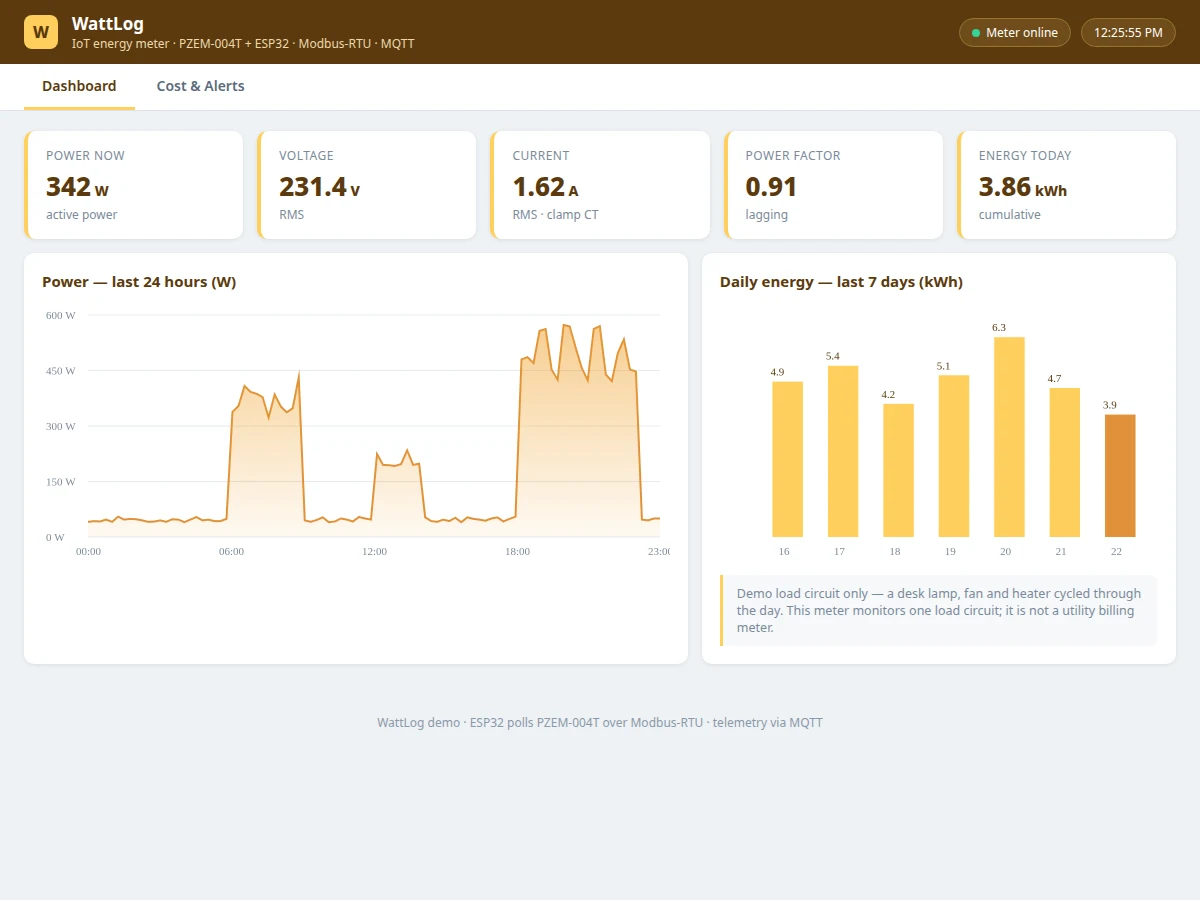
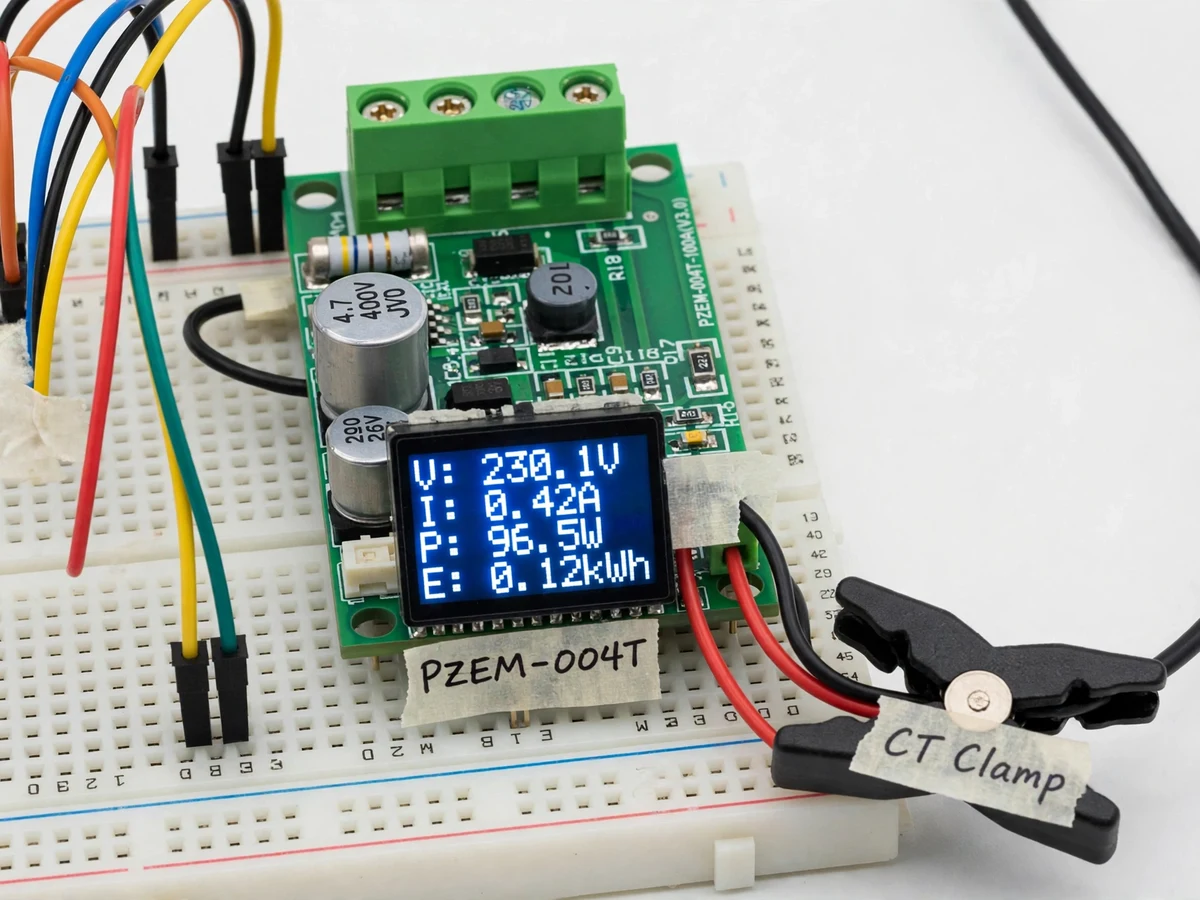
Energy monitoring is one of the most genuinely useful IoT builds: it makes invisible consumption visible. This meter does it with real metrology instead of estimates. A PZEM-004T module — with its own current transformer and voltage sensing — measures true RMS voltage, current, active power, power factor and cumulative energy of a connected demo load; an ESP32 reads it over Modbus-RTU, publishes the data over Wi-Fi via MQTT, and a live dashboard renders the current draw, power trend graph, daily energy bars and a running cost estimate from a configurable tariff. A daily budget feature alerts when consumption crosses the set kWh, and an overload threshold flags abnormal draw. The listing is careful about scope: this monitors a single demo load circuit (it is not a replacement for the utility meter), and CT orientation and burden behavior are documented so the viva covers real metering concepts.
How it works
- The PZEM-004T's clamp CT and voltage terminals measure the demo load circuit; its internal DSP computes RMS voltage, current, active power, power factor and cumulative energy.
- The ESP32 polls the module over Modbus-RTU (TTL serial) on a fixed interval and validates each frame's checksum.
- Readings are published as JSON over Wi-Fi via MQTT to the cloud backend, which stores the time series.
- The dashboard renders live power, the power trend graph, daily energy bars, cumulative totals and the tariff-based cost estimate.
- When daily consumption crosses the configured budget — or instantaneous power crosses the overload threshold — a push alert is sent.
- The CT orientation and zero-offset notes in the setup guide keep the measurements honest; the report's data section is built from the buyer's own logged readings.
Tech stack:
- ESP32 development board
- PZEM-004T energy metering module + clamp CT
- Modbus-RTU over TTL serial
- MQTT broker + cloud dashboard (web)
- Configurable tariff engine (dashboard-side)
- Mobile push alert service
- Arduino IDE (C/C++ firmware)
| Parameter | Value |
|---|---|
| Controller | ESP32, Modbus-RTU polling of PZEM-004T, MQTT telemetry |
| Metering | PZEM-004T: RMS V/I, active power, power factor, cumulative kWh (module datasheet values) |
| CT | Clamp-type current transformer, single demo-load circuit |
| Dashboard | Live power, trend graph, daily bars, cumulative totals, tariff cost estimate |
| Budget/alerts | Configurable daily kWh budget + overload power threshold → push alerts |
| Logging | Timestamped series for daily/weekly comparison in the report |
| Power | 5 V DC logic; metered circuit is a demo load only |
Project features
- [True electrical metrology] PZEM-004T with clamp CT measures RMS voltage, current, active power, power factor and cumulative energy — real metering, not estimates.
- [Live consumption dashboard] Current power draw, power trend graph, daily energy bars and cumulative totals on a working dashboard alongside the hardware.
- [Tariff cost estimate] A configurable per-kWh tariff converts energy into a running cost estimate — the number that makes consumption tangible.
- [Daily budget alerts] A configurable daily kWh budget triggers a push alert when crossed, with the dashboard showing progress against it.
- [Overload flagging] A configurable power threshold flags abnormal draw (e.g. a forgotten heater) on the dashboard and via alert.
- [Modbus-RTU interfacing] The ESP32 talks to the PZEM-004T over Modbus-RTU — genuine industrial-protocol experience for the report.
- [Load-profile logging] Timestamped readings are stored for daily/weekly comparison, so the report's data section shows real consumption patterns.
What is included
- Working energy-meter prototype (ESP32, PZEM-004T with clamp CT, demo load)
- Complete firmware source code (Modbus polling, checksum validation, MQTT telemetry, alert logic)
- Cloud pipeline + working dashboard (live power, graphs, cost estimate, alerts) demonstrated with the prototype
- Circuit and wiring documentation with CT orientation and AC safety notes
- Component list with ratings
- Tariff configuration and buyer-run verification procedure (compare against a plug meter)
- Project report PDF (energy metering background, Modbus/power-factor theory, methodology, test procedure)
- PPT presentation for final review
- Viva Q&A preparation document (true vs apparent power, CT behavior, Modbus framing)
- Setup and demonstration guide
Limitations & prerequisites
- This monitors a single demo load circuit; it is not a replacement for, or wired into, the building's utility meter or distribution board.
- Metering accuracy follows the PZEM-004T module's datasheet; the verification procedure compares it against a plug-in power meter during the buyer's own check — no certified-meter claims.
- Cost estimates depend on the buyer-entered tariff; time-of-day tariffs are a possible extension, not in the base build.
- Push alerts need internet on the node and the phone; outages queue nothing.
- CT must be clamped with correct orientation and on the live conductor only — documented in the safety notes.
Frequently Asked Questions
What does the meter measure?
RMS voltage, current, active power, power factor and cumulative energy of a demo load circuit, using a PZEM-004T module with a clamp CT.
How does the dashboard work?
The ESP32 polls the module over Modbus-RTU, publishes readings via MQTT, and the dashboard shows live power, trend graphs, daily energy bars and a tariff-based cost estimate.
How accurate are the readings?
Module-datasheet accuracy; the verification procedure has you compare against a plug-in power meter. It is a teaching meter, not a certified billing instrument.
How is cost estimated?
You enter your per-kWh tariff and the dashboard converts cumulative energy into a running cost. Time-of-day tariffs are future scope.
What are the main limitations?
Single demo-load circuit (never building wiring), datasheet-grade accuracy, buyer-entered tariff, internet-dependent alerts.
Is this project suitable for a final-year project?
Yes — for IoT and Embedded Systems programs. It covers real electrical metrology, Modbus-RTU, MQTT telemetry and honest measurement discipline, all strong viva material. Suitable for B.E./B.Tech final-year projects in IoT and Embedded Systems.
Components & software requirements
- ESP32 development board
- PZEM-004T energy metering module + clamp CT
- Modbus-RTU over TTL serial
- MQTT broker + cloud dashboard (web)
- Configurable tariff engine (dashboard-side)
- Mobile push alert service
- Arduino IDE (C/C++ firmware)
Delivery information
Built-to-order project. Delivery timeline is shared after order confirmation based on current queue.
Support terms
Complete documentation, setup guide, and viva preparation included. Support for setup and explanation provided.