
More project photos (2)
The problem
The Interactive Periodic Table Web App with Element Explorer and Quiz Mode is a browser-based learning tool that presents the complete periodic table of 118 elements as a clickable, colour-coded grid. Clicking or hovering over any element opens a detail panel showing its symbol, atomic number, standard atomic weight and chemical category, while category filters and a text search let a student isolate one family of elements or jump straight to a single element. A built-in quiz mode then turns that browsing into active revision: it asks questions drawn at random from all 118 elements, accepts the student's answer, and keeps a live score and streak across a set of 10 questions. The whole application is a single HTML file with embedded CSS and JavaScript, so it opens in any modern browser with no installation, server or database.
Students usually meet the periodic table as a static poster or a dense textbook table, which makes it hard to connect an element's position with its identity and properties. Memorisation becomes rote: symbols, atomic numbers and categories are revised from lists rather than explored as a system, and there is no quick way to self-test. This project closes that gap with an interactive grid that rewards curiosity — a student can compare halogens side by side, find iron in one search, and immediately check what they remember in quiz mode. Because the element data lives in one visible data table inside the page, the app is also easy to explain in a review: the grid, the detail panel, the filters and the quiz all read from the same source.
One table holds all 118 elements with symbol, number, weight and category.
How it works
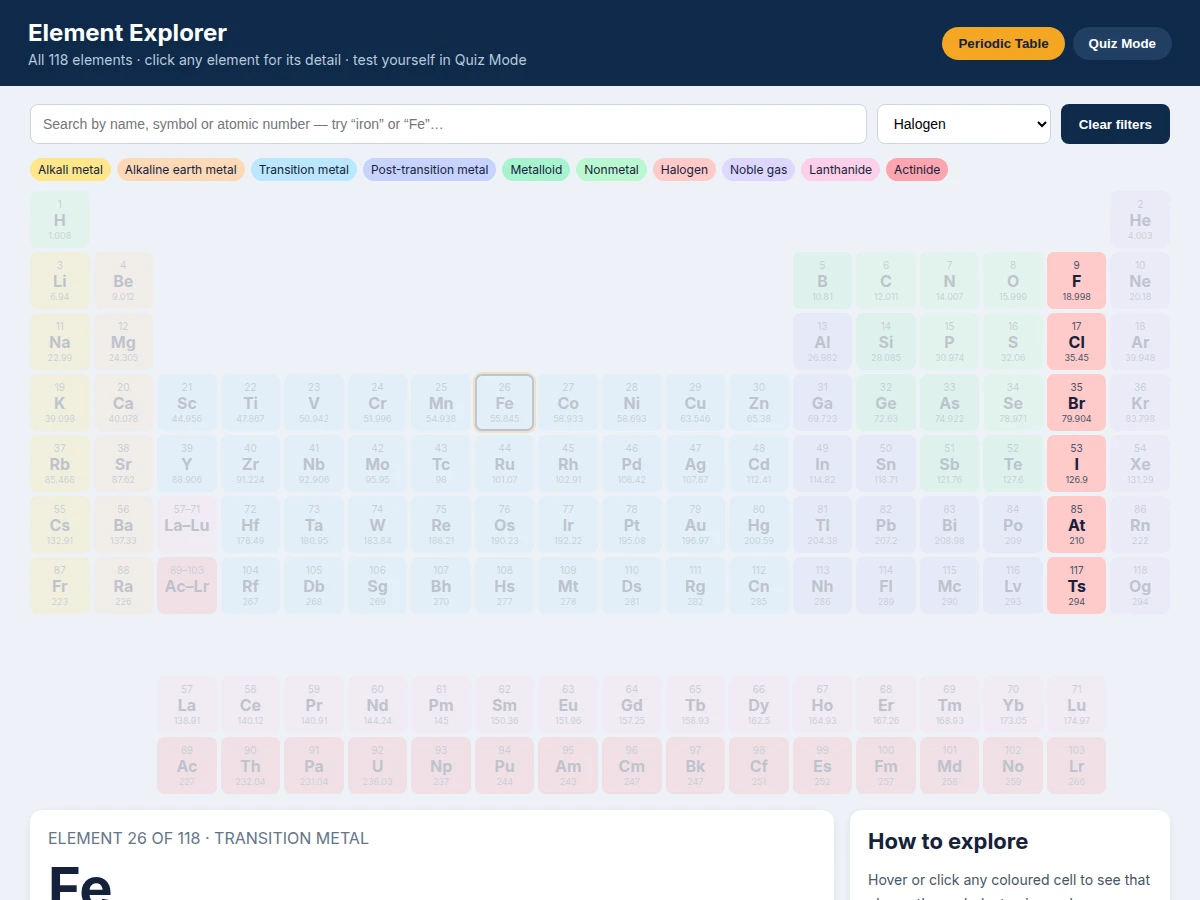
The Interactive Periodic Table Web App with Element Explorer and Quiz Mode works as one continuous flow: the app first draws the full periodic-table grid from a single element data table in the page, colouring each cell by category and placing lanthanides and actinides in their dedicated rows below the main table. Clicking or hovering over a cell sends that element's record to the detail panel, which shows its name, symbol, atomic number, standard atomic weight and category. Choosing a category filter dims every element outside that family, and typing in the search box highlights the matching element by name, symbol or atomic number. Switching to quiz mode starts a 10-question round drawn at random from all 118 elements, where each answer is marked immediately, the score and streak update live, and the final screen reports the round total.
- The app loads a single data table of 118 elements, each with a symbol, name, standard atomic weight, category and grid row and column.
- The grid renderer draws the main table in 18 columns, placing the lanthanide and actinide series in two rows below it with range placeholders in the main grid.
- Clicking or hovering over a cell passes that element's record to the detail panel, which displays its name, symbol, atomic number, standard atomic weight and category.
- Selecting a category from the filter or legend dims all cells outside that category, leaving one chemical family visible for comparison.
- Typing in the search box matches against element names, symbols and atomic numbers and highlights the matching cell.
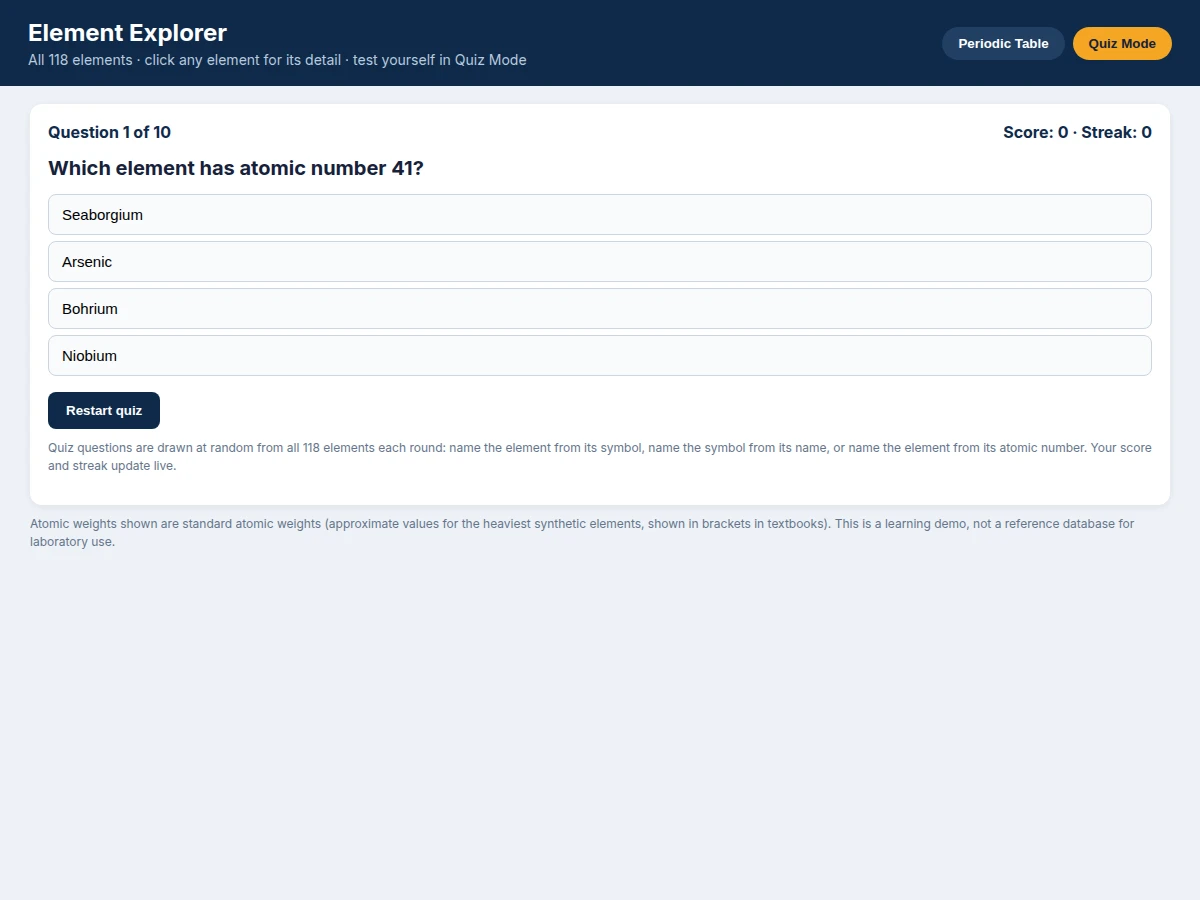
- Quiz mode picks a random element and a random question type — symbol to name, name to symbol, or atomic number to name — and shuffles it with three other elements as options.
- Selecting an answer marks it right or wrong immediately, updates the score and streak, and shows the correct element's name, symbol and atomic number.
- After 10 questions the quiz shows the final score and offers a restart, which draws a fresh random set of questions.
Tech stack:
- HTML5, CSS3 and vanilla JavaScript (single-file app)
- Standard periodic-table element data (symbols, atomic numbers, standard atomic weights)
- Browser local rendering (no server-side framework)
- Chrome DevTools screenshot capture (demo images only)
| Parameter | Value |
|---|---|
| Elements covered | 118 elements (count, hydrogen to oganesson) |
| Element fields | Symbol, name, atomic number, standard atomic weight, category (5 fields) |
| Categories | 10 categories (count) |
| Grid layout | 18 columns (count) plus 2 f-block rows (count) |
| Quiz round | 10 questions (count) per round |
| Question types | 3 types (count: symbol to name, name to symbol, atomic number to name) |
| Answer options | 4 options (count) per question |
| Files | 1 HTML file (count, single-file build) |
| Server required | None (runs offline after download) |
| Browser support | Any modern desktop browser (expected) |
| Data source | Standard periodic-table reference values (published atomic weights) |
Project features
The Interactive Periodic Table Web App with Element Explorer and Quiz Mode gives students four headline capabilities: a complete clickable grid of all 118 elements with real symbols, atomic numbers and standard atomic weights; an element detail panel that updates instantly on click or hover; category filtering and text search that isolate one chemical family or jump to a single element; and a quiz mode that asks symbol, name and atomic-number questions, marks answers immediately and tracks score and streak across 10 questions. Around those four capabilities, the app adds a colour-coded legend for the 10 element categories, a f-block layout that keeps lanthanides and actinides in their correct rows below the main table, and a fully offline single-file build that runs from one HTML file in any modern browser.
- [Complete 118-element grid] Every element from hydrogen (atomic number 1) to oganesson (atomic number 118) appears in its correct table position, coloured by category, with its symbol, atomic number and standard atomic weight visible on the cell. Implemented.
- [Element detail panel] Clicking or hovering over any element updates the detail panel with its name, symbol, atomic number, standard atomic weight, category and grid position, so comparisons between elements take one click. Implemented.
- [Category filtering and legend] Ten category filters — alkali metals, alkaline earth metals, transition metals, post-transition metals, metalloids, nonmetals, halogens, noble gases, lanthanides and actinides — dim the rest of the table so one family can be studied alone. Implemented.
- [Search by name, symbol or number] Typing "iron", "Fe" or "26" in the search box highlights the matching element, so a student can locate any element without scanning the whole grid. Implemented.
- [Quiz mode with live scoring] Each quiz round asks 10 questions drawn at random from all 118 elements — name the element from its symbol, name the symbol from its name, or name the element from its atomic number — with immediate right/wrong feedback, a running score and a streak counter. Implemented.
- [Lanthanide and actinide rows] The f-block elements sit in two dedicated rows below the main table, with range placeholders (57–71 and 89–103) in the main grid, matching the layout of a standard printed periodic table. Implemented.
- [Single-file offline build] The app is one HTML file containing its own CSS, JavaScript and element data, so it opens by double-clicking the file and needs no server, database or internet connection after download. Implemented.
Optional customization: additional quiz question types (for example, category questions or atomic-weight questions), a progress tracker across sessions, and a printable revision sheet can be added on request. Future scope: user accounts with saved quiz history, a spaced-repetition revision mode, and a teacher view with class-level quiz results are possible improvements, not included in the base project.
What is included
- Complete single-file HTML, CSS and JavaScript web application
- Element dataset for all 118 elements (symbols, names, atomic numbers, standard atomic weights, categories)
- Working quiz engine with random question selection, immediate feedback, score and streak tracking
- Project report PDF (background, system design, element-data notes, methodology, testing notes)
- PPT presentation for final review
- Viva Q&A preparation document (periodic-table layout, DOM rendering, quiz logic, data-table design)
- Setup and demo guidance document
Limitations & prerequisites
- Atomic weights for the heaviest synthetic elements are approximate published values, not measured laboratory data, and are labelled as such in the app.
- The app covers element identity and category only; it does not teach electronic configuration, bonding or chemical reactions.
- Quiz questions are limited to 3 types (symbol, name and atomic number); category or atomic-weight questions are an optional addition, not in the base build.
- Quiz progress is not saved between sessions; closing the page resets the score and streak, since there is no database or user account.
- The single-file build is designed for desktop browsers; on very small phone screens the 18-column grid requires horizontal scrolling.
- Element data is a fixed reference table, not a live scientific database, so future IUPAC weight revisions would need a manual data update.
- The app is an academic learning tool, not a certified chemistry reference for laboratory or examination use.
Frequently Asked Questions
Is this project suitable for a final-year project?
Yes, for Computer Science, IT and Web Development students, because it demonstrates front-end engineering that a reviewer can inspect directly: a data-driven grid rendered from a single dataset, event-driven detail updates, filtering and search logic, and a stateful quiz engine with scoring. The work is visible in the browser, the code is small enough to explain line by line, and the report documents the data-table design and quiz algorithm. It also suits students who want a complete, demonstrable web project without a backend.
What is the main technology used?
Plain HTML, CSS and JavaScript in a single file, with no framework, server or database — the grid is rendered from a JavaScript data table of 118 elements, and the detail panel, filters and quiz are browser DOM updates and event handling. This keeps the project easy to run, easy to host and easy to explain in a review.
Does it need the internet to run?
No — once the single HTML file is downloaded, the whole app runs offline in the browser, because the element data, grid, filters, search and quiz logic are all embedded in that one file, and nothing in the base build calls a server or an external API. An internet connection is only needed for the first download and for optional online hosting. This makes it reliable for classroom demos and reviews without depending on Wi-Fi.
Can this project be customized?
Yes — realistic additions include more quiz question types (category or atomic-weight questions), a session progress tracker, a printable revision sheet, and a different visual theme or colour scheme, all scoped by feasibility and timeline before they are promised; larger changes such as user accounts with saved quiz history or a teacher dashboard are possible as separate development work, and the base build stays untouched unless an addition is agreed.
What are the main limitations?
The app teaches element identity and category only, not bonding, reactions or electronic configuration, and atomic weights for the heaviest synthetic elements are approximate published values rather than measured laboratory data, while quiz progress is not saved between sessions and the wide grid needs horizontal scrolling on small phone screens. The full list of limitations, with the reasons behind each, is given in the Limitations section above.
What will I receive with the project?
You receive the complete single-file web app with the 118-element dataset and quiz engine, plus the report, PPT, viva Q&A document and setup guidance — everything delivered as files you can open in a browser and present directly, with no server setup or paid service required. Optional additions agreed at order time are delivered alongside the base build.
Components & software requirements
- HTML5, CSS3 and vanilla JavaScript (single-file app)
- Standard periodic-table element data (symbols, atomic numbers, standard atomic weights)
- Browser local rendering (no server-side framework)
- Chrome DevTools screenshot capture (demo images only)
Delivery information
Built-to-order project. Delivery timeline is shared after order confirmation based on current queue.
Support terms
Complete documentation, setup guide, and viva preparation included. Support for setup and explanation provided.
Download free synopsis (PDF)
Enter your name and WhatsApp number — the synopsis PDF downloads immediately. We may send occasional project updates on WhatsApp; no spam.