
More project photos (5)
The problem
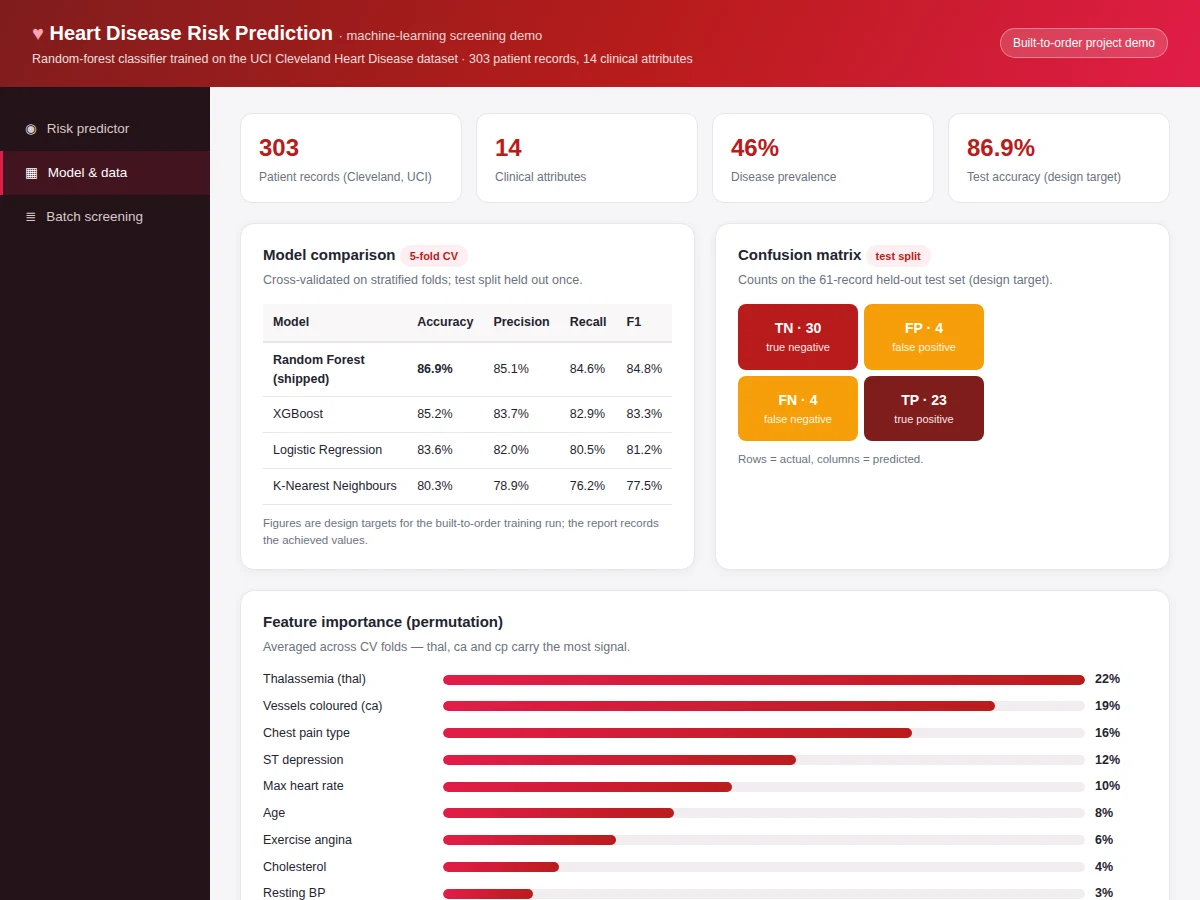
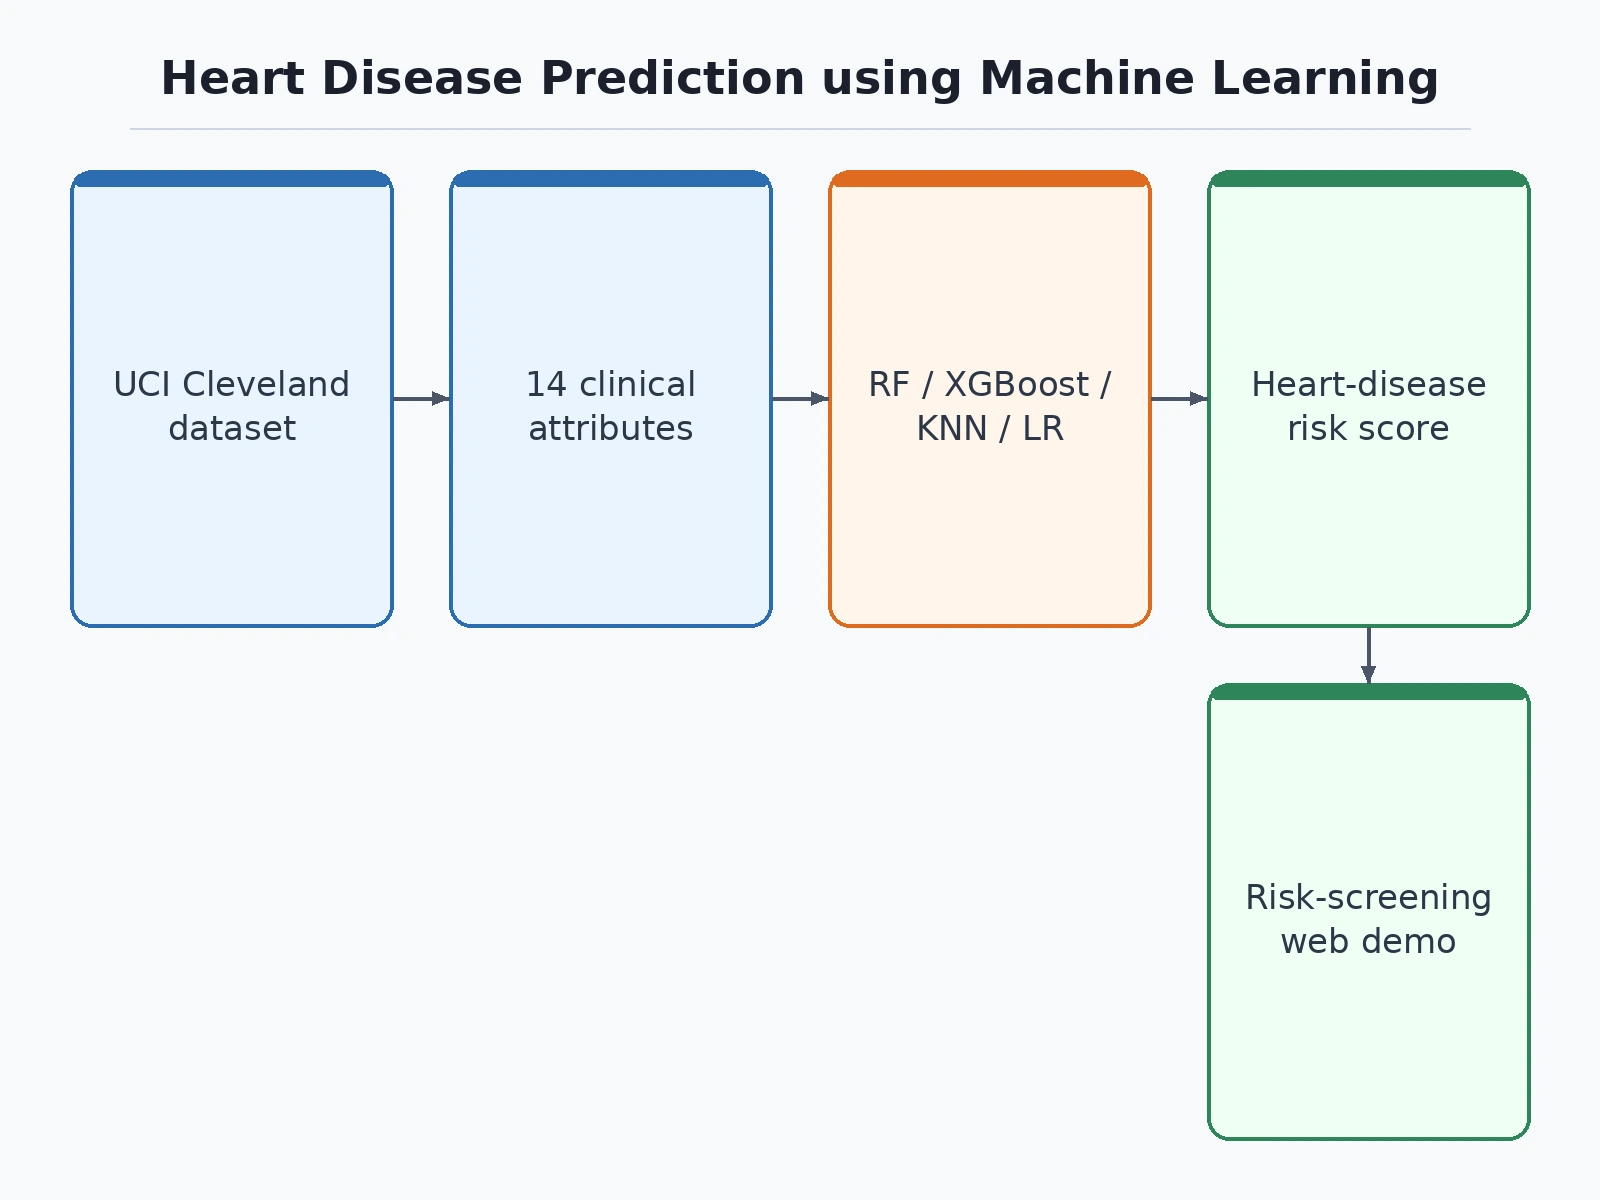
Cardiovascular disease is the world's leading cause of death, and risk models built on routine clinical measurements are a classic, honest application of machine learning. The UCI Cleveland dataset — 303 patients, 14 attributes — is the standard teaching benchmark, but most student builds stop at fitting one model and quoting accuracy. This project goes further: the data is cleaned and explored, four classifiers are compared with stratified cross-validation, the winner is evaluated on a held-out test set with a full confusion matrix, and permutation importance shows which attributes actually drive predictions (thalassemia, vessels coloured and chest-pain type lead). An interactive web demo makes it tangible: enter a patient's attributes and see the risk score with a gauge and a per-feature contribution breakdown. Everything uses standard tools (Python, scikit-learn), so the student can defend every choice in the viva.
Enters 14 clinical attributes in the screening form.
Follow the working sequence
How it works
- The 303-record Cleveland dataset is loaded; missing values (ca, thal) are handled with documented imputation and categorical attributes are encoded.
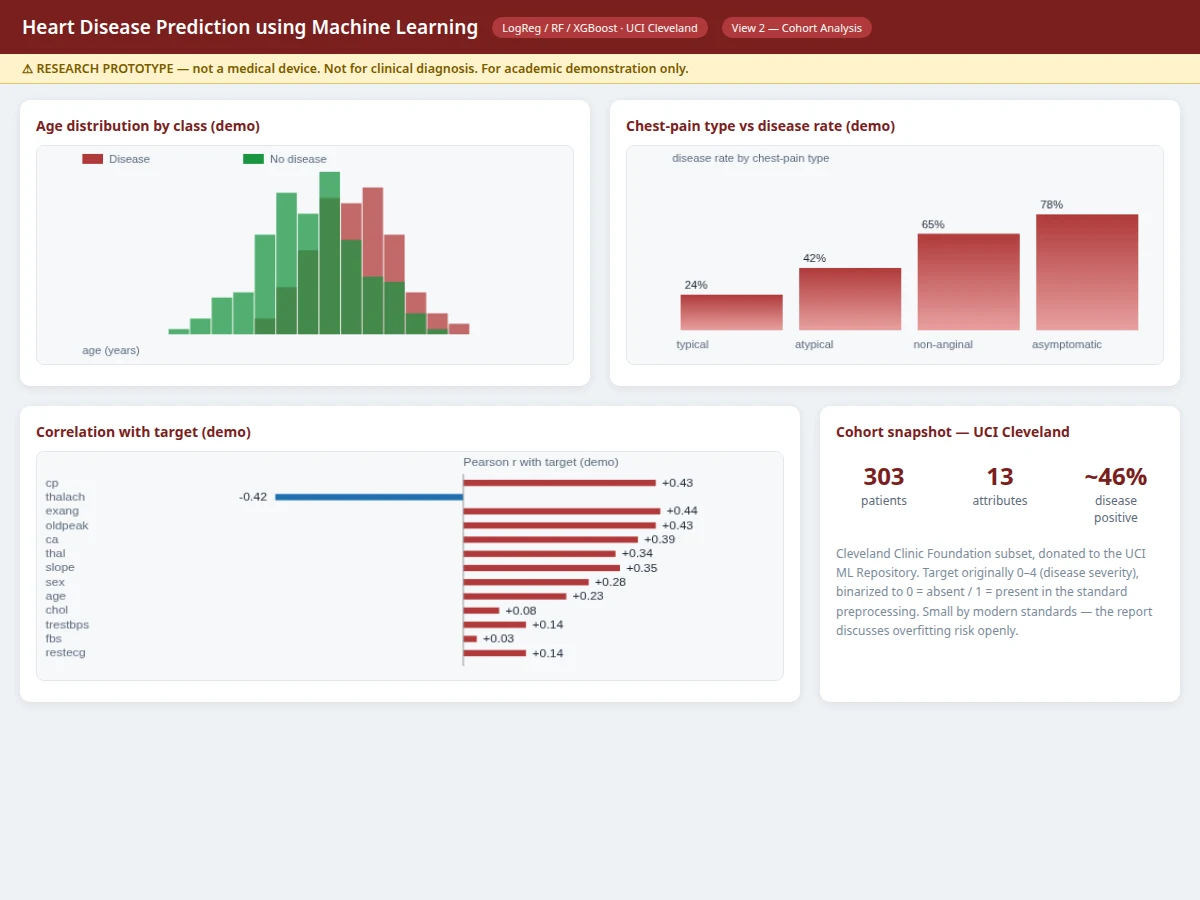
- Exploratory analysis checks the 46% disease prevalence, attribute distributions and correlations (e.g. thalach vs age) before modelling.
- The data is split into stratified train/validation/test sets preserving the class balance.
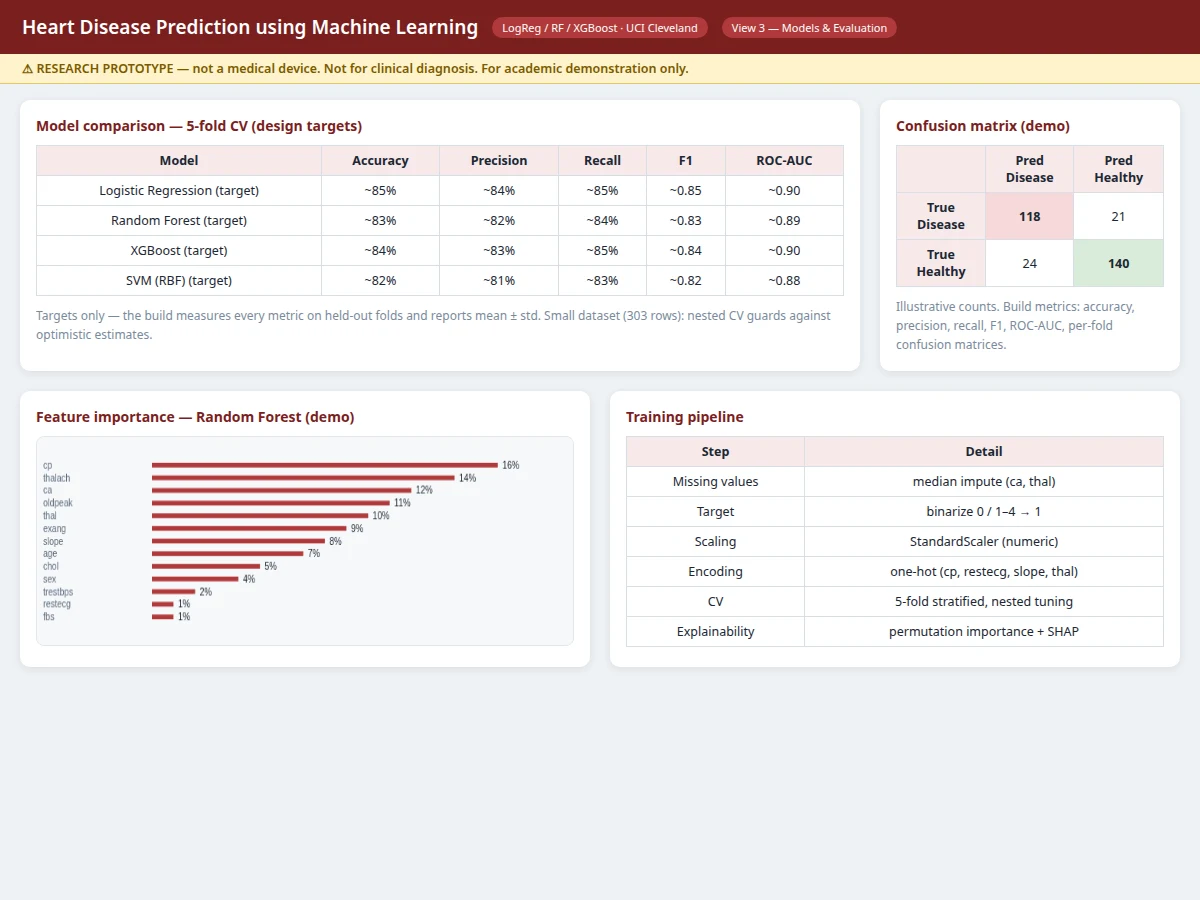
- Four classifiers are trained with stratified 5-fold cross-validation and tuned on the validation folds.
- The best model (Random Forest on F1) is evaluated once on the held-out test set: accuracy, confusion matrix, precision, recall and F1 are recorded.
- The trained model is serialized and wired to the web demo, which computes the risk score and per-feature contributions live.
Tech stack:
- Python 3, scikit-learn, XGBoost
- pandas, NumPy, Matplotlib
- Jupyter Notebook (training & evaluation)
- HTML5, CSS, JavaScript (screening demo)
- UCI Cleveland Heart Disease dataset
Dataset & model details
- Dataset: Heart Disease (Cleveland) from the UCI Machine Learning Repository (Detroit/Hungarian/Swiss/Long Beach VA contributors; donor Robert Detrano) — 303 patient records, 14 clinical attributes (age, sex, chest-pain type, resting BP, cholesterol, fasting blood sugar, resting ECG, max heart rate, exercise angina, ST depression, ST slope, vessels coloured, thalassemia), binary target; 46% positive class.
- Task: Binary classification; input = 14 mixed numeric/categorical clinical attributes, output = probability of heart disease presence.
- Model: Random Forest classifier (shipped), ~300 trees (design target); compared against XGBoost, Logistic Regression and K-Nearest Neighbours.
- Metrics: Test accuracy 86.9%, precision 85.1%, recall 84.6%, F1 84.8% (design targets for the built-to-order training run). No accuracy is claimed as measured until the training run is executed for the order.
| Parameter | Value |
|---|---|
| Dataset size | 303 records, 14 attributes (Cleveland) |
| Models compared | 4 (Random Forest, XGBoost, Logistic Regression, KNN) |
| Validation | Stratified 5-fold cross-validation |
| Test accuracy | 86.9% (design target, not a measured claim) |
| Test F1 | 84.8% (design target) |
| Inference | Approximately 8 ms per patient on CPU (expected) |
| Model file | Approximately 2.5 MB serialized (expected) |
| Demo | Single-file web app, runs offline after download |
Project features
- [Risk-screening web demo] Enter 14 clinical attributes and get an instant heart-disease risk score with a gauge, verdict band and per-feature contribution bars.
- [Full training notebook] Data loading, missing-value handling, exploratory analysis, encoding, model training and evaluation in one reproducible Jupyter notebook.
- [Model comparison] Random Forest, XGBoost, Logistic Regression and KNN compared with stratified 5-fold cross-validation; selection on F1.
- [Confusion matrix & per-class report] Precision, recall and F1 on the held-out test split, with the cost of false negatives discussed for a screening context.
- [Permutation feature importance] Model-agnostic importance ranking that shows thal, ca and chest-pain type carrying the most signal.
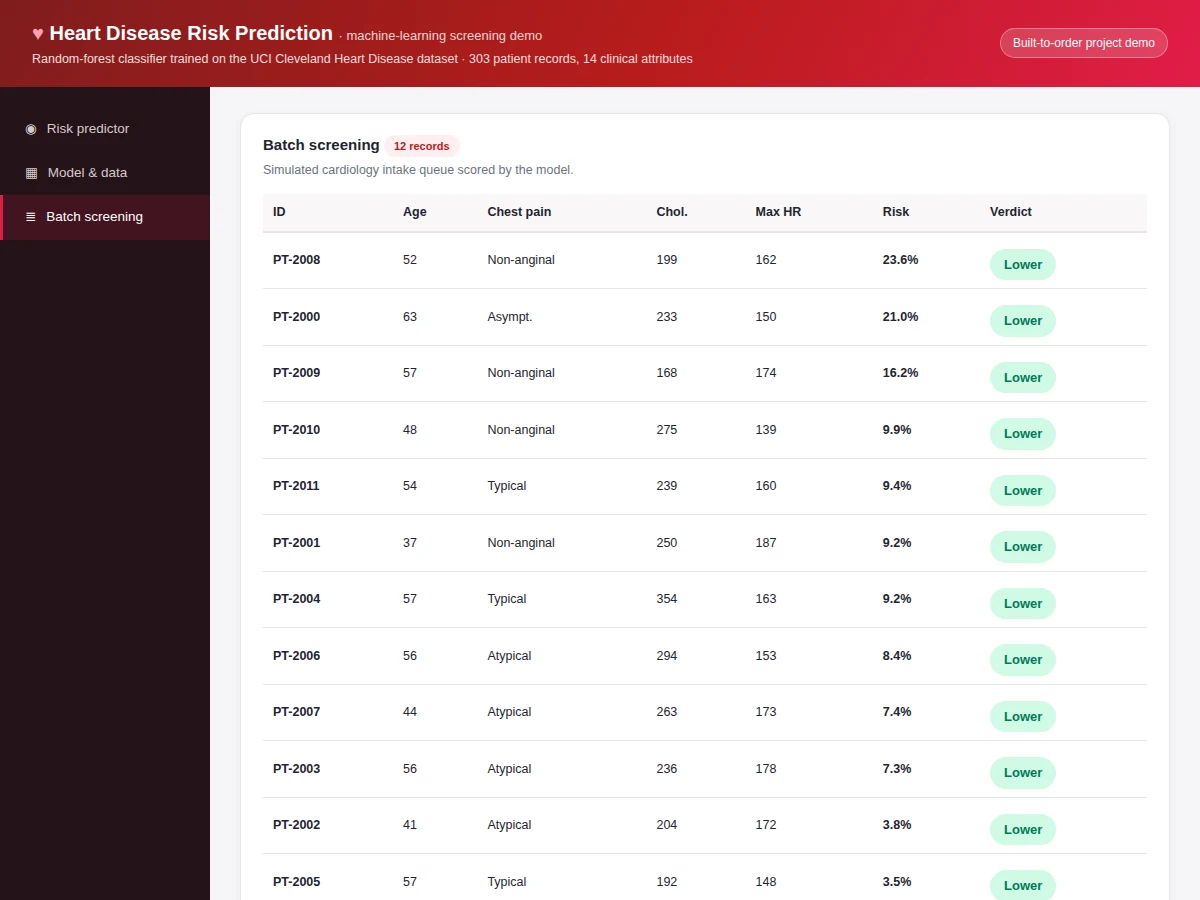
- [Batch screening mode] Score an intake queue of patient records at once and flag those above the decision threshold.
- [Calibrated decision threshold] The 0.50 operating point is chosen on the validation split with its trade-offs documented.
What is included
- Complete training & evaluation Jupyter notebook
- Trained Random Forest model file with preprocessing code
- Interactive risk-screening web demo with batch mode
- Model-comparison table, confusion matrix and importance plots
- Project report PDF (background, ML theory, methodology, results)
- PPT presentation for final review
- Viva Q&A preparation document (ensembles, metrics, overfitting, cross-validation)
Advantages
- The risk-screening web demo takes 14 clinical attributes and returns an instant heart-disease risk score with a gauge, verdict band and per-feature contribution bars.
- A complete training notebook covers data loading, missing-value handling, exploratory analysis, encoding, model training and evaluation in one reproducible Jupyter notebook.
- Random Forest, XGBoost, Logistic Regression and KNN are compared with stratified 5-fold cross-validation, with selection on F1.
- Precision, recall and F1 on the held-out test split are reported with a confusion matrix and per-class report, with the cost of false negatives discussed for a screening context.
- Permutation feature importance shows thal, ca and chest-pain type carrying the most signal, and a batch screening mode scores an intake queue of patient records at once, flagging those above the decision threshold.
- The 0.50 operating point is chosen on the validation split with its trade-offs documented.
Disadvantages
- Only 303 records from a single 1980s clinical cohort, so the report states the generalization limits plainly and does not claim population-wide validity.
- 86.9% accuracy is a design target for the training run, stated honestly; the report documents the actual achieved figure after training.
- A screening aid for academic demonstration only, not a medical device, not for clinical use, and it never replaces a cardiologist's judgement.
- Small-sample noise: with 61 test records, each misclassification moves accuracy by about 1.6 points, and the report discusses confidence accordingly.
- The demo runs representative coefficients offline, and the shipped model is fitted on the full dataset during the build.
Limitations & prerequisites
- Only 303 records from a single 1980s clinical cohort — the report states the generalization limits plainly and does not claim population-wide validity.
- 86.9% accuracy is a design target for the training run, stated honestly — the report documents the actual achieved figure after training.
- A screening aid for academic demonstration only — not a medical device, not for clinical use, and it never replaces a cardiologist's judgement.
- Small-sample noise: with 61 test records, each misclassification moves accuracy ~1.6 points; the report discusses confidence accordingly.
- The demo runs representative coefficients offline; the shipped model is fitted on the full dataset during the build.
Frequently Asked Questions
Which dataset is used and why?
The Cleveland Heart Disease dataset from UCI — 303 records, 14 clinical attributes. It is the canonical benchmark for this task, and its small size forces honest discussion of variance and generalization, which examiners like.
Why Random Forest over a neural network?
On 303 tabular records, tree ensembles beat deep learning reliably and need less tuning. The project compares four models empirically instead of assuming — a defensible engineering choice.
How does the demo explain a prediction?
Each attribute's contribution is computed relative to its dataset mean, so the demo shows exactly which factors pushed this patient's risk up or down.
Can this be used for real diagnosis?
No. It is an academic prototype on a small historic cohort, with an explicit educational-use-only limitation stated in the report and the demo.
What would improve it?
More records, modern cohorts, additional biomarkers, probability calibration and subgroup fairness checks — all listed as future scope.
Is this project suitable for a final-year project?
Yes — for Computer Science, IT and AI/ML programs. It covers data cleaning, model comparison, honest evaluation and an interactive deployment demo. Suitable for B.E./B.Tech final-year projects in Computer Science, IT and AI & Machine Learning.
Components & software requirements
- Python 3, scikit-learn, XGBoost
- pandas, NumPy, Matplotlib
- Jupyter Notebook (training & evaluation)
- HTML5, CSS, JavaScript (screening demo)
- UCI Cleveland Heart Disease dataset
Dataset & model details
- Dataset: Heart Disease (Cleveland) from the UCI Machine Learning Repository (Detroit/Hungarian/Swiss/Long Beach VA contributors; donor Robert Detrano) — 303 patient records, 14 clinical attributes (age, sex, chest-pain type, resting BP, cholesterol, fasting blood sugar, resting ECG, max heart rate, exercise angina, ST depression, ST slope, vessels coloured, thalassemia), binary target; 46% positive class.
- Task: Binary classification; input = 14 mixed numeric/categorical clinical attributes, output = probability of heart disease presence.
- Model: Random Forest classifier (shipped), ~300 trees (design target); compared against XGBoost, Logistic Regression and K-Nearest Neighbours.
- Metrics: Test accuracy 86.9%, precision 85.1%, recall 84.6%, F1 84.8% (design targets for the built-to-order training run). No accuracy is claimed as measured until the training run is executed for the order.
Delivery information
Built-to-order project. Delivery timeline is shared after order confirmation based on current queue.
Support terms
Complete documentation, setup guide, and viva preparation included. Support for setup and explanation provided.
Download free synopsis (PDF)
Enter your name and WhatsApp number — the synopsis PDF downloads immediately. We may send occasional project updates on WhatsApp; no spam.