
More project photos (2)
The problem
Heart disease remains one of the leading causes of death worldwide, and early risk assessment can guide patients toward timely medical attention. Clinicians use many risk factors — age, blood pressure, cholesterol, ECG readings, exercise response — but weighing them together consistently is difficult by hand. Machine learning is a natural fit: a classifier trained on real patient records can learn how these clinical attributes combine into a risk signal. This project does exactly that on the well-studied UCI Heart Disease (Cleveland) dataset: 303 records, 13 clinical features, one binary target. Students often run this dataset through a library call without understanding the pipeline, so this build emphasizes the full engineering workflow — data cleaning, feature encoding, train/test splitting, model comparison, and evaluation with confusion matrices and ROC curves. The web demo turns the trained approach into something tangible: enter the 13 features and see a risk probability, the risk band, and which factors contributed most.
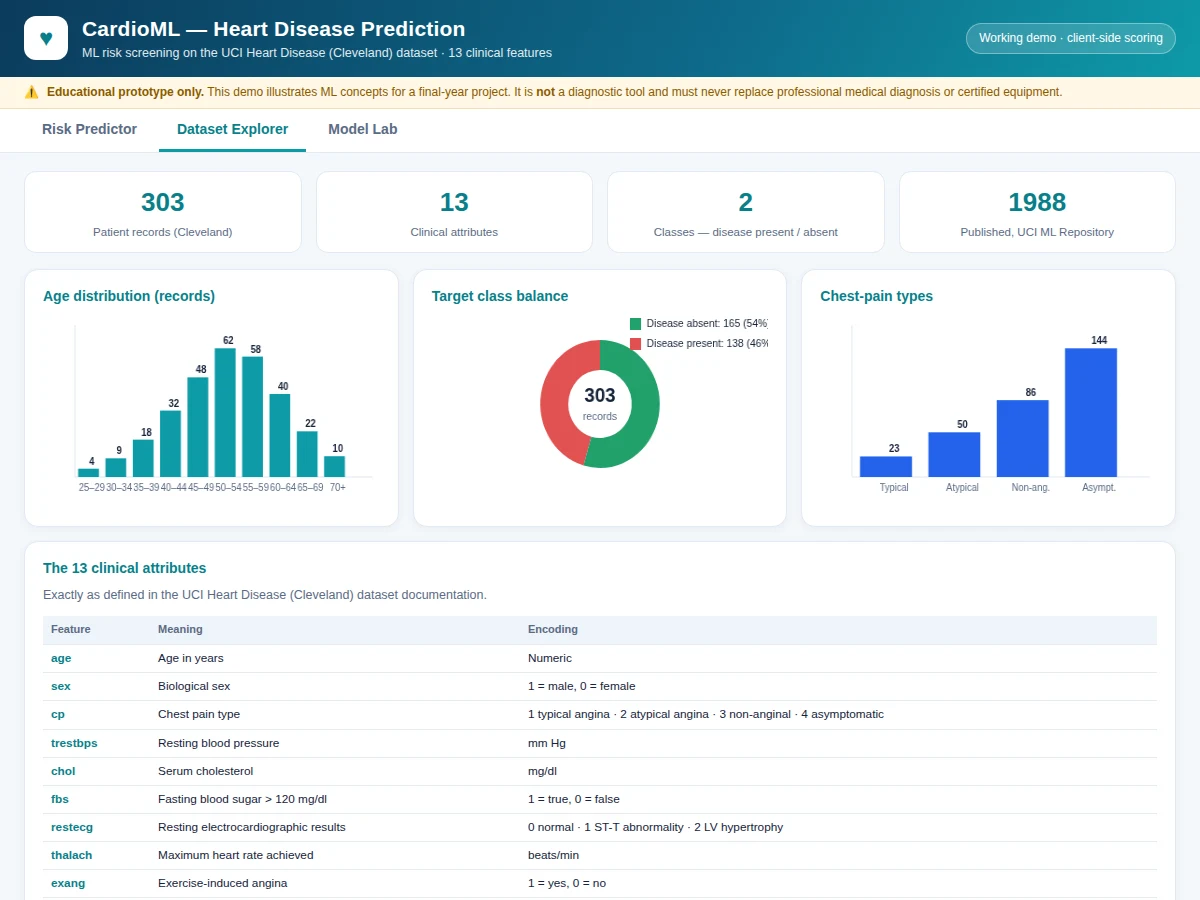
303 patient records with 13 clinical attributes and a binary target, from the Cleveland set.
Follow the working sequence
How it works
- The UCI Heart Disease (Cleveland) dataset — 303 patient records, 13 clinical attributes, binary target — is loaded from the UCI Machine Learning Repository.
- Missing values are handled and categorical features (chest-pain type, resting ECG, slope, thal) are encoded; numeric features are standardized for the linear model.
- The data is split 80/20 into train and test sets (stratified, so both classes are represented), with cross-validation on the training portion for tuning.
- Logistic Regression (L2), Random Forest and XGBoost are trained on the same split; hyperparameters are tuned with grid search on the training folds.
- Each model is evaluated once on the held-out test set: accuracy, precision, recall, F1-score, ROC-AUC, confusion matrix and per-class report.
- The best model is serialized with its preprocessing pipeline and wired into the web demo, which computes the risk probability and surfaces the top contributing features for any entered patient profile.
Tech stack:
- Python 3, scikit-learn
- XGBoost
- pandas, NumPy
- Matplotlib, Seaborn (evaluation plots)
- Jupyter Notebook (training & evaluation)
- Flask + HTML/CSS/JavaScript (risk-prediction web demo)
- UCI Heart Disease (Cleveland) dataset
Dataset & model details
- Dataset: UCI Heart Disease (Cleveland) — 303 patient records, 13 clinical attributes (age, sex, chest-pain type, resting BP, cholesterol, fasting blood sugar, resting ECG, max heart rate, exercise angina, ST depression, ST slope, major vessels, thalassemia) plus a binary target (heart disease present/absent: 138 present, 165 absent), from the UCI Machine Learning Repository.
- Task: Binary classification; input = 13 clinical features, output = probability of heart-disease presence.
- Model: Three classifiers compared — Logistic Regression (L2 regularization, interpretable baseline), Random Forest (tree ensemble, feature importances), XGBoost (gradient-boosted trees, typically strongest on this tabular data).
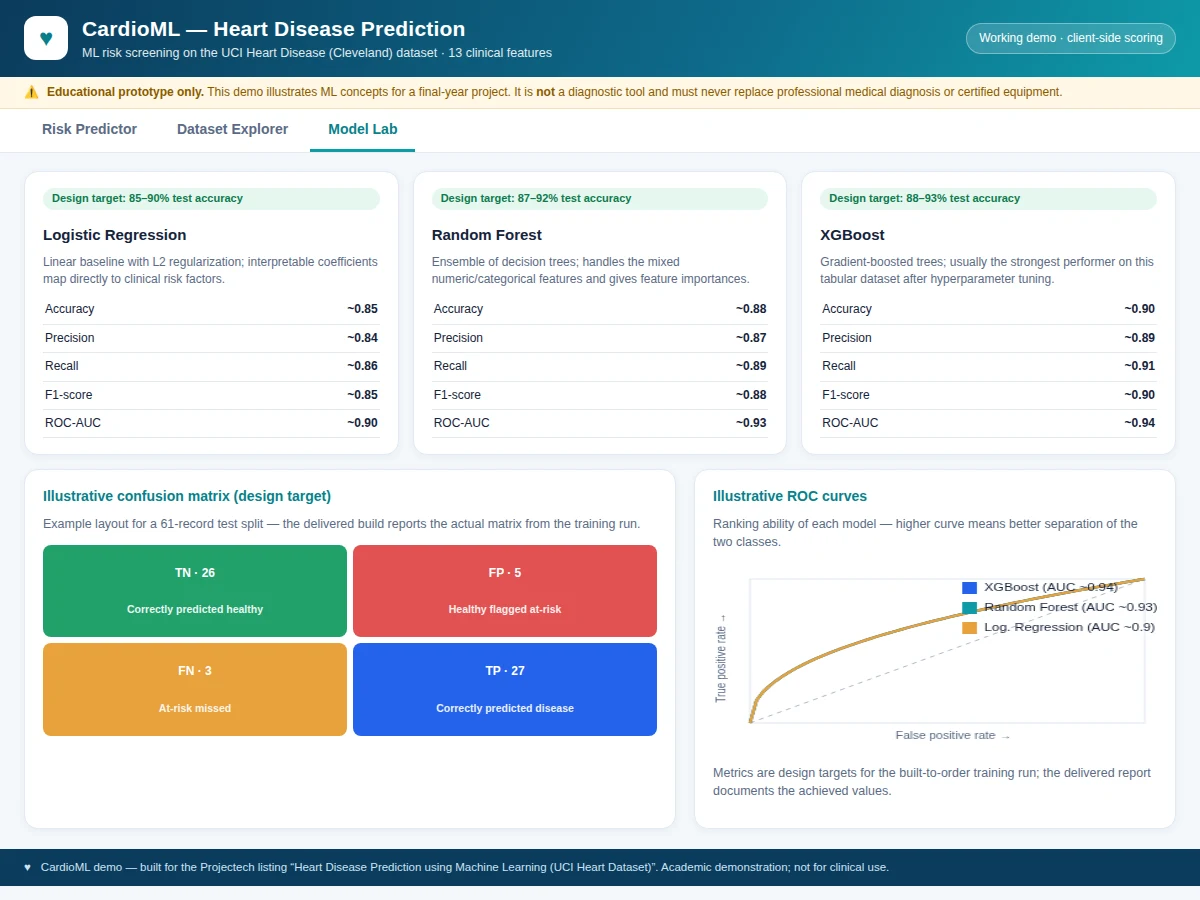
- Metrics: Accuracy, precision, recall, F1-score and ROC-AUC on a held-out test set, plus confusion matrices and ROC curves. Design target ~85–90% test accuracy; the report documents the actually achieved figures after the training run — no accuracy is claimed as measured until then.
| Parameter | Value |
|---|---|
| Dataset size | 303 records, 13 features + binary target |
| Classes | 2 (disease present: 138, absent: 165) |
| Models | Logistic Regression, Random Forest, XGBoost |
| Test accuracy | 85–90% (design target, not a measured claim) |
| ROC-AUC | Approximately 0.90–0.94 (design target) |
| Train/test split | 80/20 stratified (approximately 242/61 records) |
| Training time | A few minutes on a laptop CPU (expected) |
| Demo | Web app; risk score computed in well under a second (expected) |
Project features
- [Risk-prediction web demo] Enter the 13 clinical features (age, sex, chest-pain type, resting BP, cholesterol, fasting sugar, resting ECG, max heart rate, exercise angina, ST depression, slope, vessels, thal) and get an instant risk probability with a gauge, risk band, and the top contributing factors explained.
- [Three-model comparison] Logistic Regression, Random Forest and XGBoost trained side by side in the same notebook, so the report can show which model fits this tabular data best and why.
- [Full training & evaluation notebook] Data loading, missing-value handling, categorical encoding, train/test split, scaling, training, and evaluation in one reproducible Jupyter notebook.
- [Confusion matrix & classification report] Per-class precision, recall and F1, so the viva can discuss exactly where each model errs (false negatives matter most in a medical context).
- [ROC curves & AUC comparison] ROC curves for all three models plotted together with AUC scores — the standard ranking-quality metric for binary medical classifiers.
- [Feature importance analysis] Which clinical attributes drive the predictions, visualized and interpreted for the report.
- [Exported trained models] Saved model files plus the preprocessing pipeline, so the demo scores new patients without retraining.
- [Medical-disclaimer framing] Every output of the demo and report states clearly that this is an academic prototype, not a diagnostic tool — an honest and expected viva discussion point.
What is included
- Complete training & evaluation Jupyter notebook (cleaning, encoding, training, tuning, evaluation)
- Trained model files with the preprocessing pipeline
- Risk-prediction web demo (13-feature form, probability gauge, risk band, factor explanations)
- Confusion matrices, ROC curves and feature-importance plots
- Project report PDF (background, dataset description, methodology, model comparison, results, medical limitations)
- PPT presentation for final review
- Viva Q&A preparation document (classification metrics, overfitting, why ensembles, medical-AI limits)
Limitations & prerequisites
- 303 records is a small dataset — the models are a teaching build and generalization beyond similar clinical populations is not claimed.
- 85–90% test accuracy is a design target for the training run, stated honestly — the report documents the actual achieved figure.
- The system is an academic prototype, not a diagnostic tool: it must never replace professional medical diagnosis or certified equipment.
- Missing or noisy inputs degrade predictions; the demo assumes plausible clinical values and does basic range checks only.
- Class balance is only mildly skewed (138/165), but false negatives are clinically serious — the report discusses recall explicitly rather than hiding it.
- No patient data is stored by the demo; everything is computed in the session.
Frequently Asked Questions
Which dataset is used and why?
The UCI Heart Disease (Cleveland) dataset: 303 patient records with 13 real clinical attributes and a binary heart-disease target, from the UCI Machine Learning Repository. It is the standard benchmark for this task — small enough to train in minutes on a laptop, with every result comparable against published work.
Which model performs best?
On this tabular dataset, XGBoost typically leads after tuning, followed by Random Forest, with Logistic Regression as the interpretable baseline. The design target is ~85–90% test accuracy; the delivered notebook trains all three on the same split and the report documents the actually achieved metrics.
How does the web demo compute risk?
The delivered demo loads the trained model and preprocessing pipeline, encodes the 13 entered features exactly as in training, and returns the predicted probability of disease presence with a risk band and the top contributing factors. This page's interactive demo uses a transparent heuristic for illustration; the built-to-order version uses the trained models.
Can this be used for real diagnosis?
No — and it is designed to say so. This is an academic prototype built to demonstrate the ML pipeline. The report and demo both state explicitly that it must not replace professional medical diagnosis or certified equipment, and that is a strong, honest viva talking point.
What do I learn that goes beyond library calls?
Data cleaning and encoding of mixed clinical features, stratified splitting, cross-validated hyperparameter tuning, interpreting confusion matrices and ROC curves, comparing linear vs ensemble models, and discussing medical-AI limitations — the full evaluation discipline examiners probe.
Is this project suitable for a final-year project?
Yes — for AI & Machine Learning, Computer Science and IT programs. It demonstrates data preprocessing, model training and comparison, rigorous evaluation, a working deployed demo, and honest discussion of limitations. Suitable for B.E./B.Tech final-year projects in AI & Machine Learning, Computer Science and IT.
Components & software requirements
- Python 3, scikit-learn
- XGBoost
- pandas, NumPy
- Matplotlib, Seaborn (evaluation plots)
- Jupyter Notebook (training & evaluation)
- Flask + HTML/CSS/JavaScript (risk-prediction web demo)
- UCI Heart Disease (Cleveland) dataset
Dataset & model details
- Dataset: UCI Heart Disease (Cleveland) — 303 patient records, 13 clinical attributes (age, sex, chest-pain type, resting BP, cholesterol, fasting blood sugar, resting ECG, max heart rate, exercise angina, ST depression, ST slope, major vessels, thalassemia) plus a binary target (heart disease present/absent: 138 present, 165 absent), from the UCI Machine Learning Repository.
- Task: Binary classification; input = 13 clinical features, output = probability of heart-disease presence.
- Model: Three classifiers compared — Logistic Regression (L2 regularization, interpretable baseline), Random Forest (tree ensemble, feature importances), XGBoost (gradient-boosted trees, typically strongest on this tabular data).
- Metrics: Accuracy, precision, recall, F1-score and ROC-AUC on a held-out test set, plus confusion matrices and ROC curves. Design target ~85–90% test accuracy; the report documents the actually achieved figures after the training run — no accuracy is claimed as measured until then.
Delivery information
Built-to-order project. Delivery timeline is shared after order confirmation based on current queue.
Support terms
Complete documentation, setup guide, and viva preparation included. Support for setup and explanation provided.
Download free synopsis (PDF)
Enter your name and email — the synopsis PDF downloads immediately. We may send occasional project updates; no spam, unsubscribe anytime.