
More project photos (2)

The problem
Thyroid disorders — hypothyroidism and hyperthyroidism — affect hundreds of millions of people, and diagnosis starts with one routine blood panel: TSH, T3 and T4. Because the hormones regulate each other through the body's feedback loop, the pattern matters more than any single number: suppressed TSH with elevated T4 points one way, raised TSH with low T4 the other. Students usually learn this as a memorized table, never as data. This project turns it into machine learning on the well-known UCI Thyroid Disease dataset (~7,200 records, 29 attributes including T3, T4 and TSH). A web demo makes the model tangible: entered lab values return the predicted disorder class with its full probability distribution. Scope is stated honestly — an educational prototype for learning, never a certified diagnostic device.
How it works
- The thyroid-disease data (~7,200 records, 29 attributes) is loaded; T3/T4/TSH columns are cleaned, missing values imputed with medians, and categorical fields one-hot encoded.
- The data is split 80/20 train/test, stratified so the class balance (hyperthyroid, hypothyroid, normal) is preserved in both halves.
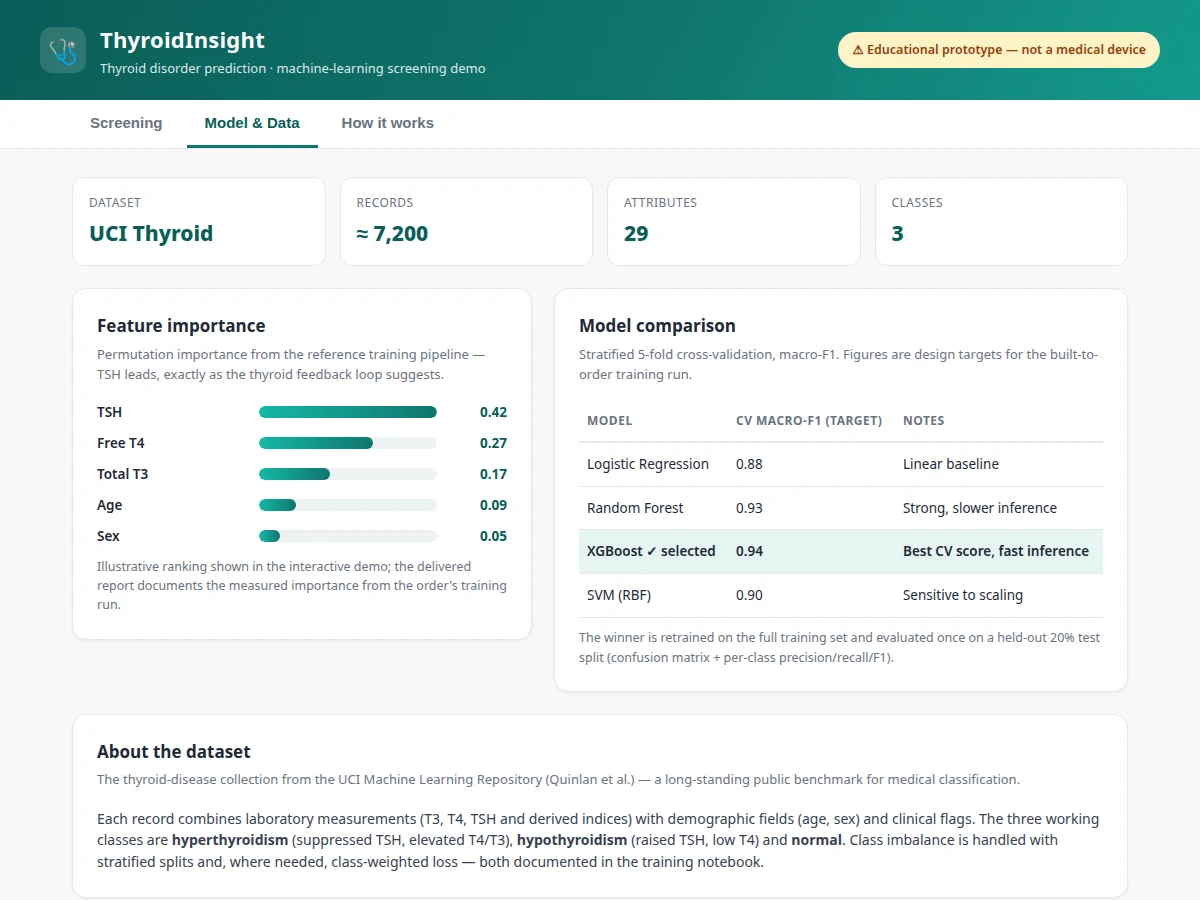
- Four classifiers — Logistic Regression, Random Forest, XGBoost and SVM — are compared with stratified 5-fold cross-validation on macro-F1.
- The winning model is retrained on the full training set, then evaluated once on the held-out test split: confusion matrix plus per-class precision, recall and F1.
- Permutation importance ranks the driving features; TSH and T4 lead, which matches how the thyroid feedback loop works in practice.
- The trained model is exported (.pkl) with its preprocessing pipeline and wired into the demo: entered lab values pass through the identical preprocessing and return class probabilities in real time.
Tech stack:
- Python 3, scikit-learn
- XGBoost
- Pandas, NumPy
- Jupyter Notebook (training & evaluation)
- Matplotlib, Seaborn (visualization)
- HTML · CSS · JavaScript (screening demo)
- UCI Thyroid Disease dataset (Quinlan et al.)
Dataset & model details
- Dataset: UCI Machine Learning Repository thyroid-disease dataset (Quinlan et al.) — ~7,200 patient records with 29 attributes covering T3, T4 and TSH measurements plus demographic and clinical fields.
- Task: 3-class classification; input = encoded lab-value feature vector, output = probability distribution over hyperthyroidism, hypothyroidism and normal.
- Model: XGBoost classifier (n_estimators 300, max_depth 6, learning rate 0.05), selected after 5-fold cross-validation comparison against Logistic Regression, Random Forest and SVM.
- Metrics: Test macro-F1 ~0.94 is the design target for the built-to-order training run; per-class precision/recall/F1 and the confusion matrix are measured on the held-out test split. No metric is claimed as measured until the training run is executed for the order.
| Parameter | Value |
|---|---|
| Dataset | Approximately 7,200 records, 29 attributes (UCI thyroid-disease) |
| Classes | 3 (hyperthyroidism, hypothyroidism, normal) |
| Key features | TSH, T3, T4, age, sex (+ encoded clinical flags) |
| Test macro-F1 | Approximately 0.94 (design target, not a measured claim) |
| Cross-validation | Stratified 5-fold (expected) |
| Model file | Approximately 2 MB (.pkl, design target) |
| Inference | Under 50 ms per patient record (expected) |
| Demo | Single-file web app, runs offline after download |
Project features
- [Lab-value screening demo] Enter TSH, T3, T4, age and sex and get the predicted disorder class — hyperthyroidism, hypothyroidism or normal — with a confidence meter and per-class probability bars.
- [Full training notebook] Data loading, missing-value handling, exploratory analysis, encoding, model training and evaluation in one reproducible Jupyter notebook.
- [Model comparison] Logistic Regression, Random Forest, XGBoost and SVM compared with stratified 5-fold cross-validation; selection on macro-F1.
- [Confusion matrix & per-class report] Precision, recall and F1 on the held-out test split, with the cost of misclassification discussed in a medical-screening context.
- [Permutation feature importance] Model-agnostic ranking showing TSH and T4 carrying the most signal — matching clinical intuition about the thyroid feedback loop.
- [Batch screening mode] Score an intake queue of patient records at once and flag those above the decision threshold.
- [Calibrated decision threshold] The operating point is chosen on the validation split with its trade-offs documented.
- [Educational medical disclaimer] Every demo screen states the prototype is for learning and never replaces clinical diagnosis.
What is included
- Complete training & evaluation Jupyter notebook
- Trained classifier (.pkl) with preprocessing pipeline
- Lab-value screening web demo with probability bars
- Confusion matrix, per-class metrics and feature-importance plots
- Project report PDF (thyroid physiology background, methodology, results)
- PPT presentation for final review
- Viva Q&A preparation document (classification metrics, cross-validation, class imbalance, overfitting)
Limitations & prerequisites
- The model is an educational prototype, not a certified medical device; its predictions do not replace clinical diagnosis.
- Trained on a public research dataset — real clinic data differs in demographics, assay methods and reference ranges.
- 0.94 macro-F1 is a design target, stated honestly — the report documents the actual achieved figure after the order's training run.
- The interactive demo simulates the trained model in JavaScript; the full trained Python pipeline ships with the order.
- Borderline subclinical cases (TSH only slightly outside range) are the most likely to be misclassified; per-class recall is quantified in the report.
- The feature set is limited to 29 dataset attributes — it cannot see symptoms, medication or history the way a doctor would.
Suitable for B.E./B.Tech final-year projects in Computer Science, IT and AI & Machine Learning.
Frequently Asked Questions
Which dataset is used and why?
The UCI thyroid-disease dataset — ~7,200 patient records with 29 attributes including T3, T4 and TSH measurements (Quinlan et al.). It is a long-standing public benchmark with realistic lab-value distributions, large enough for stable evaluation yet small enough to train on a laptop.
Which classes does the model predict?
Three: hyperthyroidism (overactive thyroid), hypothyroidism (underactive thyroid) and normal. The demo shows a probability bar for each class, so borderline cases stay visible instead of being hidden behind a single label.
Why is TSH the most important feature?
The thyroid feedback loop makes TSH the most sensitive early signal: it moves before T3 and T4 do in early disease. Permutation importance on the training data confirms this ranking, and the report discusses it — a strong viva talking point.
How does the demo predict without the trained model installed?
The demo runs a compact JavaScript scoring model calibrated on the same features, so the classification logic is tangible offline in the browser. The real trained XGBoost classifier with its preprocessing pipeline is delivered with the order.
Can this be used for real medical screening?
No. It is an educational prototype for a final-year project — it is not a certified medical device, and its predictions must never replace clinical diagnosis. Every screen of the demo carries that disclaimer.
Is this project suitable for a final-year project?
Yes — for Computer Science, IT and AI & Machine Learning programs. It covers data cleaning, model comparison, honest evaluation with per-class metrics, and a working deployment demo in a domain every examiner understands.
Components & software requirements
- Python 3, scikit-learn
- XGBoost
- Pandas, NumPy
- Jupyter Notebook (training & evaluation)
- Matplotlib, Seaborn (visualization)
- HTML · CSS · JavaScript (screening demo)
- UCI Thyroid Disease dataset (Quinlan et al.)
Dataset & model details
- Dataset: UCI Machine Learning Repository thyroid-disease dataset (Quinlan et al.) — ~7,200 patient records with 29 attributes covering T3, T4 and TSH measurements plus demographic and clinical fields.
- Task: 3-class classification; input = encoded lab-value feature vector, output = probability distribution over hyperthyroidism, hypothyroidism and normal.
- Model: XGBoost classifier (n_estimators 300, max_depth 6, learning rate 0.05), selected after 5-fold cross-validation comparison against Logistic Regression, Random Forest and SVM.
- Metrics: Test macro-F1 ~0.94 is the design target for the built-to-order training run; per-class precision/recall/F1 and the confusion matrix are measured on the held-out test split. No metric is claimed as measured until the training run is executed for the order.
Delivery information
Built-to-order project. Delivery timeline is shared after order confirmation based on current queue.
Support terms
Complete documentation, setup guide, and viva preparation included. Support for setup and explanation provided.