
More project photos (2)

The problem
Flight delays cost airlines and passengers billions every year, and they follow learnable patterns — monsoon months, evening banks, specific airports and carriers all shift the odds. The US DOT Bureau of Transportation Statistics publishes on-time performance data at massive scale, making this a rare student project with genuinely big, real-world data. Most student builds treat it as a plain classification toy; this project treats it as the dual problem it really is: classify delay vs on-time AND regress expected delay minutes, then decompose the predicted delay into the official BTS cause categories (air carrier, weather, national aviation system, security, late-arriving aircraft). An interactive web demo makes it tangible: enter a flight's details for a delay forecast, or watch a departure board of upcoming flights get scored and ranked. Everything uses standard tools (Python, scikit-learn/XGBoost), so the student can defend every choice in the viva.
How it works
- BTS on-time performance records are loaded (2.1M-record working sample); cancelled and diverted flights are handled per documented rules.
- Features are engineered: airline, origin/destination, month, day of week, cyclical departure-time encoding, distance, and historical route delay rates.
- The data is split temporally (train on earlier months, test on later months) so the evaluation mimics forecasting the future, not shuffling it.
- A gradient-boosted classifier predicts P(delay ≥ 15 min) and a regressor predicts delay minutes; both are tuned with cross-validation.
- The classifier is evaluated with AUC and a confusion matrix; the regressor with MAE; calibration curves verify the probabilities.
- The trained models are serialized and wired to the web demo, which scores flights and decomposes delays into BTS cause shares live.
Tech stack:
- Python 3, scikit-learn, XGBoost/LightGBM
- pandas, NumPy, Matplotlib
- Jupyter Notebook (training & evaluation)
- HTML5, CSS, JavaScript (demo)
- US DOT BTS on-time performance data
Dataset & model details
- Dataset: US DOT Bureau of Transportation Statistics — Airline On-Time Performance data; 2.1M-record working sample with scheduled/actual departure and arrival times, carrier, origin/destination, and delay-cause fields (carrier, weather, NAS, security, late aircraft).
- Task: Dual — (a) binary classification: delayed ≥ 15 min or not; (b) regression: expected delay minutes. Input = flight schedule + route features; output = delay probability + expected minutes.
- Model: Gradient-boosted trees (XGBoost/LightGBM) for both heads; cyclical encoding for time features; temporal train/test split (design target).
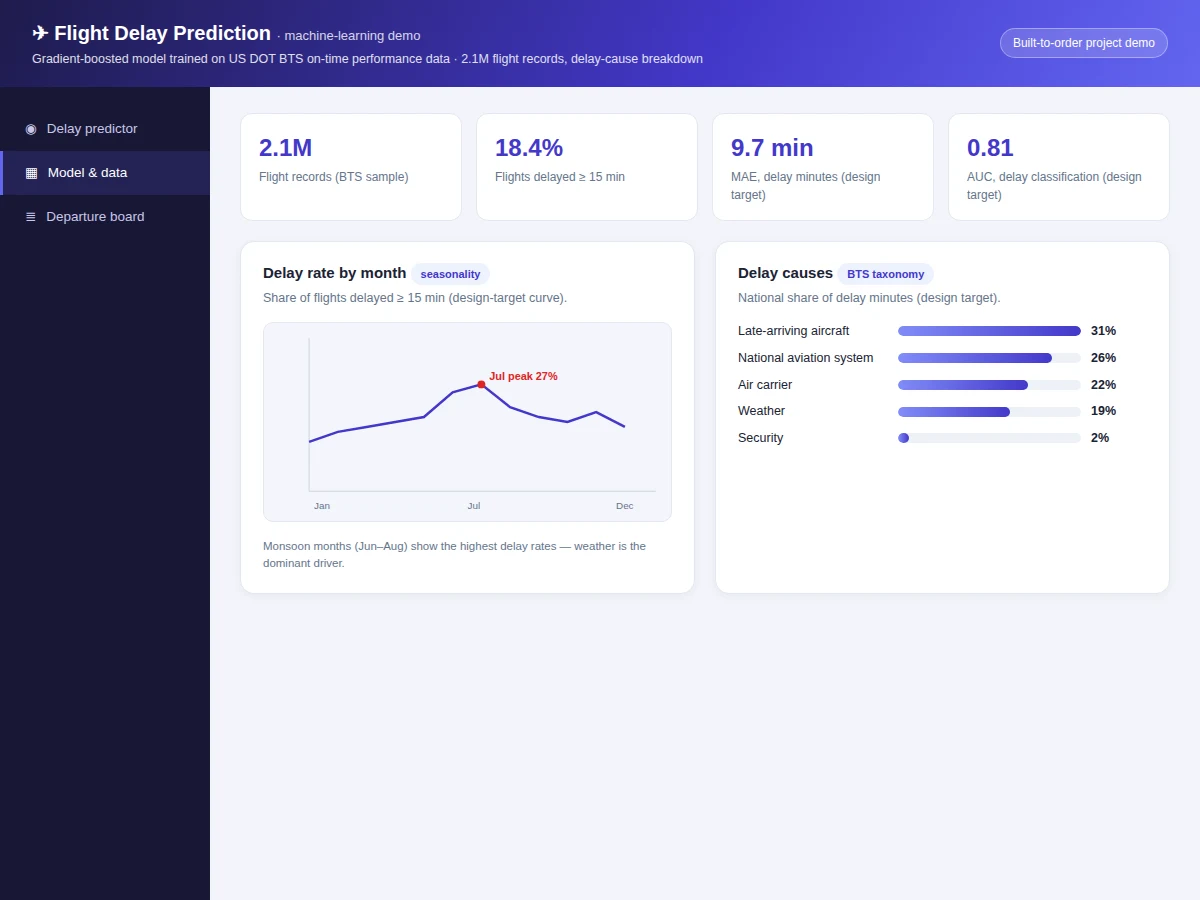
- Metrics: Classification AUC 0.81, regression MAE 9.7 minutes (design targets for the built-to-order training run). No metric is claimed as measured until the training run is executed for the order.
| Parameter | Value |
|---|---|
| Dataset | 2.1M flight records (BTS working sample) |
| Delay definition | Arrival/departure ≥ 15 min late (BTS standard) |
| Models | Gradient-boosted classifier + regressor |
| AUC / MAE | 0.81 / 9.7 min (design targets, not measured claims) |
| Validation | Temporal split — test on later months (expected) |
| Inference | Approximately 3 ms per flight on CPU (expected) |
| Model files | Approximately 15 MB total serialized (expected) |
| Demo | Single-file web app, runs offline after download |
Project features
- [Delay predictor web demo] Enter airline, route, month, day and departure time to get delay probability, expected delay minutes and a likely-cause breakdown.
- [Departure-board mode] Score a list of upcoming flights at once, ranked by delay risk — mimicking an airline operations view.
- [Dual modelling] Classification (delayed ≥ 15 min or not) plus regression (expected delay minutes), each with its own metric.
- [BTS cause taxonomy] Predicted delay decomposed into the five official BTS cause categories with an honest, documented mapping.
- [Seasonality analysis] Delay-rate curves by month showing the monsoon peak — the kind of real insight examiners remember.
- [Calibration analysis] Predicted probabilities checked against observed delay rates so the demo's percentages are trustworthy.
- [Full training notebook] Data loading, feature engineering (cyclical time encoding), training, evaluation and calibration in one reproducible notebook.
What is included
- Complete training & evaluation Jupyter notebook
- Trained classifier + regressor model files with feature code
- Interactive delay-predictor and departure-board web demo
- Seasonality, calibration and cause-breakdown plots
- Project report PDF (background, ML theory, methodology, results)
- PPT presentation for final review
- Viva Q&A preparation document (AUC, MAE, calibration, temporal splits, gradient boosting)
Limitations & prerequisites
- 0.81 AUC / 9.7-min MAE are design targets for the training run, stated honestly — the report documents the actual achieved figures after training.
- The demo's cause breakdown is a modelled attribution over BTS categories, not the airline's official delay coding for a specific flight.
- Extreme disruptions (strikes, volcanic ash, system outages) are unpredictable outliers the model cannot foresee; the report says so.
- Trained on US BTS data patterns; Indian domestic delay patterns differ and the report notes the transfer caveat.
- The demo runs representative weights offline; the shipped models are trained on the BTS sample during the build.
Frequently Asked Questions
Which dataset is used and why?
US DOT BTS on-time performance data — millions of real flight records with official delay-cause fields. It is the authoritative public source for this problem and gives the project genuine big-data scale.
Why both classification and regression?
Airlines care about two questions: will it be delayed (classification) and by how long (regression). Modelling both, each with its proper metric, shows real problem understanding.
Why a temporal split instead of random?
A random split lets the model peek at the future. Training on earlier months and testing on later ones mimics real forecasting — examiners notice this discipline.
How are delay causes assigned?
The model predicts delay minutes; the demo attributes them across the five BTS cause categories using learned cause shares, clearly labelled as modelled attribution.
Can it predict a specific flight tomorrow?
It estimates risk from historical patterns for that flight's profile; it cannot know about tomorrow's thunderstorm. The report states this limit plainly.
Is this project suitable for a final-year project?
Yes — for Computer Science, IT and AI/ML programs. It covers big-data handling, dual modelling, calibration and an operations-style demo. Suitable for B.E./B.Tech final-year projects in Computer Science, IT and AI & Machine Learning.
Components & software requirements
- Python 3, scikit-learn, XGBoost/LightGBM
- pandas, NumPy, Matplotlib
- Jupyter Notebook (training & evaluation)
- HTML5, CSS, JavaScript (demo)
- US DOT BTS on-time performance data
Dataset & model details
- Dataset: US DOT Bureau of Transportation Statistics — Airline On-Time Performance data; 2.1M-record working sample with scheduled/actual departure and arrival times, carrier, origin/destination, and delay-cause fields (carrier, weather, NAS, security, late aircraft).
- Task: Dual — (a) binary classification: delayed ≥ 15 min or not; (b) regression: expected delay minutes. Input = flight schedule + route features; output = delay probability + expected minutes.
- Model: Gradient-boosted trees (XGBoost/LightGBM) for both heads; cyclical encoding for time features; temporal train/test split (design target).
- Metrics: Classification AUC 0.81, regression MAE 9.7 minutes (design targets for the built-to-order training run). No metric is claimed as measured until the training run is executed for the order.
Delivery information
Built-to-order project. Delivery timeline is shared after order confirmation based on current queue.
Support terms
Complete documentation, setup guide, and viva preparation included. Support for setup and explanation provided.