
More project photos (3)
The problem
Every campus runs on forms — workshop feedback, event registrations, project reviews — yet most students either hand-code each form or wrestle with generic survey tools they cannot customize or self-host. The interesting engineering is in the middle: a schema-driven builder where the form is data (not code), a renderer that turns that schema into a live respondent page, and an analytics layer that aggregates answers into charts without a separate BI tool. This project builds that whole loop: a drag-and-drop builder with twelve field types, conditional show/hide logic, a public response page with honeypot and rate-limit spam protection, and a dashboard with per-day response charts, choice distributions and CSV export.
Builds forms and reads analytics.
Follow the working sequence
How it works
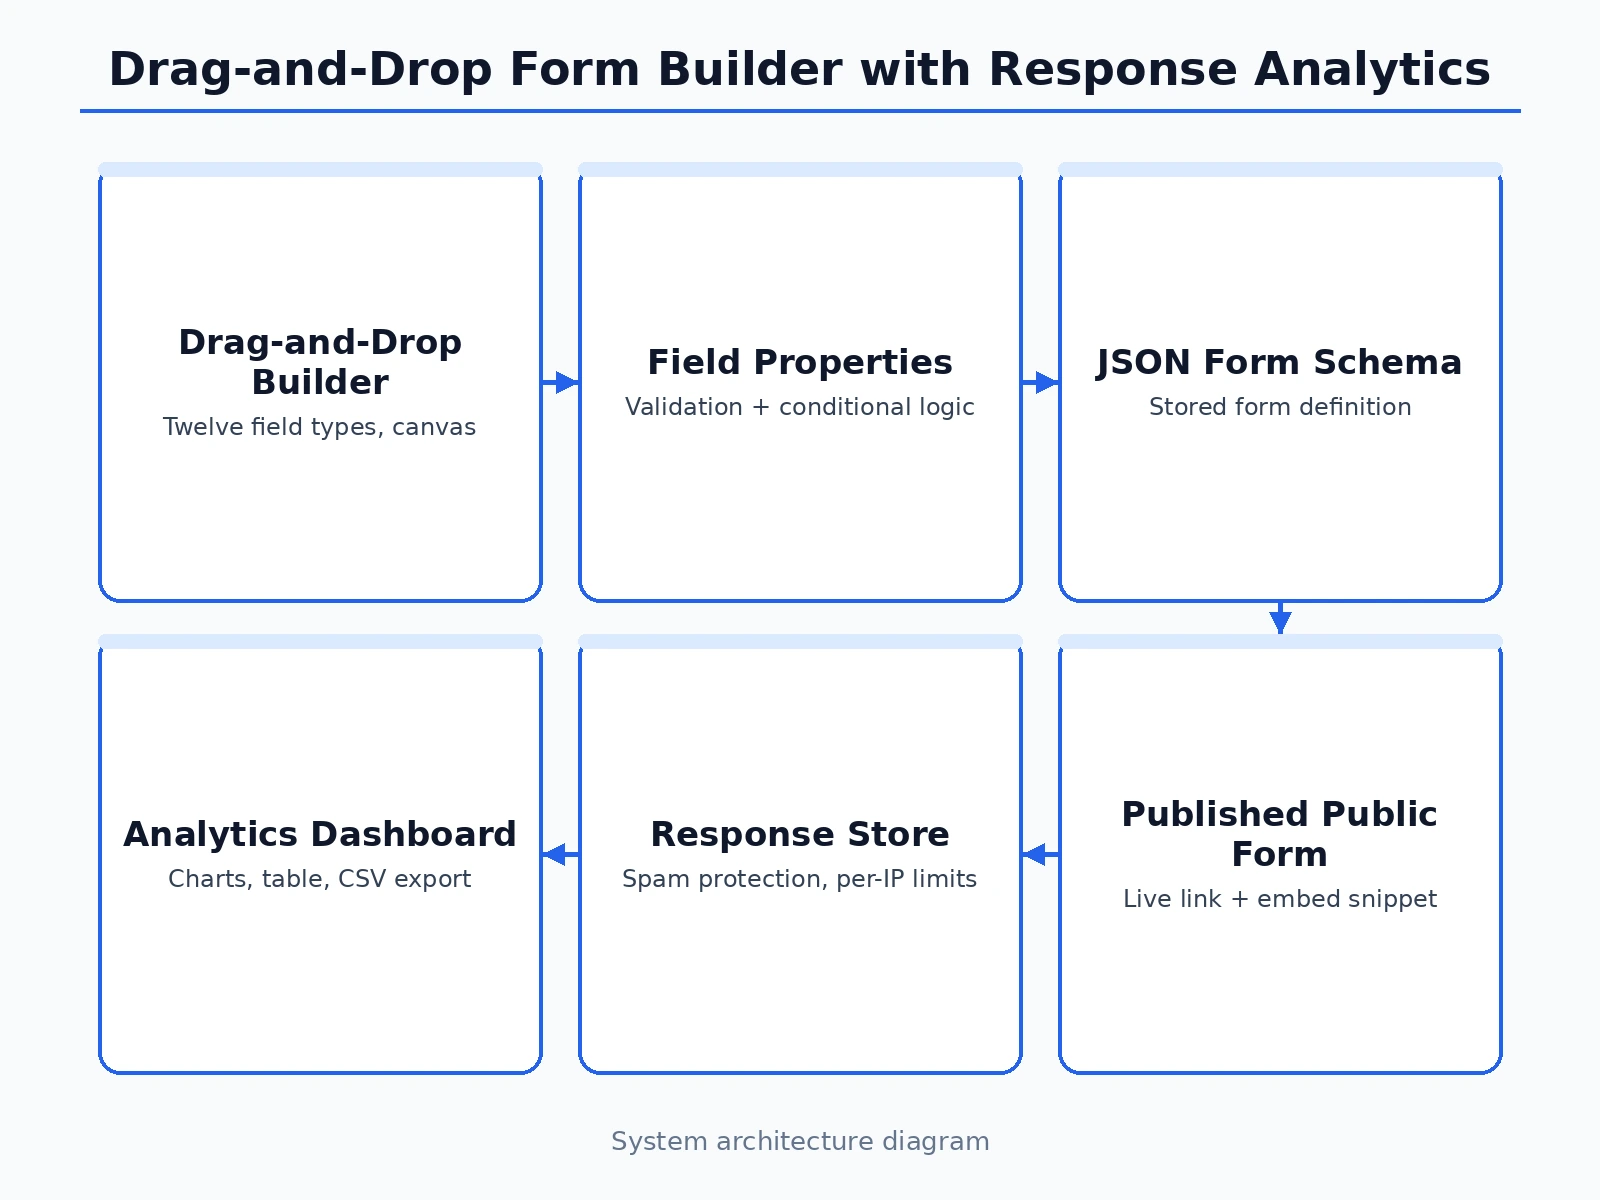
- In the builder, dragging a field from the palette appends a field definition (type, label, validation, conditions) to the form's JSON schema.
- The properties panel edits the selected field's definition; conditional-logic rules reference other fields' answers by key.
- Publishing flips the form's status and generates its public URL; the schema is served read-only to respondents.
- The renderer walks the schema and builds the respondent page, evaluating conditional rules client-side as answers change.
- On submit, the server validates every field against the schema (types, required, formats), checks the honeypot and rate limit, then stores the response row.
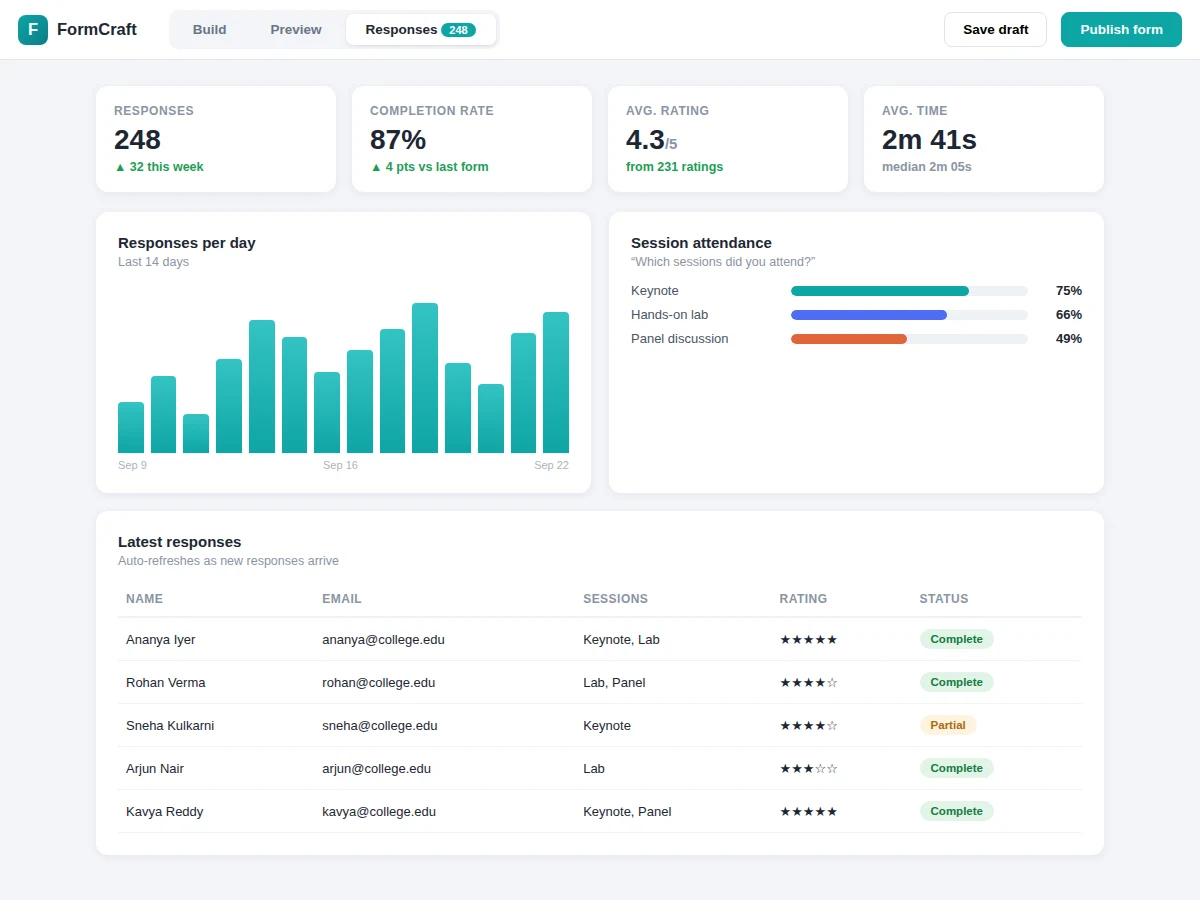
- The analytics dashboard aggregates responses with SQL group-bys — counts per day, choice distributions, rating averages — and renders them as charts.
- Owners export the raw response set to CSV or share a read-only analytics link with coordinators.
Tech stack:
- Node.js + Express (API server)
- PostgreSQL (forms, schemas, responses)
- Vanilla JS builder (drag-and-drop canvas)
- SVG charts (dashboard rendering)
- JWT (owner auth)
- Nodemailer (response notifications)
- Docker + docker-compose
| Parameter | Value |
|---|---|
| Field types | 12 (design target) |
| Fields per form | Approximately 100 (expected) |
| Responses per form | Approximately 50,000 rows before archival is advised (expected) |
| Public page load | Approximately under 1.5 s on broadband (design target) |
| Analytics refresh | Live aggregation per dashboard load (design target) |
| Spam controls | Honeypot + per-IP rate limit (design target) |
| Export | CSV, UTF-8 with BOM (design target) |
| Deployment | Docker compose: app + PostgreSQL (design target) |
Project features
- [Drag-and-drop builder] Twelve field types — text, email, number, dropdown, radio, checkboxes, rating, date, file upload, signature and more — arranged on a visual canvas.
- [Field properties panel] Per-field label, placeholder, validation rules, required flags and conditional logic ("show if rating ≤ 3").
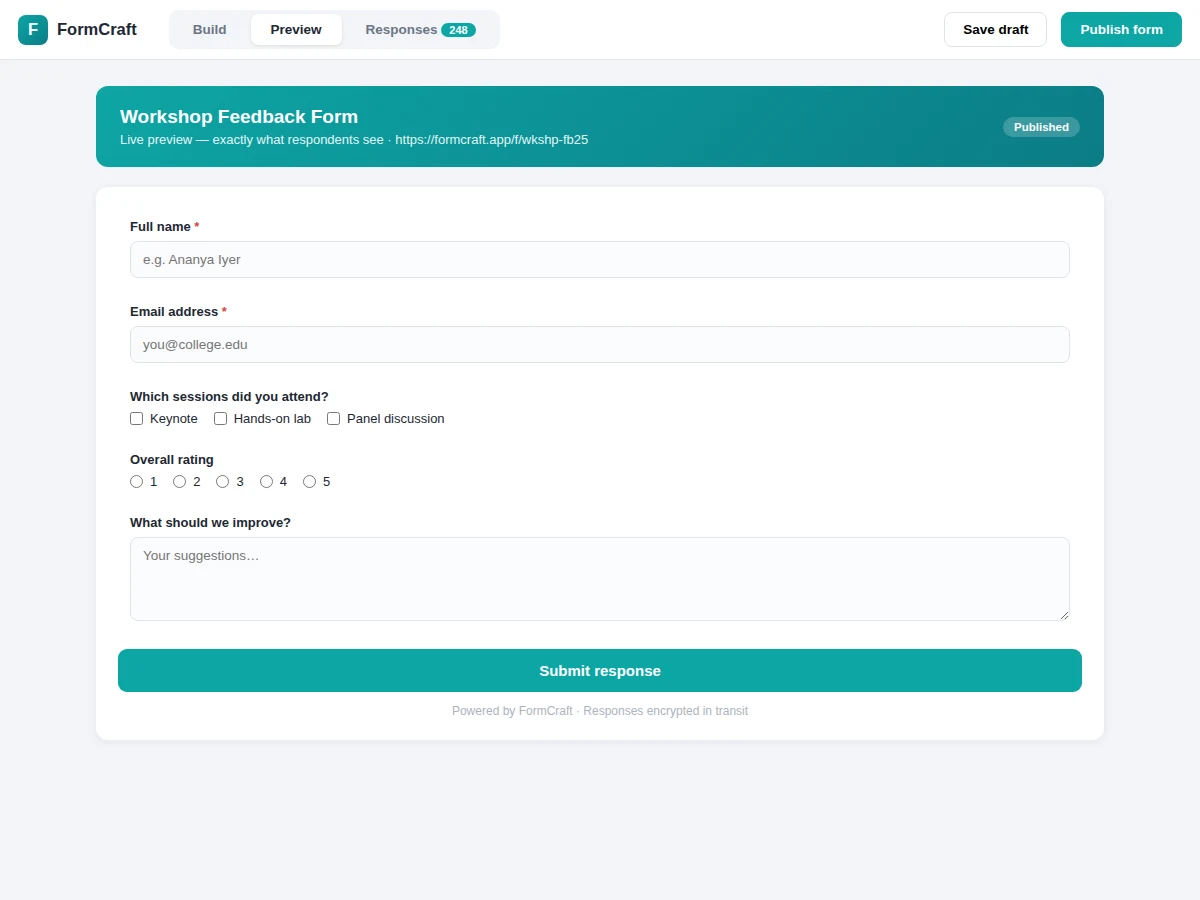
- [Live preview] One click renders the exact respondent-facing form, so what the builder shows is what respondents get.
- [Publish and share] Forms publish to a clean public URL with an embed snippet for college websites and LMS pages.
- [Response analytics] Per-day response bar charts, choice-distribution bars, average ratings and completion-rate stats computed live from the response store.
- [Response table] Searchable, paginated table of every submission with per-field answers and completion status.
- [CSV export] One-click export of all responses for analysis in spreadsheets.
- [Spam protection] Honeypot fields plus per-IP rate limiting keep bot submissions out of the analytics.
What is included
- Form builder frontend (palette, canvas, properties panel, preview)
- Public respondent renderer with validation and conditional logic
- Analytics dashboard with charts, response table and CSV export
- Backend API with schema validation, spam protection and auth
- PostgreSQL schema, migrations and seed data
- Project report PDF (schema design, validation strategy, analytics queries, methodology, results)
- PPT presentation for final review
- Viva Q&A preparation document (schema-driven UI, validation trust boundaries, aggregation)
Limitations & prerequisites
- File-upload fields store files on local disk in the demo deployment; production use needs object storage, documented as a configuration step.
- Conditional logic supports show/hide rules only — no computed fields or cross-form lookups.
- Analytics charts aggregate on dashboard load; beyond roughly 50,000 responses per form, archival or pre-aggregation is advised.
- The builder targets desktop browsers; building complex forms on a phone is not a supported flow.
- Email notifications need an SMTP server configured by the deployer; the demo logs them instead.
- Multi-page forms with page branching are future scope — the builder ships single-page forms with conditional sections.
Frequently Asked Questions
How does the builder actually work?
The form is stored as a JSON schema — an ordered list of field definitions. Dragging, configuring or reordering fields edits that schema; the respondent page is a separate renderer that turns the same schema into HTML, so builder and live form can never drift apart.
Where is validation done?
Both places, for different reasons: client-side for instant feedback, and server-side as the real gate — the API re-validates every field against the schema because client checks can be bypassed.
How are the analytics computed?
With SQL aggregation queries over the response rows (counts grouped by day, choice-value distributions, rating averages). The report documents the queries so the viva discussion can go into indexing and performance.
Can forms be embedded in a college website?
Yes — publishing generates an iframe embed snippet alongside the public link, styled to inherit the host page's width.
How do you stop spam submissions?
Each form carries a honeypot field invisible to humans plus a per-IP submission rate limit; both are checked before a response is stored.
Is this project suitable for a final-year project?
Yes — for Computer Science, IT and Web Development programs. It demonstrates schema-driven UI design, full-stack engineering, data validation discipline and applied analytics. Suitable for B.E./B.Tech final-year projects in Computer Science, IT and Web Development.
Components & software requirements
- Node.js + Express (API server)
- PostgreSQL (forms, schemas, responses)
- Vanilla JS builder (drag-and-drop canvas)
- SVG charts (dashboard rendering)
- JWT (owner auth)
- Nodemailer (response notifications)
- Docker + docker-compose
Delivery information
Built-to-order project. Delivery timeline is shared after order confirmation based on current queue.
Support terms
Complete documentation, setup guide, and viva preparation included. Support for setup and explanation provided.
Download free synopsis (PDF)
Enter your name and WhatsApp number — the synopsis PDF downloads immediately. We may send occasional project updates on WhatsApp; no spam.