
More project photos (2)
The problem
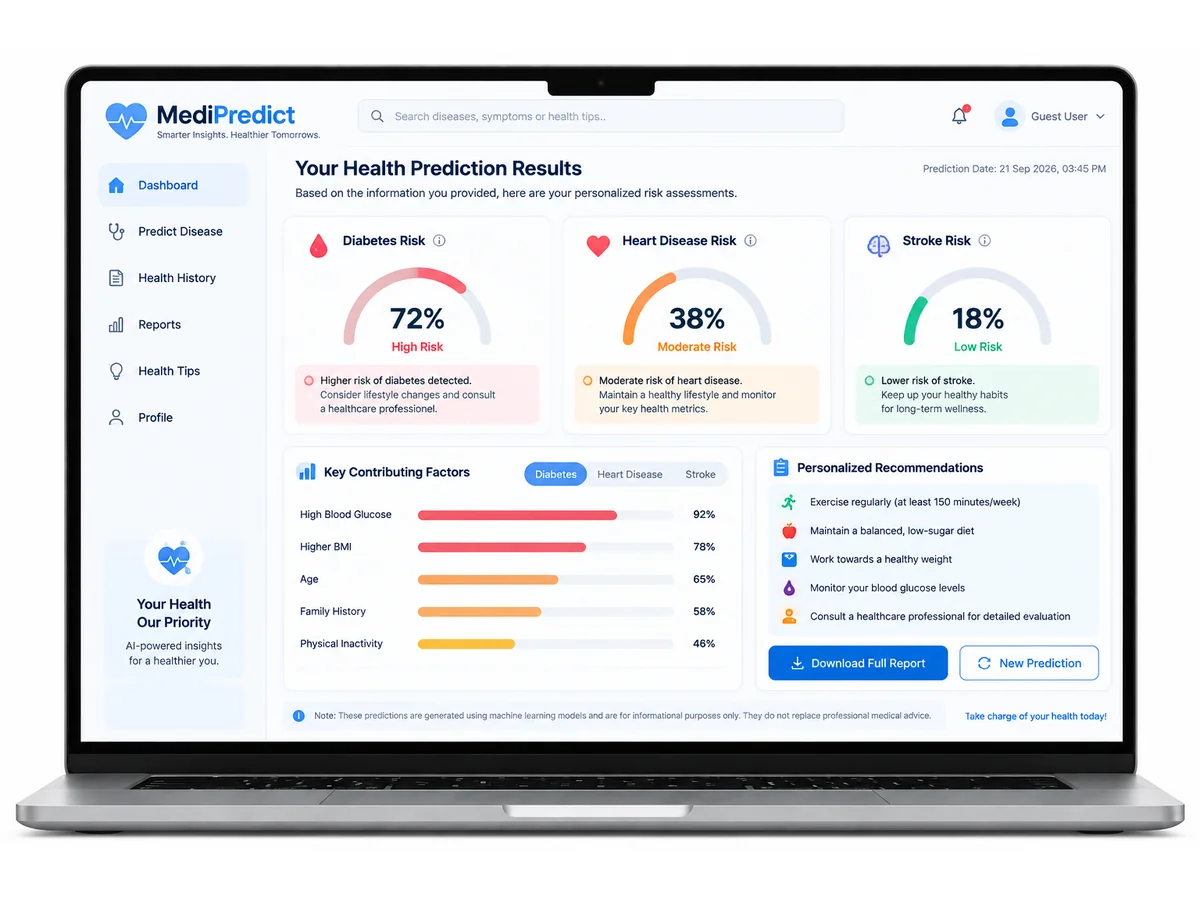
Disease Prediction System using Machine Learning — MediPredict is a complete ML-based healthcare prediction project that estimates the risk of diabetes, heart disease and stroke from clinical input features. It trains and compares multiple classifiers with cross-validation, explains every prediction with feature importance and SHAP values, and packages everything in the MediPredict symptom-checker web app that patients and examiners can try live during the demo. This is an ideal final year project for CSE, B.Tech and M.Tech students: it combines a real-world healthcare problem, a rigorous model-comparison methodology, explainable AI, and a polished working application — everything an examiner looks for.
How it works
- Data loading — standard clinical datasets for diabetes, heart disease (UCI) and stroke prediction are loaded and documented.
- Preprocessing pipeline — missing-value imputation, categorical encoding, feature scaling and a stratified train–test split keep the experiment reproducible.
- Model training & comparison — five classifiers are trained and evaluated with stratified k-fold cross-validation; the best model per disease is selected on F1-score and ROC-AUC.
- Model packaging — winning models are serialized and loaded by the MediPredict app — no GPU needed.
- Live prediction — user inputs are run through the same preprocessing pipeline; the app returns a risk probability, a severity band and an explanation of the top contributing features.
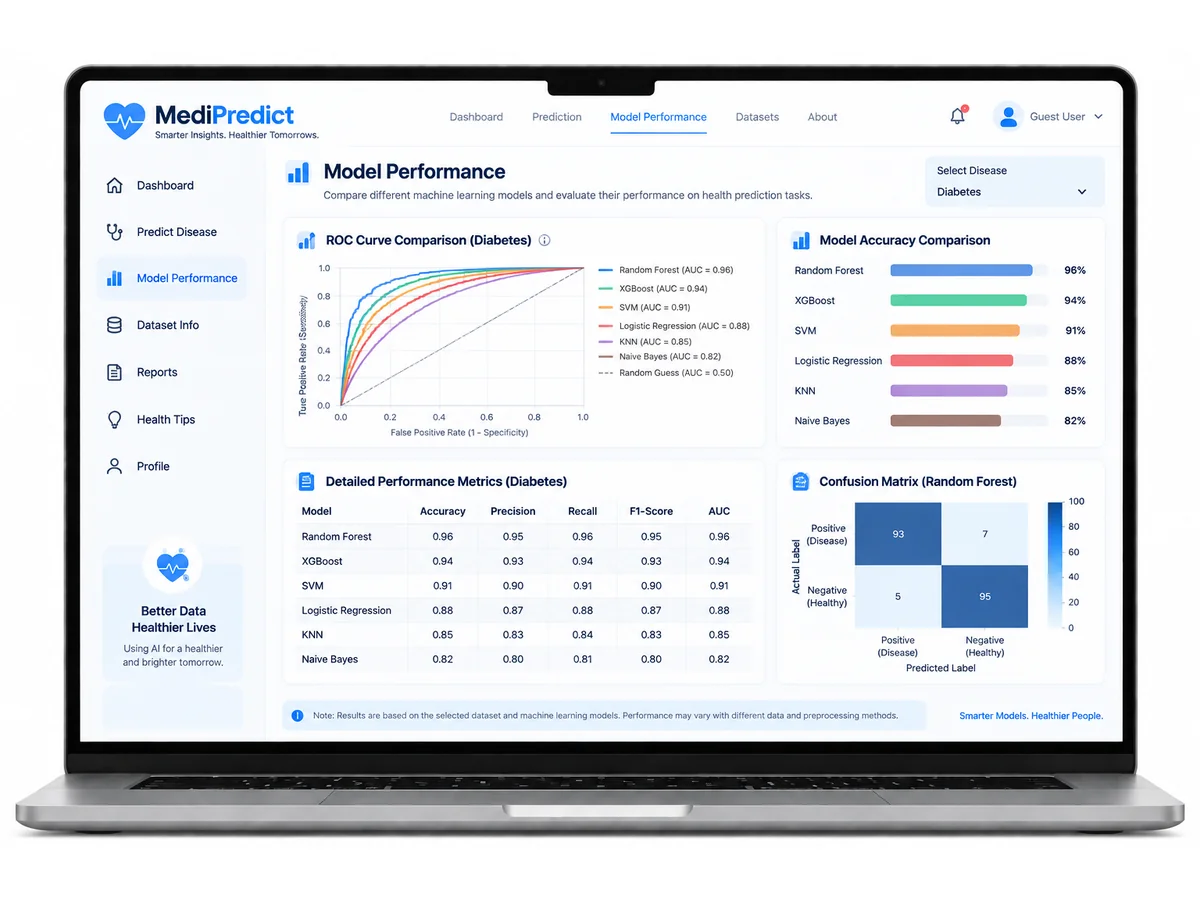
- Evaluation view — examiners can open the dashboard to inspect cross-validation metrics, confusion matrices and ROC curves for every model.
Project features
Multi-disease risk prediction — predicts diabetes, heart-disease and stroke risk from clinical input features in one system.
Live symptom-checker web app (MediPredict) — enter vitals and clinical values, get an instant risk probability with a severity band (Low / Moderate / High).
Model comparison built in — trains Logistic Regression, SVM, Random Forest, Gradient Boosting and k-NN, and compares them with stratified k-fold cross-validation.
Explainable predictions — every prediction shows per-feature importance and SHAP values, so the examiner can see why the model flagged the risk.
Evaluator dashboard — accuracy, precision, recall, F1-score, ROC-AUC, confusion matrices and ROC curves, all plotted and ready for the report.
Batch prediction — upload a CSV of patient records and screen them all at once.
Pre-trained models included — serialized .pkl model files bundled, so the demo runs instantly with no retraining.
Medical disclaimer on every prediction screen — responsible, examiner-friendly design.
What is included
Full source code (training pipeline + MediPredict web app)
Trained model files (.pkl) — demo-ready out of the box
Datasets, preprocessing scripts and experiment notebooks
Formatted project report PDF with metrics tables and plots
Viva presentation (PPT)
Viva Q&A preparation document
Demo walkthrough video
Installation & run guide
Viva support until your submission is complete
Limitations & prerequisites
MediPredict is an educational screening aid, not a medical diagnostic tool — predictions are probabilistic and never a substitute for professional medical advice; the app carries a disclaimer on every prediction screen.
Models are trained on public clinical datasets that may not represent all populations; generalization limits are documented in the report.
Accuracy is bounded by dataset quality and class imbalance — handled and reported transparently, not hidden.
The web app is a demonstration build for academic evaluation, not a certified clinical device.
Components & software requirements
Python, scikit-learn, pandas, NumPy, SHAP / feature-importance explainability, Flask/Streamlit web app, Matplotlib/Seaborn (plots), Jupyter notebooks (experiments), pickle/joblib (model serialization)