
More project photos (2)
The problem
Card fraud is a needle-in-a-haystack problem: in the well-known ULB dataset, only 492 of 284,807 transactions are fraudulent — 0.172%. Rule-based systems drown in false alarms, and supervised classifiers struggle because fraud patterns mutate while labeled examples stay rare. Anomaly detection flips the problem: instead of learning what fraud looks like, learn what normal looks like and flag what doesn't fit. Isolation Forest does this elegantly — it recursively partitions transactions on random features, and anomalies get isolated in far fewer splits than normal points, no labels required. This project implements that idea end to end: preprocessing of the ULB schema (Time, PCA-anonymized V1–V28, Amount), an Isolation Forest trained on legitimate transactions, contamination-based threshold tuning, and a monitoring dashboard with an anomaly map, alert feed and precision/recall tradeoff explorer. The report is honest about the hard parts — extreme imbalance, uninterpretable PCA features and concept drift — which is exactly what makes it strong viva material.
How it works
- The ULB creditcard.csv is loaded; Time and Amount are standardized, V1–V28 used as-is (already PCA-scaled).
- Data is split with stratification so the tiny fraud fraction is preserved in validation and test sets.
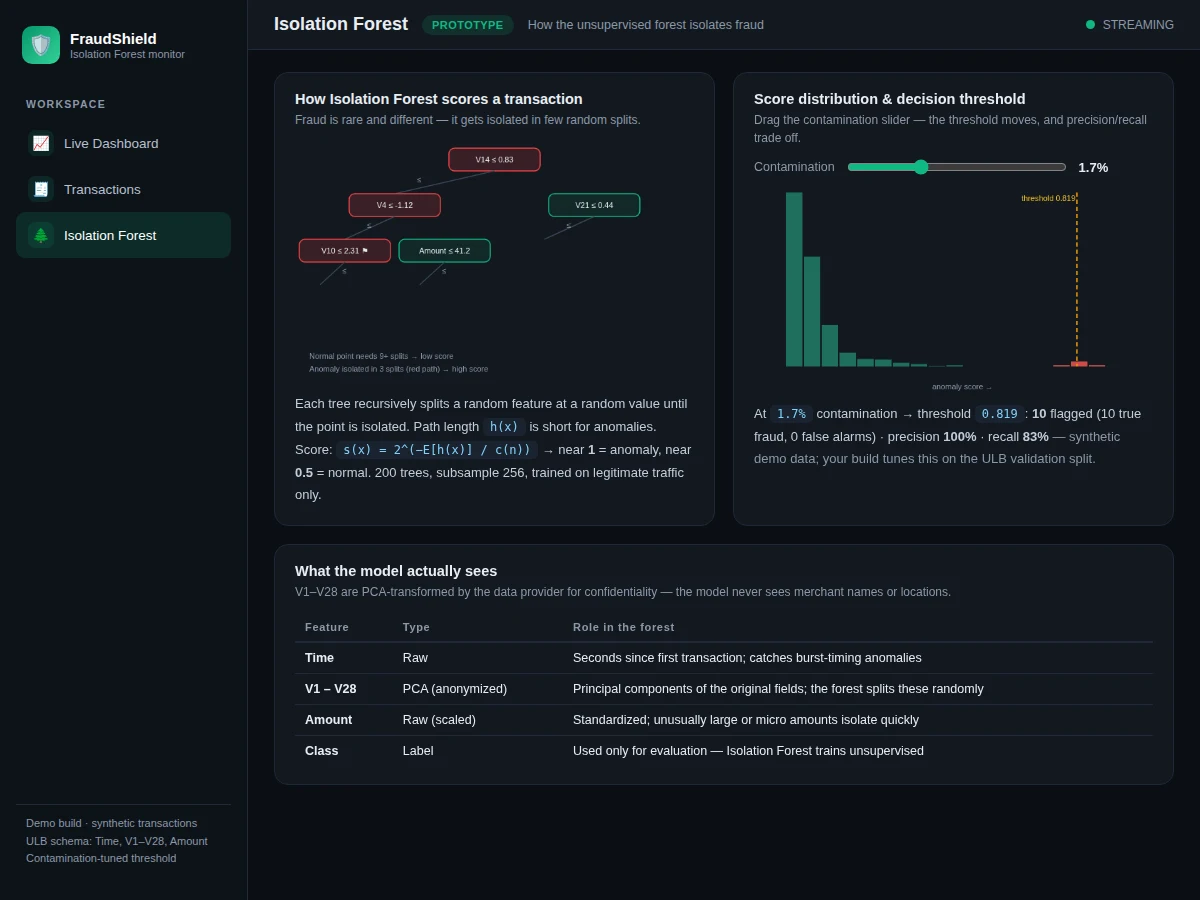
- IsolationForest fits 200 random trees on legitimate transactions: each tree splits random features at random values until points isolate.
- Each transaction's mean path length converts to an anomaly score — near 1 for anomalies, near 0.5 for normal.
- A contamination fraction sets the score threshold; transactions above it are flagged.
- The dashboard streams scored transactions, plots them on the anomaly map and routes high scores to the alert feed.
Tech stack:
- Python 3.10, scikit-learn (IsolationForest, metrics, train_test_split)
- pandas, NumPy (ULB schema handling, scaling, ledger tables)
- Matplotlib, Seaborn (score distributions, ROC/PR curves, anomaly maps)
- Flask dashboard (live monitor, transaction ledger, threshold tuner)
- Jupyter notebook (buyer-run training, threshold tuning, evaluation)
- ULB Credit Card Fraud Detection dataset (Kaggle mlg-ulb/creditcardfraud)
| Parameter | Value |
|---|---|
| Dataset | ULB Credit Card Fraud Detection (Kaggle): 284,807 transactions, 492 frauds (0.172%); features Time, V1–V28 (PCA-anonymized), Amount, Class; European cardholders, Sept 2013 |
| Model | Isolation Forest — 200 trees, max_samples 256, trained unsupervised on legitimate transactions |
| Scoring | Anomaly score from mean isolation path length; contamination-tuned threshold |
| Task | Unsupervised anomaly detection (no fraud labels used in training) |
| Evaluation | Precision, recall, F1, ROC-AUC, PR curve — computed by the notebook on your held-out split during your build |
| Demo | Flask dashboard: live monitor, transaction ledger, threshold tuner |
| Latency | Median scoring latency measured in the notebook (design target: under 100 ms per transaction) |
Project features
- [ULB dataset pipeline] Loading, scaling and stratified splitting of the 284,807-transaction Kaggle set, with the 0.172% fraud rate and PCA-anonymized V1–V28 schema documented.
- [Isolation Forest training] scikit-learn IsolationForest (200 trees, subsample 256) trained on legitimate transactions only — genuinely unsupervised, no fraud labels used in fitting.
- [Anomaly scoring API] Per-transaction scores in [0, 1] from mean path length, with median scoring latency measured in the notebook.
- [Live monitoring dashboard] Anomaly map over V1–V2, KPI cards, and a streaming alert feed showing flagged transactions as they arrive.
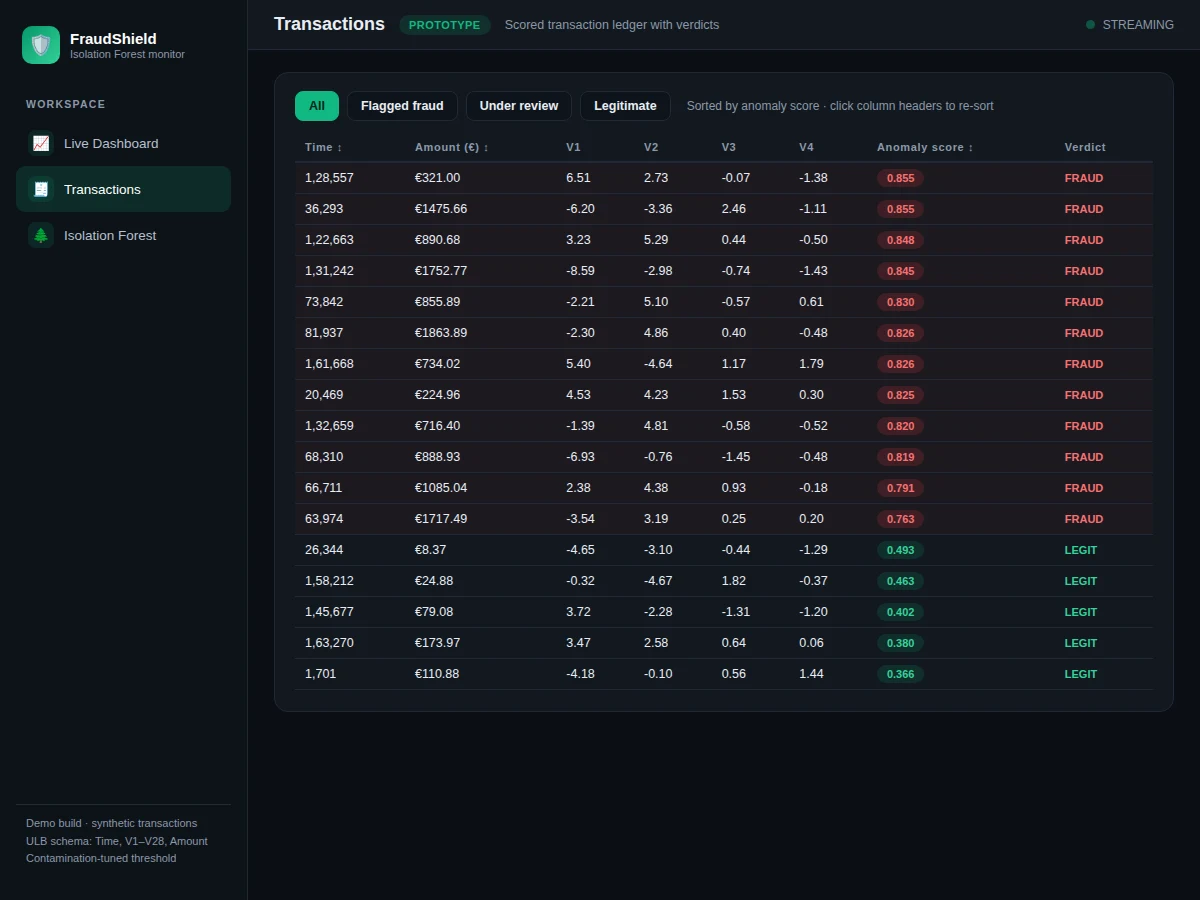
- [Transaction ledger] Sortable, filterable table of scored transactions with verdicts (fraud / review / legitimate) and score pills.
- [Threshold tuner] Contamination slider that moves the decision threshold live, showing how flagged counts, precision and recall trade off.
- [Evaluation notebook] Precision, recall, F1, ROC-AUC and PR curves computed on the held-out split during your build — no pre-claimed numbers anywhere.
- [Concept-drift discussion] The report covers why a 2013-trained model decays on new fraud patterns and how retraining windows address it.
What is included
- Complete source code (preprocessing, forest training, scoring API, Flask dashboard)
- Jupyter training and evaluation notebook (buyer-run: tuning, threshold selection, full metric computation)
- Project report PDF (background, algorithm theory, imbalance handling, evaluation, drift discussion)
- PPT presentation for final review
- Viva Q&A preparation document (isolation principle, contamination, precision vs recall, PCA features)
- Setup guide (environment, downloading the ULB dataset from Kaggle, running the dashboard)
Limitations & prerequisites
- V1–V28 are PCA-transformed for cardholder confidentiality, so the model (and the analyst) cannot interpret what a "high V14" means in business terms — the report states this as a fundamental explainability limit.
- With only 0.172% fraud, precision is inherently painful: even a good detector produces false alarms, and the threshold tuner exists precisely to make that tradeoff visible rather than hidden.
- No accuracy or precision numbers are pre-claimed: every metric in the report comes from the notebook run on your own held-out split during your build.
- The dataset covers two days in September 2013 — fraud tactics have evolved since, so the model demonstrates the method, not a deployable 2026 fraud system; the report's drift section covers this.
- This is a transaction-scoring prototype, not a payment integration — it does not connect to gateways, block cards or handle real money.
Frequently Asked Questions
Which dataset is used?
The Credit Card Fraud Detection dataset by the Machine Learning Group at ULB (Kaggle: mlg-ulb/creditcardfraud): 284,807 transactions by European cardholders over two days in September 2013, with 492 confirmed frauds (0.172%). Features are Time, Amount and V1–V28 — PCA-transformed originals, published that way for confidentiality.
Why Isolation Forest instead of a classifier?
Fraud is rare, labels are scarce, and patterns mutate. Isolation Forest needs no fraud labels at all — it learns "normal" and flags what isolates quickly. That makes it the honest choice for a dataset where supervised models mostly memorize 492 examples.
Is the accuracy guaranteed?
No numbers are pre-claimed. The notebook computes precision, recall, F1, ROC-AUC and the PR curve on your held-out split, and the report presents your build's results with the threshold-selection procedure documented.
What is contamination?
The expected fraction of anomalies in the data — it sets the score threshold. The dashboard's slider shows live how raising it catches more fraud but also generates more false alarms.
Can it block real fraudulent payments?
No — this is a scoring and monitoring prototype. Production blocking needs gateway integration, sub-second SLAs, case management and regulatory compliance, all documented as future scope, not in the base build.
Is this project suitable for a final-year project?
Yes — it suits Computer Science, AI/ML and Data Science programs, demonstrating unsupervised learning, extreme class imbalance handling, threshold tuning and honest evaluation on a famous real dataset. Suitable for B.E./B.Tech final-year projects in Computer Science, AI/ML and Data Science.
Components & software requirements
- Python 3.10, scikit-learn (IsolationForest, metrics, train_test_split)
- pandas, NumPy (ULB schema handling, scaling, ledger tables)
- Matplotlib, Seaborn (score distributions, ROC/PR curves, anomaly maps)
- Flask dashboard (live monitor, transaction ledger, threshold tuner)
- Jupyter notebook (buyer-run training, threshold tuning, evaluation)
- ULB Credit Card Fraud Detection dataset (Kaggle mlg-ulb/creditcardfraud)
Delivery information
Built-to-order project. Delivery timeline is shared after order confirmation based on current queue.
Support terms
Complete documentation, setup guide, and viva preparation included. Support for setup and explanation provided.