
More project photos (3)
The problem
Traffic on one road is never independent of the roads around it. A jam building at one junction raises flow downstream minutes later, a slowdown on an arterial changes the side streets feeding it, and the same junction behaves differently at morning peak, midday, and evening peak. Forecasting one sensor's history in isolation misses those couplings. The CCST-GAN model, published by Singh, Jain, Tripathi and Sahani in IEEE Transactions on Intelligent Transportation Systems in 2025, models the whole sensor network as a graph: sensors are nodes, their relationships are learnt with graph attention, and three embeddings describe temporal dynamics, spatial interactions, and channel-based features of the traffic signals. A correlation score, the MX score, measures how similar nodes behave across time windows and helps select the most important data. This project implements that model for a student build, training on the public PEMS-BAY dataset from the Caltrans Performance Measurement System (PeMS), and adds a clearly separate Indian contribution: adaptation to heterogeneous city traffic — two-wheelers, autos, pedestrians and mixed flow — plus a congestion-alert and signal-timing recommendation layer built on top of the forecast.
This is a built-to-order software project: the forecasting model, demo console, report, presentation, and viva Q&A are prepared fresh for you. Starting price: Rs 28,000 (final price confirmed after topic, base paper and compute scope are locked).
The Problem
City traffic forecasting fails in a specific, repeatable way: models that look only at one road's past cannot explain why that road's flow suddenly changes. The cause is usually elsewhere in the network — a neighbouring junction, a corridor feeding into it, or a pattern from the same hour yesterday or last week — and a single-series model has no way to represent that cause. At the same time, a traffic signal carries more than one channel: flow, occupancy and average speed move together but not identically, and treating them as one blended number throws away information about what kind of congestion is forming. Graph methods help with the network structure, but many of them use fixed adjacency or treat every neighbour equally, so they cannot say which neighbours matter at a given time. The CCST-GAN paper addresses exactly this combination: dynamic spatial relationships through graph attention, temporal patterns through a dedicated temporal branch, channel interactions through a channel embedding, and node similarity across time windows through the MX score. The student build reproduces that reasoning chain on public data, then faces the harder real-world variant the paper does not cover: Indian city traffic, where vehicle types, lane discipline and pedestrian movement are far more mixed than in the paper's California sensor data.
Base paper at a glance
| Item | Detail |
|---|---|
| Paper | "Correlated Channeled Spatio-Temporal Graph Attention Network Model for Traffic Prediction", Singh, Jain, Tripathi and Sahani, IEEE Transactions on Intelligent Transportation Systems, 2025, vol. 26, no. 7, pp. 9421–9431, DOI https://doi.org/10.1109/TITS.2025.3563631 |
| Method | A correlated channeled spatio-temporal graph attention network (CCST-GAN) that learns three embeddings — temporal dynamics, spatial interactions and channel-based features — through graph attention networks, with an MX-score correlation representation for node similarity across time windows |
| Dataset | Paper's datasets: five public real-world traffic datasets built from the Caltrans Performance Measurement System (PeMS) — PEMSD3, PEMSD4, PEMSD7, PEMSD8 and PEMS-BAY, each a different California district road network, aggregated into 5-minute intervals. The student build uses PEMS-BAY only (public, from the same PeMS source): it carries 3 features per node — flow, occupancy and average speed — unlike PEMSD3 and PEMSD7, which carry flow only. The build does not claim results on the other four datasets |
| Authors' reported results | The authors report, on their five datasets, a 9.7% improved error rate for the proposed model against the compared state-of-the-art methods. This is the paper's own reported figure, labelled as such, and it is not this build's measured result; the student build's own figures come only from its runs on PEMS-BAY |
| What we implement | The road-sensor graph with graph attention; the three embeddings (temporal, spatial, channel); MX-score node similarity across time windows; multi-component fusion with time gating; and evaluation with MAE, MAPE and RMSE on PEMS-BAY |
| Own features | Heterogeneous Indian city traffic adaptation (two-wheelers, autos, pedestrians, mixed flow); a congestion-alert layer on top of the forecast; a signal-timing recommendation layer; a lane-free network-graph demo console; and a paper-vs-adaptation comparison showing exactly what the paper covers and what the team added |
Base paper
- Paper: "Correlated Channeled Spatio-Temporal Graph Attention Network Model for Traffic Prediction", Vishal Krishna Singh, Neeraj Jain, Gaurav Tripathi and Sharad Sahani, IEEE Transactions on Intelligent Transportation Systems, 2025, vol. 26, no. 7, pp. 9421–9431.
- DOI: https://doi.org/10.1109/TITS.2025.3563631 (IEEE Xplore document 11005672). Accepted manuscript consulted via the University of Essex repository record for this paper.
- Problem the paper tackles: accurate real-time traffic prediction is hard because spatio-temporal dependencies change frequently, network dynamics are complex, and traffic density varies; existing methods explore hidden linkages but under-use the multi-faceted interactions between different features of traffic signals.
- What is implemented from the paper: the traffic network as a spatio-temporal graph with sensors as nodes; graph attention networks learning three embeddings — temporal dynamics, spatial interactions and channel-based features; the MX score (maximum match score) as a correlation representation for spatial dynamics, measuring node similarity across time windows; an MX-score-based graph convolution (MXGCN) and multi-component fusion with a time-gated technique; and evaluation with MAE, MAPE and RMSE.
- What is deliberately not claimed: no per-dataset error table is quoted, because the manuscript's tables are not reproduced here and no single number from them is verified for this listing beyond the abstract's headline figure; and the 9.7% figure is quoted only as the authors' reported figure, never as a promise for the student build.
- Paper-reported results (the paper's own findings, not this build's measured results): the authors report that the proposed model outperforms the compared state-of-the-art methods across their five datasets and achieves a 9.7% improved error rate. No other accuracy or metric number is attached to that finding here, and the student build's report records only the figures its own PEMS-BAY runs actually produce.
Own features
These are the student's own contribution, clearly distinct from the base paper:
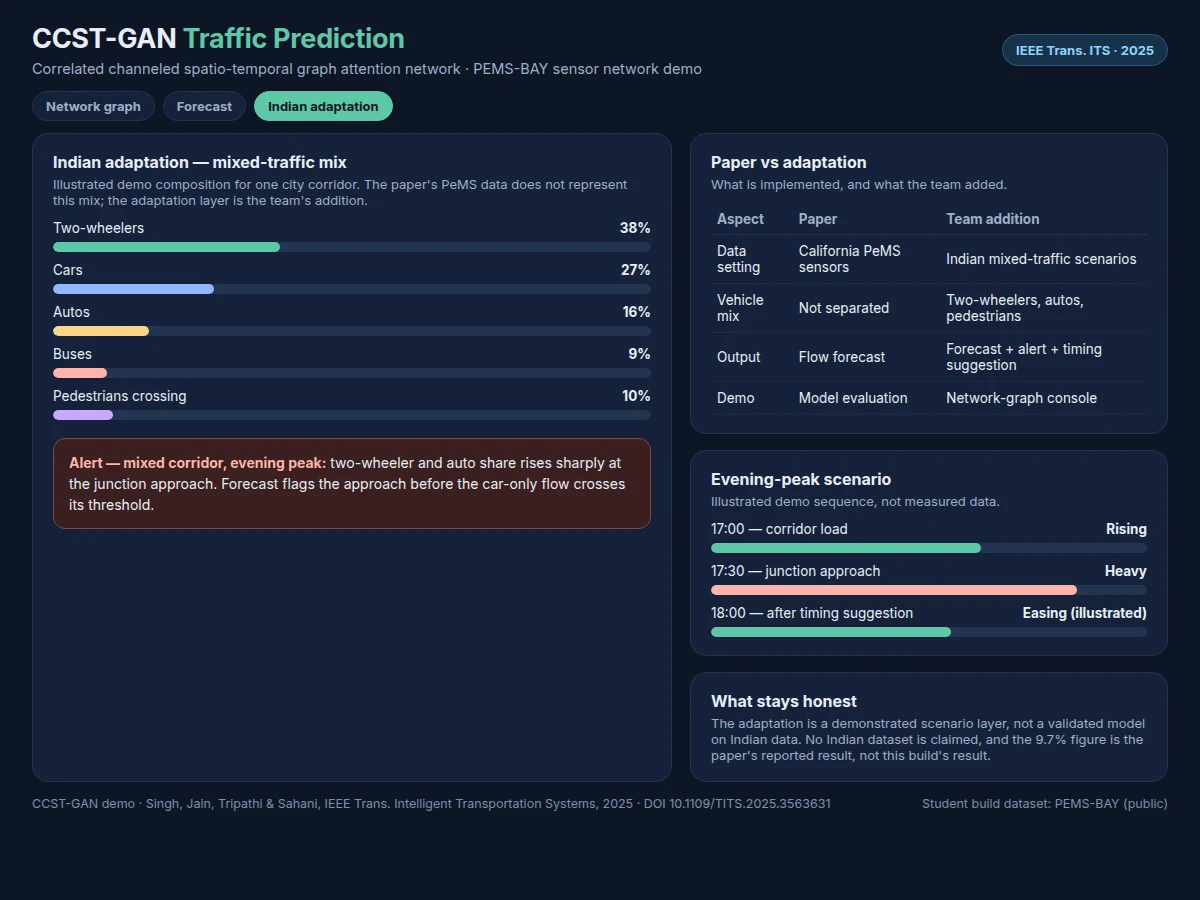
- [Heterogeneous Indian city traffic adaptation] The paper's California sensor networks assume broadly homogeneous vehicle flow. The adaptation layer reframes the node features and the demo scenarios for mixed Indian city traffic — two-wheelers, autos, cars, buses and pedestrians sharing the same corridors — so the forecast discussion covers vehicle-mix effects the paper's datasets do not represent. This is presented as an adaptation layer, not as a claim about the paper's model.
- [Congestion-alert layer] A threshold layer on top of the forecast: when a node's predicted flow and occupancy cross stated thresholds in the forecast horizon, the console raises a congestion alert naming the node, the horizon, and the predicted level, instead of leaving the forecast as a bare number.
- [Signal-timing recommendation layer] A recommendation output that converts a congested forecast into a plain suggestion — for example, extending green time on the congested approach or shortening it on a light approach — labelled as a recommendation for study and demonstration, not as a deployed traffic-control decision.
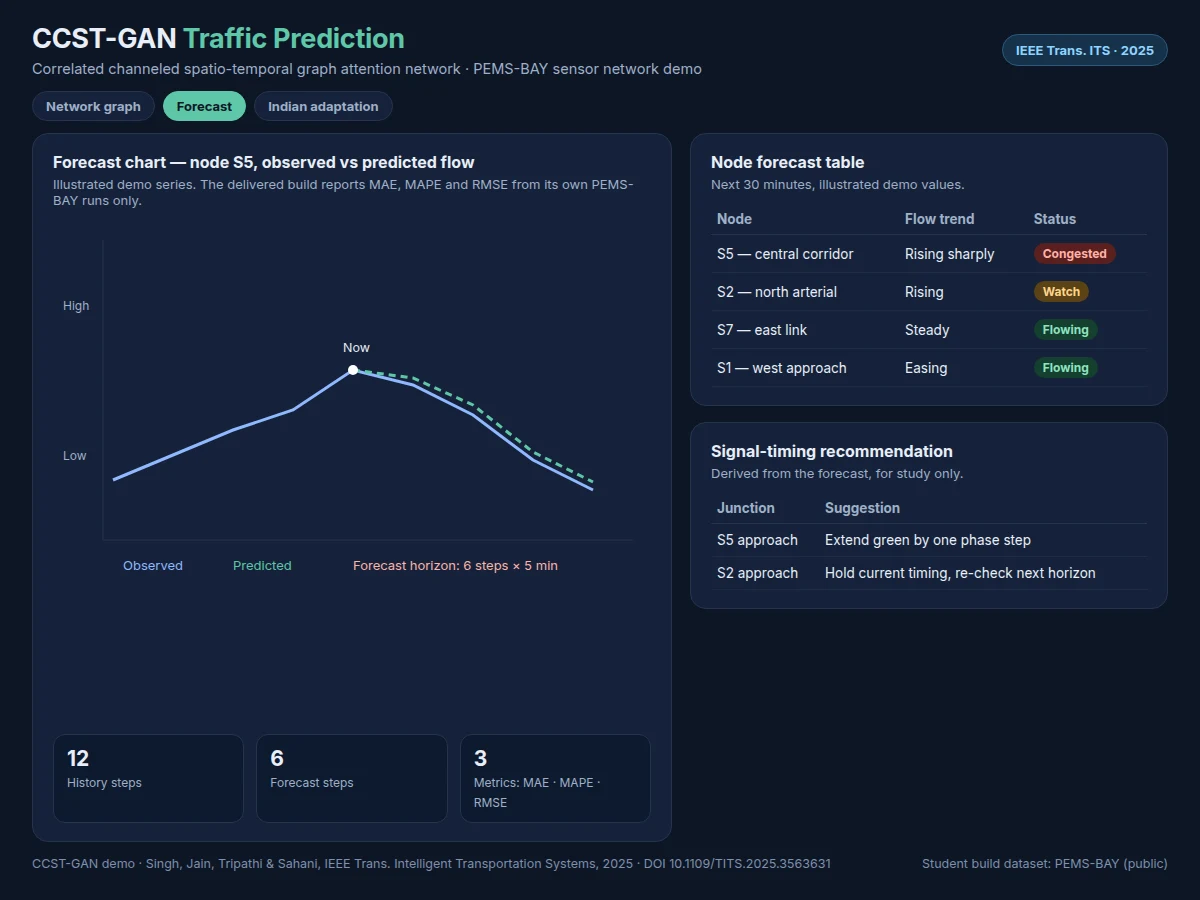
- [Lane-free network-graph demo console] A demo that shows the sensor network as a graph with attention-weighted edges, so a reviewer can see which neighbours the model is weighting heavily at a given time step, rather than taking the attention mechanism on trust. It is lane-free by design: nodes are sensors and corridors, not individual lanes.
- [Paper vs adaptation comparison] A side-by-side comparison of what the paper covers (PeMS sensor networks, three embeddings, MX score) against what the team added (Indian mixed-traffic adaptation, alert layer, timing layer), so the student's contribution is auditable, not asserted.
How it works
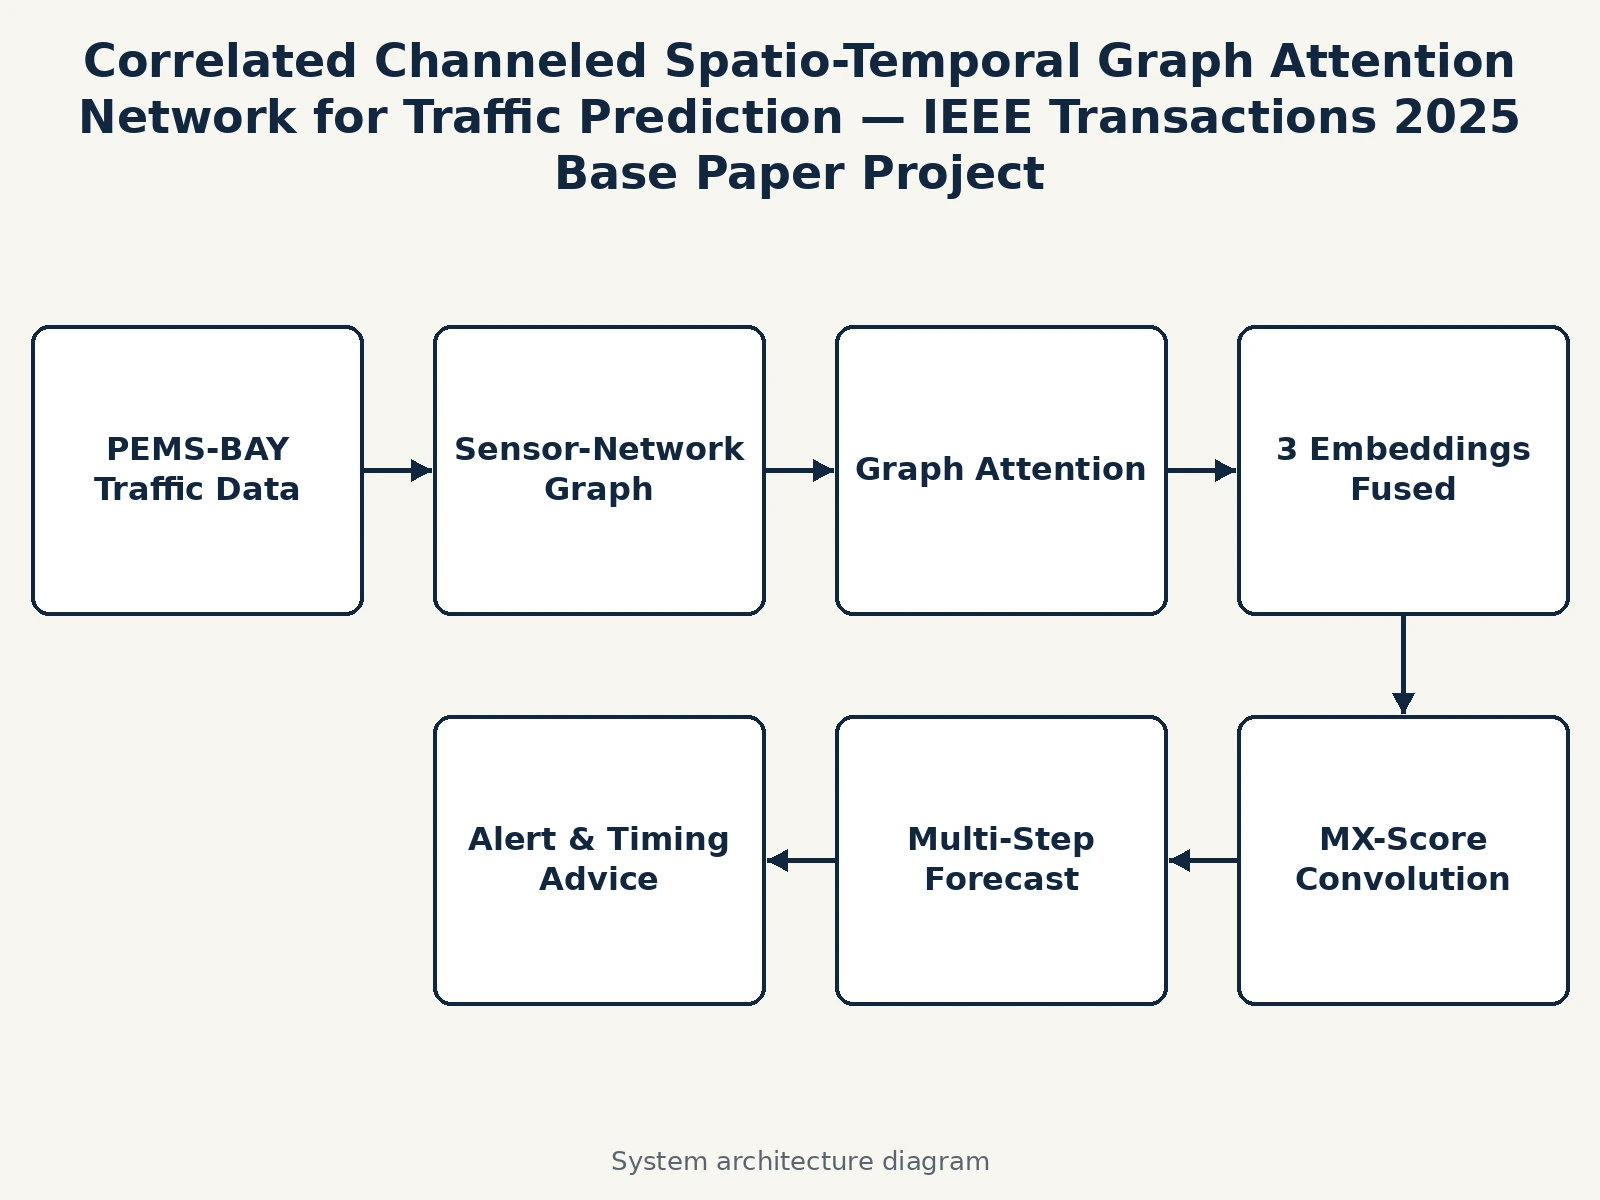
The pipeline runs as a visible chain, and each stage's output is shown in the demo so a student can explain it in a viva. First, the PEMS-BAY sensor network is loaded as a graph: each sensor is a node carrying flow, occupancy and average speed at 5-minute intervals. A history window of past time steps is assembled for every node. The MX score is computed between nodes across time windows, giving an explicit similarity signal that feeds the graph convolution. The three embedding branches then run: the temporal branch captures how each node's series evolves, the spatial branch captures how nodes influence each other through graph attention, and the channel branch captures how flow, occupancy and speed interact. The branches are fused with the paper's multi-component time-gated fusion, and the fused representation produces the forecast for each node over the horizon. Finally, the two own-feature layers read the forecast: the alert layer flags nodes crossing congestion thresholds, and the timing layer suggests a green-time adjustment for flagged junctions. The Indian adaptation layer reframes the demo scenarios and node-feature discussion for mixed traffic, and the comparison panel keeps paper and adaptation visibly separate.
- Load the PEMS-BAY sensor network as a graph, with each sensor node carrying flow, occupancy and average speed at 5-minute intervals (public Caltrans PeMS data).
- Assemble a history window of past time steps for every node as the model input.
- Compute MX-score similarity between nodes across time windows and build the correlation-informed graph structure.
- Run the three embedding branches: temporal dynamics, spatial interactions and channel-based features, through graph attention networks.
- Fuse the branches with multi-component time-gated fusion to produce the forecast for every node over the horizon.
- Evaluate the forecast against held-out data with MAE, MAPE and RMSE, and record only the figures the student's own runs produce.
- Run the congestion-alert layer: flag any node whose forecast crosses the stated flow and occupancy thresholds, naming node, horizon and predicted level.
- Run the signal-timing recommendation layer: convert each flagged forecast into a plain green-time suggestion for the affected junction, labelled as a study recommendation.
- Show the Indian adaptation panel: mixed-traffic composition (two-wheelers, autos, cars, buses, pedestrians) and how it reframes the forecast discussion, kept distinct from the paper's PeMS setting.
- Display every stage — graph with attention-weighted edges, embeddings, forecast chart, alerts and timing suggestions — in the demo console for review and viva demonstration.
Tech stack:
- Python 3 · PyTorch Geometric
- Graph attention networks · MX-score similarity
- PEMS-BAY public dataset · Caltrans PeMS
- HTML · CSS · JavaScript demo console
- Matplotlib · evaluation plots
- Pandas · NumPy data handling
- Git · Jupyter Notebook
Dataset & model details
- Dataset (paper): Five public real-world traffic datasets built from the Caltrans Performance Measurement System (PeMS) — PEMSD3, PEMSD4, PEMSD7, PEMSD8 and PEMS-BAY — each a different California district road network, aggregated into 5-minute intervals (12 time steps per hour). PEMSD3 and PEMSD7 carry flow only; PEMSD4, PEMSD8 and PEMS-BAY carry 3 features per node: flow, occupancy and average speed.
- Dataset (student build): PEMS-BAY only, public, from the same Caltrans PeMS source as the paper's datasets, with 3 features per node (flow, occupancy and average speed). The build does not reuse or claim results on PEMSD3, PEMSD4, PEMSD7 or PEMSD8, and its results are not directly comparable to the paper's five-dataset findings.
- Dataset (Indian adaptation): The mixed-traffic adaptation is demonstrated on illustrated demo scenarios in the console, not on a published Indian dataset, and it is labelled as such wherever it appears. No Indian dataset is claimed.
- Task: Traffic prediction; input = a history window of sensor readings across the network graph, output = forecast traffic conditions for every node over the horizon, plus alert and timing layers on top.
- Model: CCST-GAN as described in the paper — graph attention networks with temporal, spatial and channel embeddings, MX-score correlation representation, MXGCN graph convolution, and multi-component time-gated fusion. No architecture detail beyond the paper's description is claimed for it here.
- Metrics: MAE (Mean Absolute Error), MAPE (Mean Absolute Percentage Error) and RMSE (Root Mean Square Error), the paper's evaluation metrics. No figure is claimed before the student's own runs; the report records the figures those runs on PEMS-BAY actually produce.
| Parameter | Value |
|---|---|
| Model | CCST-GAN · correlated channeled spatio-temporal graph attention network (paper's model) |
| Embeddings | 3 embeddings (temporal · spatial · channel) |
| Node similarity | MX score · maximum match score (paper's correlation representation) |
| Paper datasets | 5 datasets (PEMSD3 · PEMSD4 · PEMSD7 · PEMSD8 · PEMS-BAY · all public Caltrans PeMS) |
| Student-build dataset | PEMS-BAY · public Caltrans PeMS · 3 features per node (flow · occupancy · average speed) |
| Data interval | 5 minutes per time step (paper's aggregation · 12 time steps per hour) |
| Metrics | MAE · MAPE · RMSE (paper's evaluation metrics) |
| Paper | IEEE Transactions on Intelligent Transportation Systems · 2025 · vol. 26 · no. 7 · pp. 9421–9431 |
| Work plan | 110 hours total (planned) |
| Demo console | Single-file web demo · runs offline after download (expected) |
| Deliverables | 4 items (code · report · PPT · viva Q&A) |
| Starting price | Rs 28,000 (starting price · final price confirmed after topic · base paper and compute scope are locked) |
Project features
CCST-GAN traffic prediction delivers seven working capabilities: a sensor-network graph, graph attention over that graph, three embeddings, MX-score node similarity, multi-horizon forecasting, a congestion-alert layer, and a signal-timing recommendation layer, all visible in a demo console a reviewer can operate. The graph turns a set of sensors into a network, so a forecast for one node can draw on the behaviour of its neighbours. Graph attention weights those neighbours dynamically: the same pair of nodes can matter more at peak hour than at midday. The three embeddings keep temporal dynamics, spatial interactions and channel features separate before fusion, so each kind of interaction is learnt rather than blended away. The MX score adds a second, explicit similarity signal — how alike two nodes behave across time windows — which feeds the graph convolution. Forecasting runs over a multi-step horizon from a fixed-length history window, and the two own-feature layers turn the forecast into something actionable: an alert when congestion is predicted, and a timing suggestion for the affected junction.
- [Sensor-network graph] Represents the road network as a graph with sensors as nodes and their relationships as edges, so forecasts use network context instead of isolated histories.
- [Graph attention over neighbours] Learns attention weights between nodes that change with traffic conditions, rather than treating every neighbour equally or fixing adjacency in advance.
- [Three embeddings] Learns temporal dynamics, spatial interactions and channel-based features as separate embeddings through graph attention networks, then fuses them.
- [MX-score node similarity] Uses the paper's maximum match score to measure how similar nodes behave across time windows, feeding the MX-score-based graph convolution.
- [Multi-step forecasting] Forecasts traffic conditions over a multi-step horizon from a history window of past time steps, evaluated with MAE, MAPE and RMSE.
- [Congestion-alert layer] Raises a named alert when a node's forecast crosses stated flow and occupancy thresholds, with the node, horizon and predicted level shown.
- [Signal-timing recommendation layer] Converts a congested forecast into a plain timing suggestion for the affected junction, labelled as a study recommendation, not a deployed control decision.
What is included
- Complete CCST-GAN forecasting pipeline source code (graph construction, MX score, three embeddings, fusion, forecasting, alert layer, timing layer, Indian adaptation layer)
- Interactive demo console (the web demo shown on this page) with network-graph view, forecast chart, embedding panels and Indian adaptation panel
- Project report PDF (background, base paper, methodology, experiments, limitations)
- PPT presentation for final review
- Viva Q&A preparation document (CCST-GAN, MX score, embeddings, PEMS-BAY vs the paper's five datasets, Indian adaptation, limitations)
- Starting price: Rs 28,000 (final price confirmed after topic, base paper and compute scope are locked)
- Specific next step: message on WhatsApp for a quotation stating scope (CCST-GAN traffic prediction plus Indian adaptation plus congestion-alert and signal-timing layer), starting price Rs 28,000, and delivery under the 110-hour work plan as a built-to-order project
Work plan & timeline
Total work plan: 110 hours, split across six phases. Phase 1, base-paper study and environment setup: 15 hours — reading the CCST-GAN paper, setting up Python, PyTorch Geometric, and the PEMS-BAY data pipeline. Phase 2, graph and MX score: 25 hours — sensor-network graph construction, MX-score similarity, and the correlation-informed graph structure. Phase 3, embeddings and fusion: 25 hours — temporal, spatial and channel embedding branches, multi-component time-gated fusion, and the forecasting head. Phase 4, Indian adaptation and action layers: 15 hours — mixed-traffic adaptation scenarios, congestion-alert thresholds, and signal-timing recommendations. Phase 5, evaluation and report: 15 hours — MAE, MAPE and RMSE evaluation on PEMS-BAY, diagrams, and the full project report. Phase 6, presentation and viva preparation: 15 hours — PPT, demo walkthrough, and the viva Q&A document.
Support
Support covers setup help for the delivered code, a walkthrough of the model and the demo console, and fixes for defects in the delivered code. Guidance is also provided for adapting the report and presentation to the student's college format and for answering guide questions about the base paper, the MX score, and the student's own contribution. Support does not cover re-running experiments on the student's personal machine beyond the setup walkthrough, and it does not invent results for experiments that were not run.
Limitations & prerequisites
- The student build trains and evaluates on PEMS-BAY only, so its figures are not comparable to the paper's five-dataset results and must not be presented as reproducing the paper's 9.7% improved error rate.
- PEMS-BAY is California highway sensor data; it does not represent Indian city traffic, and the Indian adaptation is a demonstrated scenario layer, not a validated model on Indian data.
- The congestion-alert and signal-timing outputs are study recommendations from a forecast, not deployed traffic-control decisions, and must not be presented as a certified traffic-management system.
- Forecast quality depends on sensor coverage and data quality; missing sensors, faulty readings and exceptional events (collisions, roadworks) degrade forecasts, and this is measured rather than hidden in evaluation.
- Graph attention weights are model-internal explanations, not causal proof that one road causes another's congestion; the viva discussion must keep that distinction.
- No accuracy figure is claimed before the student's own runs; any figure in the final report comes only from those runs on PEMS-BAY.
- Final quality figures depend on the dataset subset, hyperparameters, and hardware used, and are recorded only after the student's runs.
Frequently Asked Questions
Is this project suitable as a degree project?
Yes, it fits Computer Science, IT and AI & Machine Learning programmes. It demonstrates graph attention networks, three-way embedding design, MX-score node similarity, and multi-step forecasting on a public dataset, together with a distinct Indian adaptation and two action layers — a strong base-paper story with a genuine viva discussion. The work plan totals 110 hours across paper study, graph and embedding build, adaptation, evaluation, report, and presentation.
What is the base paper, and what is implemented from it?
The base paper is the CCST-GAN paper, "Correlated Channeled Spatio-Temporal Graph Attention Network Model for Traffic Prediction", IEEE Transactions on Intelligent Transportation Systems, 2025 (DOI 10.1109/TITS.2025.3563631). Implemented from it: the sensor-network graph, graph attention with temporal, spatial and channel embeddings, MX-score node similarity, MXGCN graph convolution, multi-component time-gated fusion, and MAE, MAPE and RMSE evaluation.
Which datasets are used, and does the build reuse all five of the paper's datasets?
No — the paper evaluates on five public PeMS datasets (PEMSD3, PEMSD4, PEMSD7, PEMSD8 and PEMS-BAY). The student build uses PEMS-BAY only, a public Caltrans PeMS dataset with flow, occupancy and average speed per node, so its results are its own and are not presented as the paper's five-dataset results.
How is this different from ordinary time-series forecasting?
Ordinary forecasting models one road's history in isolation. CCST-GAN models the whole sensor network as a graph, learns which neighbours matter at a given time through attention, keeps channel, temporal and spatial interactions separate before fusion, and forecasts every node at once.
What will I receive, and can it be customised?
You receive the forecasting pipeline source code, the interactive demo console, the project report, the presentation, and the viva Q&A document. Customisation is realistic: a different PeMS dataset subset, different alert thresholds, additional mixed-traffic scenarios, or a college-specific report format can be developed on request.
Is the base paper included?
Yes, the full citation with DOI link is on the page, and the implementation follows that paper.
What is the base paper vs the own features?
The base paper is the published method being implemented — CCST-GAN with its three embeddings, MX score and graph attention. The own features are the team's additional contribution, listed separately on the page — the heterogeneous Indian city traffic adaptation, the congestion-alert layer, the signal-timing recommendation layer, the lane-free network-graph demo console, and the paper-vs-adaptation comparison.
Can my guide approve this paper?
The paper is a recent IEEE Transactions paper with a verifiable DOI, which is what guides check; final approval always rests with the student's own guide and college.
Do you give Phase-1 and Phase-2 documents?
Yes: abstract, literature survey, and review decks in Phase-1; full build, report, and viva preparation in Phase-2.
How do I get a quotation?
Message on WhatsApp for a quotation stating scope (CCST-GAN traffic prediction plus Indian adaptation plus congestion-alert and signal-timing layer), starting price Rs 28,000, and delivery under the 110-hour work plan as a built-to-order project. The final price is confirmed after topic, base paper, and compute scope are locked.
Components & software requirements
- Python 3 · PyTorch Geometric
- Graph attention networks · MX-score similarity
- PEMS-BAY public dataset · Caltrans PeMS
- HTML · CSS · JavaScript demo console
- Matplotlib · evaluation plots
- Pandas · NumPy data handling
- Git · Jupyter Notebook
Dataset & model details
- Dataset (paper): Five public real-world traffic datasets built from the Caltrans Performance Measurement System (PeMS) — PEMSD3, PEMSD4, PEMSD7, PEMSD8 and PEMS-BAY — each a different California district road network, aggregated into 5-minute intervals (12 time steps per hour). PEMSD3 and PEMSD7 carry flow only; PEMSD4, PEMSD8 and PEMS-BAY carry 3 features per node: flow, occupancy and average speed.
- Dataset (student build): PEMS-BAY only, public, from the same Caltrans PeMS source as the paper's datasets, with 3 features per node (flow, occupancy and average speed). The build does not reuse or claim results on PEMSD3, PEMSD4, PEMSD7 or PEMSD8, and its results are not directly comparable to the paper's five-dataset findings.
- Dataset (Indian adaptation): The mixed-traffic adaptation is demonstrated on illustrated demo scenarios in the console, not on a published Indian dataset, and it is labelled as such wherever it appears. No Indian dataset is claimed.
- Task: Traffic prediction; input = a history window of sensor readings across the network graph, output = forecast traffic conditions for every node over the horizon, plus alert and timing layers on top.
- Model: CCST-GAN as described in the paper — graph attention networks with temporal, spatial and channel embeddings, MX-score correlation representation, MXGCN graph convolution, and multi-component time-gated fusion. No architecture detail beyond the paper's description is claimed for it here.
- Metrics: MAE (Mean Absolute Error), MAPE (Mean Absolute Percentage Error) and RMSE (Root Mean Square Error), the paper's evaluation metrics. No figure is claimed before the student's own runs; the report records the figures those runs on PEMS-BAY actually produce.
Delivery information
Built-to-order project. Delivery timeline is shared after order confirmation based on current queue.
Support terms
Complete documentation, setup guide, and viva preparation included. Support for setup and explanation provided.
Download free synopsis (PDF)
Enter your name and WhatsApp number — the synopsis PDF downloads immediately. We may send occasional project updates on WhatsApp; no spam.
Singh et al., IEEE Transactions on Intelligent Transportation Systems, 2025