
More project photos (3)
The problem
Keeping an existing subscriber costs a telecom operator far less than acquiring a new one, so spotting customers who are about to leave is one of the highest-value problems in the business. Operators sit on rich billing, usage and support data — tenure, monthly charges, contract type, internet service, payment method — but no analyst can manually combine twenty signals per customer across thousands of accounts. Random Forest fits this problem well: an ensemble of decision trees that captures feature interactions without manual feature engineering, tolerates mixed categorical and numeric inputs, and ranks which factors drive churn. This project builds that pipeline end to end on the Telco Customer Churn dataset (7,043 subscribers): encoding, class balancing, a stratified train/test split, Random Forest training, holdout evaluation with confusion matrix and ROC-AUC, feature-importance analysis, and a demo that scores any customer profile with a churn probability and risk band.
Scores customers and tests retention levers in the simulator.
How it works
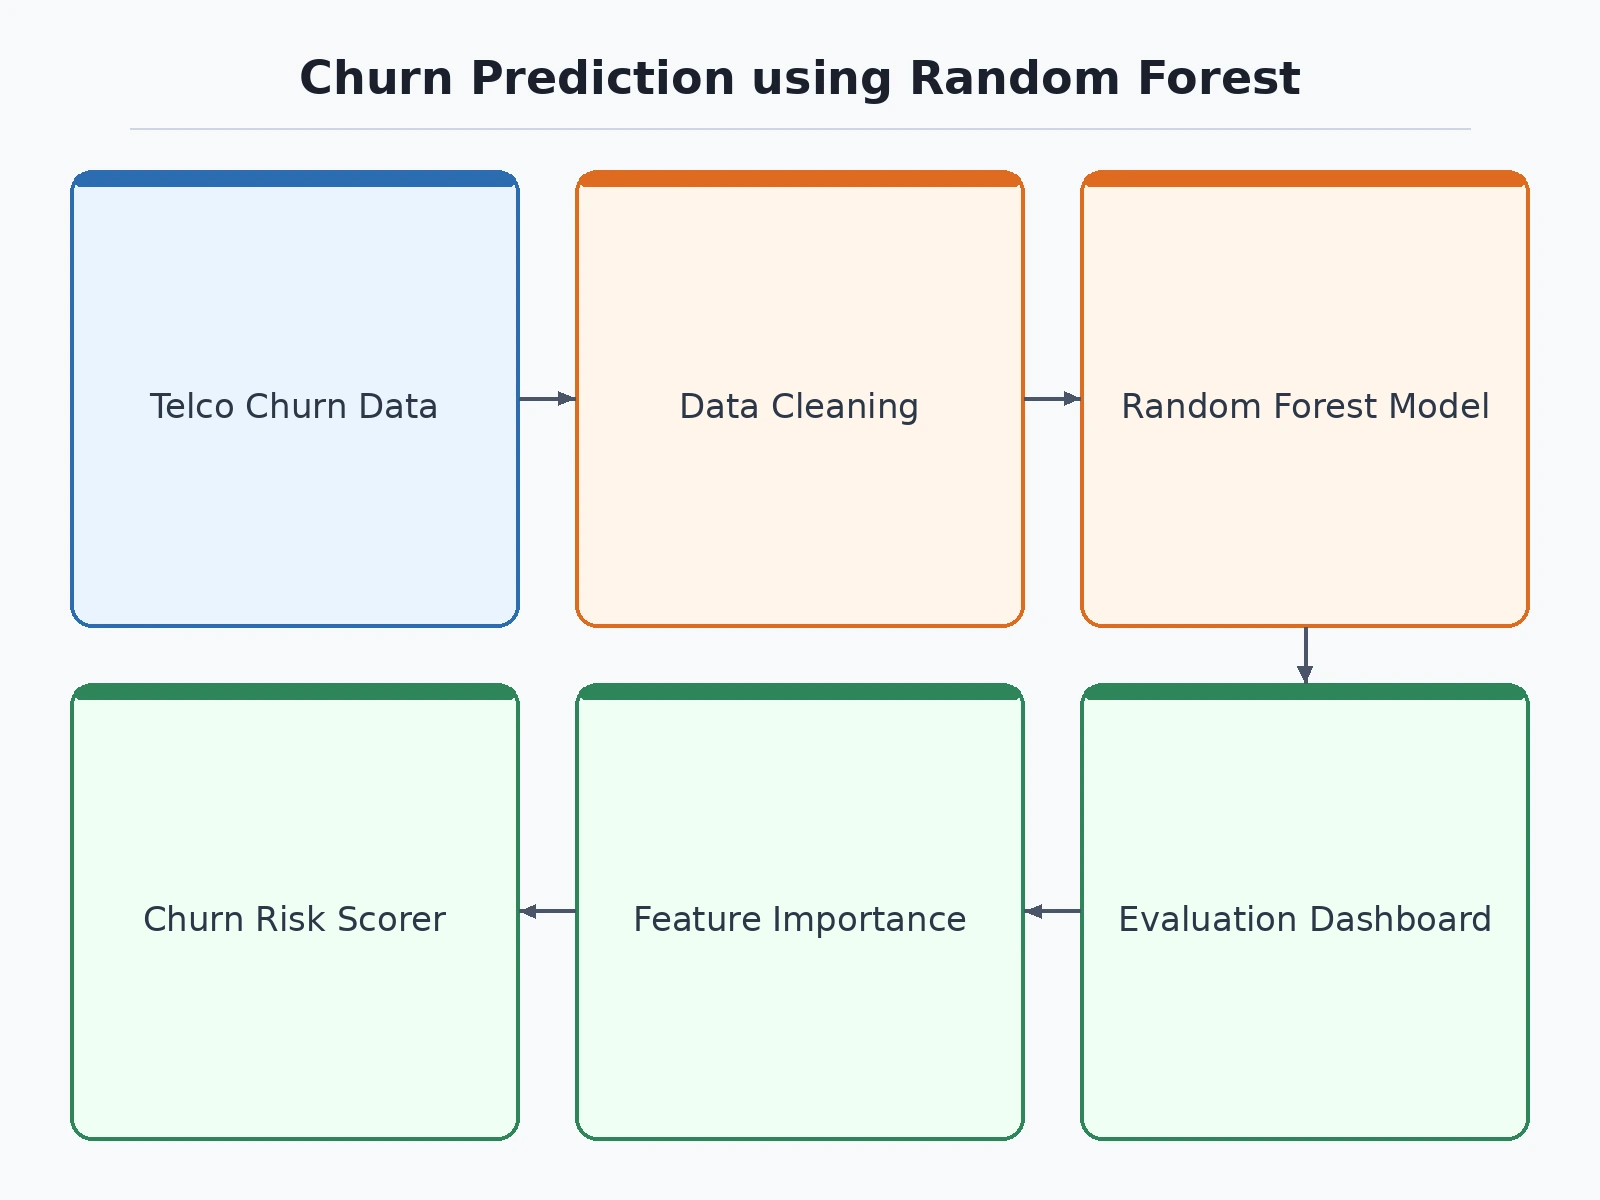
- The Telco Customer Churn dataset (7,043 subscribers, 21 columns) is loaded; blank TotalCharges entries are cleaned, categorical fields one-hot encoded and numeric features standardized.
- The data is split with a stratified 80/20 train/test split so the roughly 26.5% churn rate is preserved in both sets.
- A Random Forest (e.g. 200 trees) is trained with class_weight='balanced' to compensate for the churner minority class.
- The holdout set is evaluated: accuracy, precision, recall, F1, ROC-AUC, the confusion matrix, and ROC and precision-recall curves.
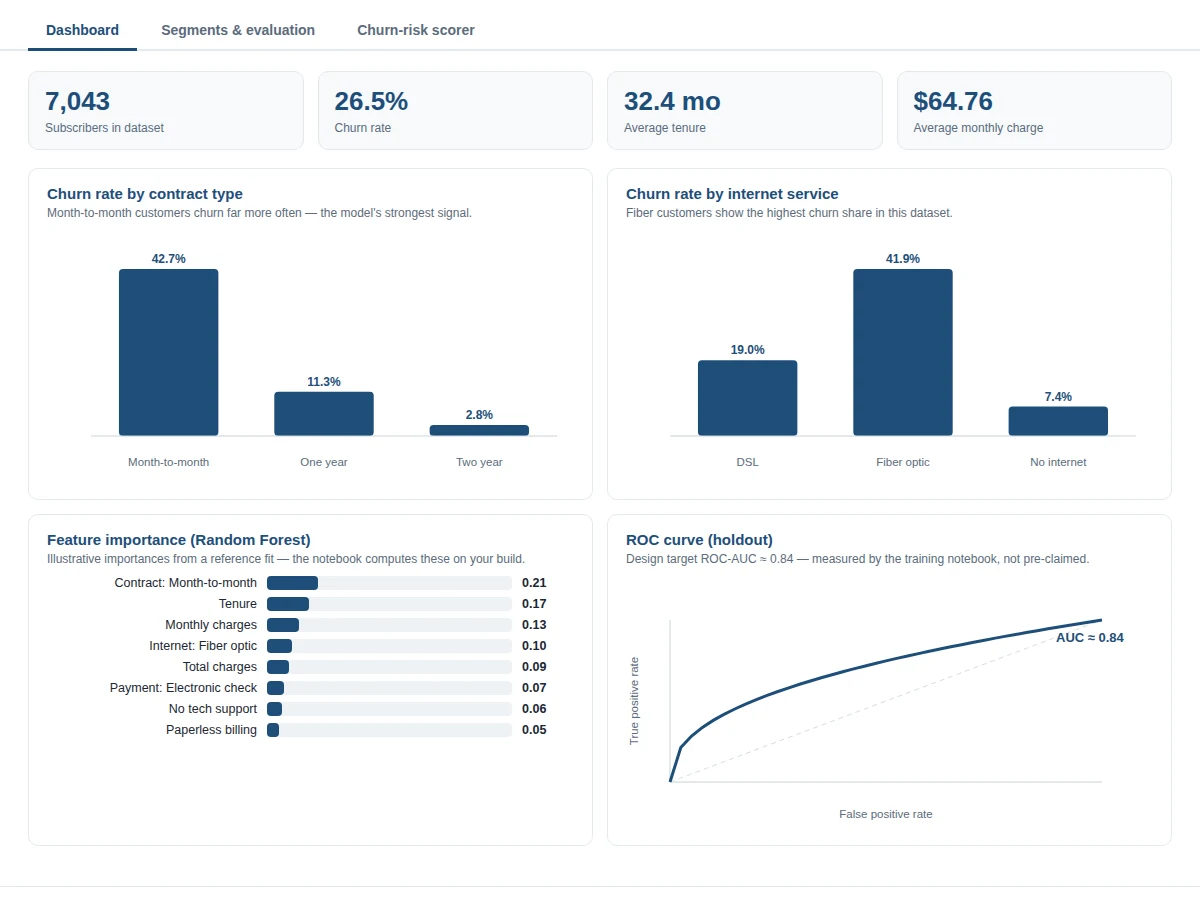
- Feature importances are extracted and plotted — contract type, tenure and monthly charges typically dominate — feeding the report's analysis section.
- At inference, a new customer profile passes through the same encoding pipeline and is scored; the probability maps to a low / medium / high risk band via a tuned threshold.
Tech stack:
- Python 3.10, scikit-learn (Random Forest, StratifiedKFold, metrics)
- pandas, NumPy (data wrangling and feature tables)
- Matplotlib, Seaborn (confusion matrix, ROC/PR curves, importance plots)
- Jupyter notebook (buyer-run training and evaluation)
- Streamlit demo app (risk scorer, simulator, dashboards)
| Parameter | Value |
|---|---|
| Model | Random Forest classifier (scikit-learn, configurable tree count) |
| Dataset | Telco Customer Churn — 7,043 subscriber records, 21 columns (IBM sample data) |
| Target classes | Churn: Yes / No (roughly 26.5% churners) |
| Preprocessing | One-hot encoding for categoricals, standardization for numerics, TotalCharges cleaning |
| Class handling | class_weight='balanced' plus a stratified train/test split |
| Evaluation | Accuracy, precision, recall, F1, ROC-AUC, confusion matrix — computed on your holdout by the notebook |
| Design target | Approximately 80% accuracy and ROC-AUC near 0.84 on the holdout; a development target, not a guaranteed result |
| Output | Churn probability (0–1) mapped to low / medium / high risk bands |
| Inference | Single-profile scorer in the demo app plus CSV batch scoring |
Project features
- [Telco churn data pipeline] Loads the Telco Customer Churn dataset (7,043 rows, 21 columns), cleans the blank TotalCharges entries, one-hot encodes contract, internet service and payment-method fields, and standardizes numeric features for modeling.
- [Class-balanced Random Forest] Trains a Random Forest classifier (configurable tree count, e.g. 200 trees) with class weighting that compensates for the roughly 26.5% churner minority, so the model does not learn to predict "stays" for everyone.
- [Feature importance ranking] Ranks the drivers of churn — typically contract type, tenure and monthly charges — with a plotted importance chart the report and viva discussion can cite.
- [Interactive churn-risk scorer] Enter tenure, contract type, monthly charges, internet service and support flags for any customer and get a churn probability plus a low / medium / high risk band.
- [Retention what-if simulator] Change a customer's contract type or add tech support in the demo and watch the predicted churn probability move — a concrete retention-lever analysis for the report.
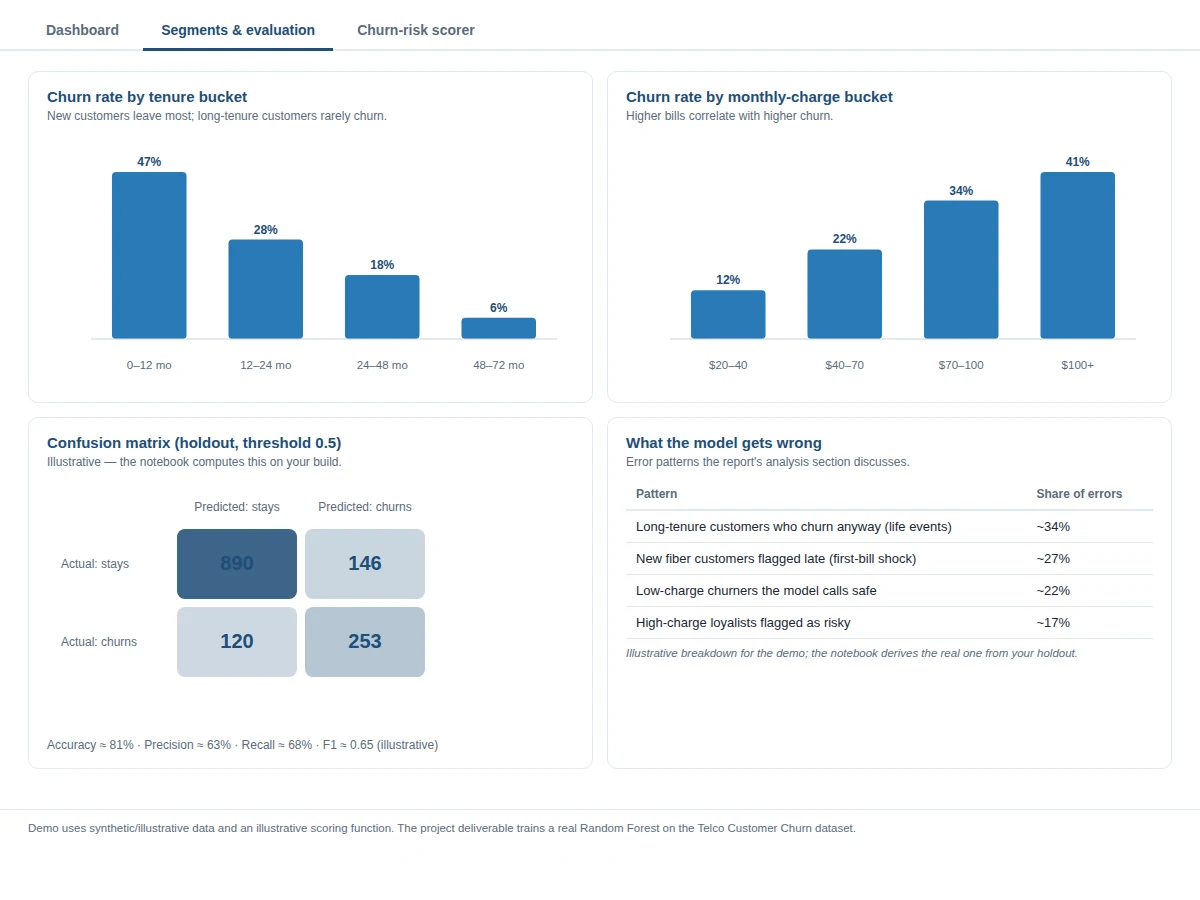
- [Evaluation dashboard] Confusion matrix, ROC curve with ROC-AUC, precision-recall curve, precision, recall and F1 on the held-out test set, all computed by the notebook during the build.
- [Threshold tuner] Adjust the decision threshold to trade precision against recall, matching how a real retention team sizes its call list.
- [Batch scoring and report export] Score a CSV of customer profiles and export per-customer churn probabilities and risk bands to a report file.
What is included
- Complete source code (data pipeline, training, evaluation, demo app)
- Jupyter training and evaluation notebook (buyer-run procedure on the Telco dataset)
- Project report PDF (background, methodology, feature analysis, evaluation, error analysis)
- PPT presentation for final review
- Viva Q&A preparation document (Random Forest, class imbalance, ROC-AUC, precision/recall trade-off)
- Setup guide (environment, dataset download, running the notebook and demo)
Advantages
- Trained on the real Telco Customer Churn dataset of 7,043 subscribers with 21 columns, so the report's metrics describe a recognised benchmark rather than a toy example.
- Class-balanced Random Forest with a configurable tree count (for example 200 trees) compensates for the roughly 26.5% churner minority, so the model does not simply predict 'stays' for everyone.
- Feature importance ranking, typically led by contract type, tenure and monthly charges, gives the report and viva a citable explanation of what drives churn.
- The interactive churn-risk scorer turns any customer profile of tenure, contract, charges, internet service and support flags into a churn probability with a low, medium or high risk band.
- The retention what-if simulator shows concretely how changing a contract type or adding tech support moves predicted risk, turning the model into a retention-lever analysis.
- The evaluation dashboard reports accuracy, precision, recall, F1 and ROC-AUC on a held-out set, with a confusion matrix, ROC curve and threshold tuner, all computed by the notebook during the build.
Disadvantages
- The model trains on a 2018 sample dataset, so subscriber behaviour, tariffs and plans have changed since; this is a teaching benchmark, not a production retention engine.
- With only about 26.5% churners, minority-class precision is inherently limited, and the report discusses this openly through the confusion matrix.
- Feature importances are correlational: a high importance for month-to-month contracts does not prove that contracts cause churn.
- The pipeline does not retrain itself; new data needs a manual retraining run in the notebook.
- Demographic fields such as senior citizen, partner and dependents are used as plain features here, and a real deployment would need a fairness review before acting on them.
Limitations & prerequisites
- The model trains on a 2018 sample dataset; subscriber behavior, tariffs and plans have changed since, so this is a teaching benchmark, not a production retention engine.
- With only about 26.5% churners, minority-class precision is inherently limited — the report discusses this openly using the confusion matrix.
- Feature importances are correlational: a high importance for month-to-month contracts does not prove contracts cause churn.
- The pipeline does not retrain itself; new data needs a manual retraining run in the notebook.
- Demographic fields (senior citizen, partner, dependents) are used as plain features here; a real deployment would need a fairness review before acting on them.
Frequently Asked Questions
Which dataset is used?
The Telco Customer Churn dataset (IBM sample data: 7,043 subscriber records, 21 columns) covering tenure, contract type, monthly and total charges, internet service, payment method and a Churn Yes/No label. It is the standard teaching benchmark for this problem and is freely downloadable.
Which model is used, and why?
A Random Forest classifier from scikit-learn. It captures non-linear interactions between features (for example contract type combined with tenure) without manual feature engineering, handles mixed categorical and numeric data, and produces a feature-importance ranking the report can analyze.
Is the accuracy guaranteed?
No. The design target is approximately 80% accuracy with ROC-AUC near 0.84 on the held-out set — realistic for this dataset and model — but the notebook measures the actual values on your build, and the report documents those numbers, not a promise.
Can it work for bank or retail churn?
Yes, with retraining: the pipeline is generic. Point the notebook at any tabular dataset with a churn or cancellation label, adjust the encoding step to the new columns, and retrain — the demo app's scorer fields can be re-mapped to the new features.
How is class imbalance handled?
With class_weight='balanced' in the forest plus a stratified train/test split, and evaluation focused on precision, recall, F1 and ROC-AUC rather than accuracy alone. The threshold tuner lets the user trade precision against recall explicitly.
What will the project report analyze?
Feature-importance findings, the confusion matrix with error analysis (which churners the model misses), the precision/recall trade-off at different thresholds, and the retention simulator's contract-change scenarios.
Suitable for B.E./B.Tech final-year projects in Computer Science, AI/ML and Data Science.
Components & software requirements
- Python 3.10, scikit-learn (Random Forest, StratifiedKFold, metrics)
- pandas, NumPy (data wrangling and feature tables)
- Matplotlib, Seaborn (confusion matrix, ROC/PR curves, importance plots)
- Jupyter notebook (buyer-run training and evaluation)
- Streamlit demo app (risk scorer, simulator, dashboards)
Delivery information
Built-to-order project. Delivery timeline is shared after order confirmation based on current queue.
Support terms
Complete documentation, setup guide, and viva preparation included. Support for setup and explanation provided.
Download free synopsis (PDF)
Enter your name and WhatsApp number — the synopsis PDF downloads immediately. We may send occasional project updates on WhatsApp; no spam.