
More project photos (2)
The problem
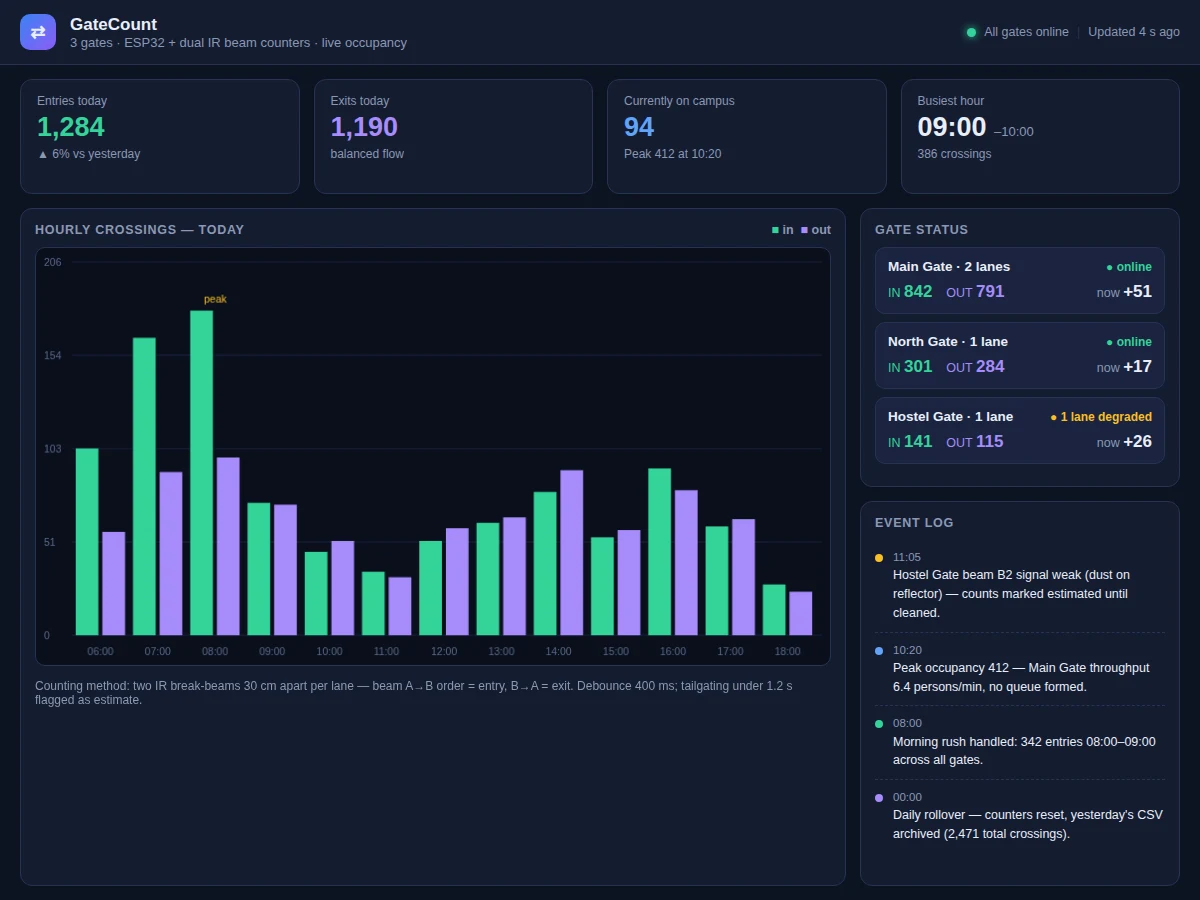
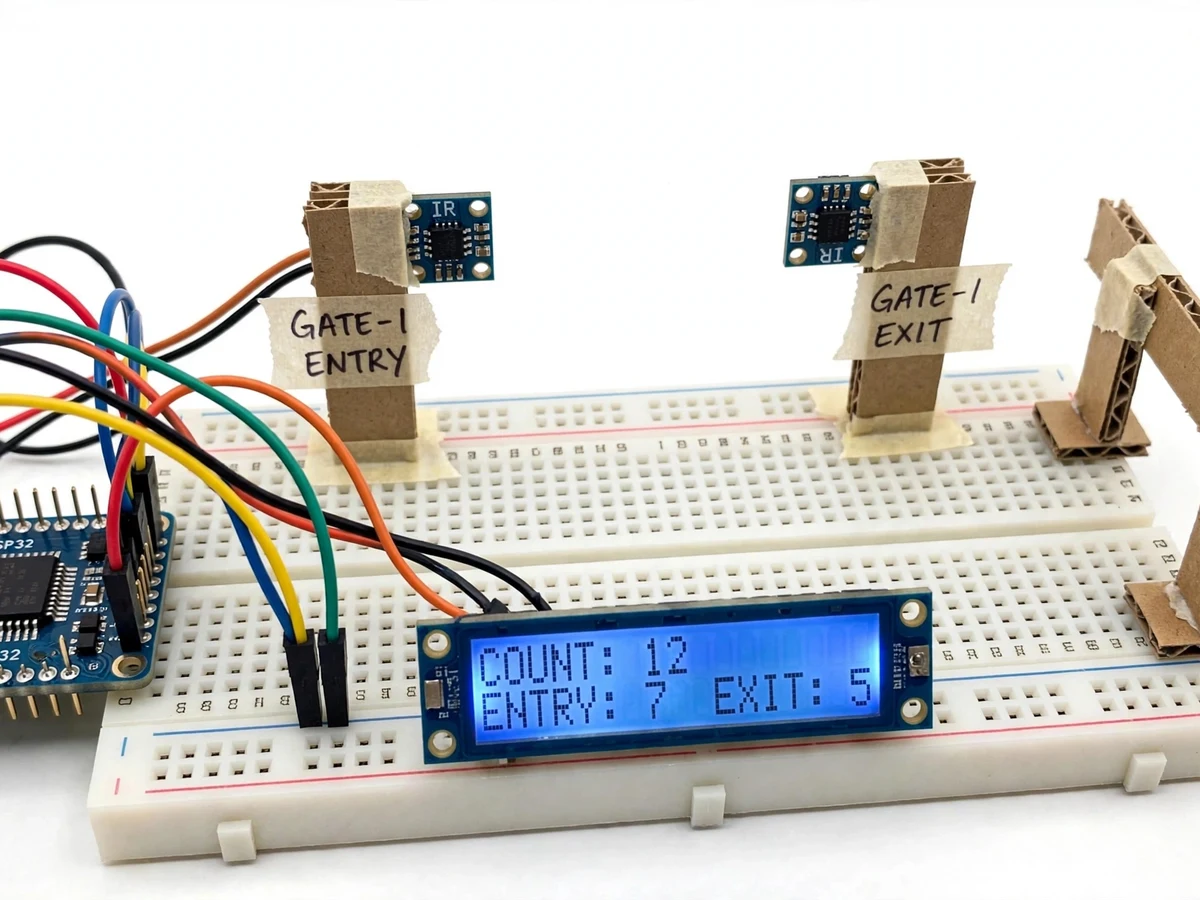
Campuses run on gut feel: how many people are on campus right now, which gate takes the morning rush, whether the hostel gate lane is even working. Without real counts, security staffing, shuttle timing and emergency planning are all guesses. This project puts a counter on every gate. An ESP32 reads two IR break-beam sensors mounted 30 cm apart per lane; the beam-break order gives direction (A→B = entry, B→A = exit), a 400 ms debounce filters noise, and tailgating under 1.2 s is flagged as an estimate rather than a clean count. A local LCD shows the running total (COUNT: 12, ENTRY: 7, EXIT: 5) while the dashboard aggregates all gates: entries/exits today, current occupancy with the day's peak, busiest hour, hourly in/out bars, per-gate status and an event log that calls out problems — e.g. a weak beam from dust on a reflector, marked as estimated counts until cleaned.
How it works
- Two IR break-beam sensors are mounted 30 cm apart across each gate lane, wired to ESP32 interrupt-capable pins.
- A beam break starts a timer; if the second beam breaks within the valid window, the order determines direction — A→B increments entries, B→A increments exits.
- A 400 ms debounce rejects sensor noise and flutter; breaks closer than 1.2 s apart are counted but flagged as tailgating estimates.
- The ESP32 keeps running totals and shows them on the gate's LCD (COUNT / ENTRY / EXIT) while pushing updates to the cloud dashboard.
- The dashboard aggregates all gates: entries/exits today, current occupancy (entries minus exits), hourly in/out bars, and per-gate lane status.
- At midnight the counters roll over, yesterday's 2,471 crossings are archived to CSV, and the event log notes the reset.
Tech stack:
- ESP32 firmware (interrupts, debounce)
- IR break-beam sensor pairs
- 16×2 LCD (local count display)
- Cloud dashboard (occupancy, charts, gates)
- MQTT/HTTP telemetry
- CSV daily archiving
- Git
| Parameter | Value |
|---|---|
| Controller | ESP32 |
| Sensing | Dual IR break-beam per lane, 30 cm spacing (design) |
| Direction logic | A→B = entry, B→A = exit (expected behavior) |
| Debounce | 400 ms; tailgating < 1.2 s flagged as estimate (design) |
| Demo gates | 3 gates (Main 2 lanes, North 1, Hostel 1) |
| Dashboard | Occupancy, hourly in/out, gate status, event log |
| Archiving | Daily CSV rollover at 00:00 (design behavior) |
| Local display | LCD: COUNT / ENTRY / EXIT |
Project features
- [Direction sensing] Two IR break-beams 30 cm apart per lane; A→B break order = entry, B→A = exit — no cameras, no privacy concerns.
- [Live occupancy] Dashboard shows who's on campus now (demo: 94, peak 412 at 10:20) plus entries/exits today and the busiest hour.
- [Hourly crossing charts] In/out bar chart for the day with the peak hour marked, so rush patterns are visible at a glance.
- [Per-gate status] Main Gate (2 lanes), North Gate, Hostel Gate each report in/out counts and online state; degraded lanes are flagged honestly.
- [Tailgating flag] Crossings under 1.2 s apart are flagged as estimates — the system admits what it cannot measure cleanly.
- [Event log] Weak-beam warnings, peak-occupancy notes, rush summaries and daily rollover with CSV archiving of yesterday's counts.
- [Local LCD] Each gate shows its running count/entry/exit locally, so the unit works standalone without the dashboard.
What is included
- Complete ESP32 gate prototype (IR sensor pair, LCD, wiring diagram)
- Counting firmware (direction logic, debounce, tailgating flag, telemetry)
- Multi-gate dashboard (occupancy, hourly charts, gate status, event log)
- Installation guide (sensor mounting, lane spacing, calibration)
- Project report PDF (background, sensing theory, methodology)
- PPT presentation for final review
- Viva Q&A preparation document (IR sensing, interrupts, debounce, MQTT)
Limitations & prerequisites
- IR beams count bodies, not identities — two people passing shoulder-to-shoulder read as one; tailgating is flagged as an estimate, not resolved.
- Dust, misalignment or sunlight on the reflector degrades beams; the dashboard flags weak beams but cannot fix them — installation quality decides accuracy.
- The dashboard figures (1,284 entries, 94 on campus, peak 412) are illustrative simulation data from the demo app, not measurements from a deployed gate.
- Occupancy is entries-minus-exits, so it drifts if the unit resets mid-day; the midnight rollover and terminus resets bound the drift.
- Outdoor gates need weatherproof sensor housings and stable mounting — the prototype is a lab build.
Frequently Asked Questions
How does it know entry from exit?
Two IR beams 30 cm apart: breaking beam A then beam B means entry, B then A means exit. The order of the two breaks is the direction signal — no camera or face recognition involved.
What about tailgating?
People crossing less than 1.2 s apart are counted but flagged as estimates in the event log. The system is honest about what it cannot measure cleanly rather than silently miscounting.
Why not use a camera?
IR beams are cheaper, work in the dark, need far less processing, and raise no privacy issues — counting bodies at a gate does not need identities.
How accurate is it?
As a design target, clean single-file crossings count correctly; dense crowds and tailgating degrade accuracy. The demo's debounce (400 ms) and estimate-flagging are the mechanisms that keep the numbers honest.
Does each gate need the dashboard?
No — every gate shows its running COUNT/ENTRY/EXIT on its own LCD and keeps counting standalone; the dashboard aggregates multiple gates when connectivity is available.
Is this project suitable for a final-year project?
Yes — for IoT & Embedded, Electronics and Computer Science programs. It is a deployable people-counting system with interrupt-driven sensing, direction logic and a multi-node dashboard. Suitable for B.E./B.Tech final-year projects in IoT & Embedded Systems, Electronics and Computer Science.
Components & software requirements
- ESP32 firmware (interrupts, debounce)
- IR break-beam sensor pairs
- 16×2 LCD (local count display)
- Cloud dashboard (occupancy, charts, gates)
- MQTT/HTTP telemetry
- CSV daily archiving
- Git
Delivery information
Built-to-order project. Delivery timeline is shared after order confirmation based on current queue.
Support terms
Complete documentation, setup guide, and viva preparation included. Support for setup and explanation provided.