
More project photos (2)

The problem
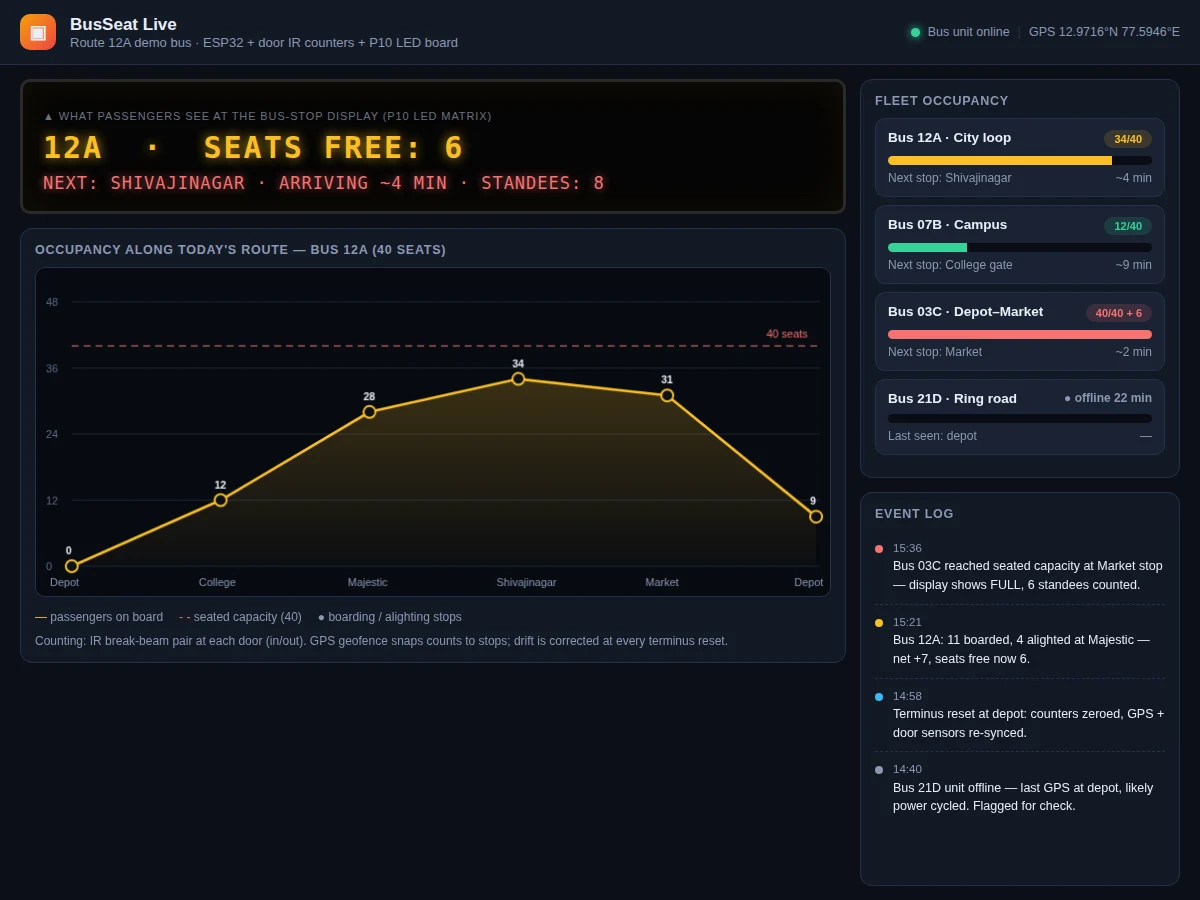
Nobody likes watching a packed bus roll past the stop — and transport operators have no live view of which buses are full, where the load builds up, or which unit went offline. This project closes that loop. An ESP32 on the bus counts passengers through IR break-beam pairs at the door (in/out), a GPS module geofences the route so counts snap to stops, and a terminus reset zeroes the counters at the depot to correct drift. At the bus stop, a P10 LED matrix shows what passengers actually need: "12A · SEATS FREE: 6 · NEXT: SHIVAJINAGAR · ARRIVING ~4 MIN · STANDEES: 8". The BusSeat Live fleet dashboard shows occupancy along today's route for each bus (a 40-seat bus climbing 0→12→28→34→31→9 across stops), fleet-wide occupancy bars, offline units, and an event log — e.g. "Bus 03C reached seated capacity at Market stop — display shows FULL, 6 standees counted."
How it works
- IR break-beam pairs at the bus door detect each crossing; the break order distinguishes boarding from alighting, and the ESP32 keeps a running net count.
- A GPS module reports position continuously; when the bus enters a stop's geofence, the current count is snapped to that stop for the route chart.
- At the depot terminus, a geofence reset zeroes the counters and re-syncs the door sensors, correcting any drift from missed or double counts.
- The ESP32 publishes occupancy, GPS and stop events to the cloud; the stop-side P10 LED matrix subscribes and scrolls the live seats-free message.
- The fleet dashboard renders each bus's occupancy bar, the along-route chart with the capacity line, offline flags, and the timestamped event log.
- When seated capacity is reached, the bus is marked FULL with standees counted separately; the stop display shows this so passengers can decide.
Tech stack:
- ESP32 firmware (door unit + stop display unit)
- IR break-beam sensor pairs
- GPS module (geofencing)
- P10 LED matrix display
- Cloud dashboard (fleet, routes, events)
- MQTT telemetry
- Git
| Parameter | Value |
|---|---|
| Controller | ESP32 (bus unit + stop display unit) |
| Counting | IR break-beam pair per door, in/out (expected behavior) |
| Display | P10 LED matrix, scrolling text (route, seats, ETA) |
| Positioning | GPS geofence per stop; drift corrected at terminus reset (design) |
| Demo fleet | 4 buses (12A City loop, 07B Campus, 03C Depot–Market, 21D Ring road) |
| Seating | 40 seats per bus (demo); standees counted separately |
| Dashboard | Fleet occupancy, along-route chart, event log |
| Update | Live occupancy + GPS coordinates (design behavior) |
Project features
- [Door counting] IR break-beam pairs at each bus door count boardings and alightings; net occupancy = boardings minus alightings.
- [P10 LED stop display] Scrolls the live message passengers need: route, seats free, next stop, arrival estimate, standees.
- [GPS geofencing] Counts snap to stops (Depot, College, Majestic, Shivajinagar, Market); the dashboard shows live GPS coordinates per bus.
- [Terminus reset] Counters zero at the depot and door sensors re-sync, correcting the drift that accumulates over a day.
- [Fleet dashboard] Every bus gets an occupancy bar (34/40, 12/40, 40/40 + 6 standees) with next stop and ETA; offline buses are flagged with last-seen data.
- [Occupancy-along-route chart] Per-stop passenger counts for a bus across its whole route, with the 40-seat capacity line drawn.
- [Event log] Full-bus events, boarding/alighting deltas per stop, resets and offline flags — the operator's audit trail.
What is included
- Complete bus-side ESP32 prototype (door IR sensors, GPS, wiring diagram)
- Stop-side P10 LED matrix display unit
- Counting and display firmware (geofencing, terminus reset, telemetry)
- Fleet dashboard (occupancy bars, route charts, event log)
- Installation guide (door sensor mounting, geofence setup, display wiring)
- Project report PDF (background, counting theory, methodology)
- PPT presentation for final review
- Viva Q&A preparation document (IR sensing, GPS, LED matrix, MQTT)
Limitations & prerequisites
- IR door counts drift over a day (missed or double counts in crowds); the terminus reset bounds this but between resets the count is an estimate — stated as a design behavior, not a measured accuracy.
- GPS geofences need tuning per route; urban canyons degrade position fixes and stop-snapping can lag.
- The dashboard figures (occupancy curves, ETAs, event log entries) are illustrative simulation data from the demo app, not measurements from a running fleet.
- The demo stop display shows one route; a real stop serving many routes needs a larger matrix and a route-selection scheme.
- An offline bus (power cycled, no GPS) is flagged from last-seen data — the system cannot track a unit that has no power.
Frequently Asked Questions
How are passengers counted?
IR break-beam pairs at the door: the break order gives boarding vs alighting, and the ESP32 keeps the net count. No cameras, no ticketing integration needed.
What corrects counting drift?
A terminus reset — when the bus reaches the depot geofence, counters zero and door sensors re-sync. Between resets the count is a running estimate.
What does the stop display show?
Route number, seats free, next stop, arrival estimate and standees — e.g. "12A · SEATS FREE: 6 · NEXT: SHIVAJINAGAR · ARRIVING ~4 MIN · STANDEES: 8", scrolling on a P10 LED matrix.
How does GPS fit in?
Geofences around each stop snap the live count to stops for the along-route chart, and the dashboard shows each bus's live coordinates and next-stop ETA.
What happens when a bus goes offline?
The dashboard flags it with last-seen GPS and a likely cause (e.g. "power cycled") so the operator knows it is a data gap, not an empty bus.
Is this project suitable for a final-year project?
Yes — for IoT & Embedded, Electronics and Computer Science programs. It is a real public-transport application combining embedded sensing, GPS, LED displays and fleet telemetry. Suitable for B.E./B.Tech final-year projects in IoT & Embedded Systems, Electronics and Computer Science.
Components & software requirements
- ESP32 firmware (door unit + stop display unit)
- IR break-beam sensor pairs
- GPS module (geofencing)
- P10 LED matrix display
- Cloud dashboard (fleet, routes, events)
- MQTT telemetry
- Git
Delivery information
Built-to-order project. Delivery timeline is shared after order confirmation based on current queue.
Support terms
Complete documentation, setup guide, and viva preparation included. Support for setup and explanation provided.