
More project photos (3)

The problem
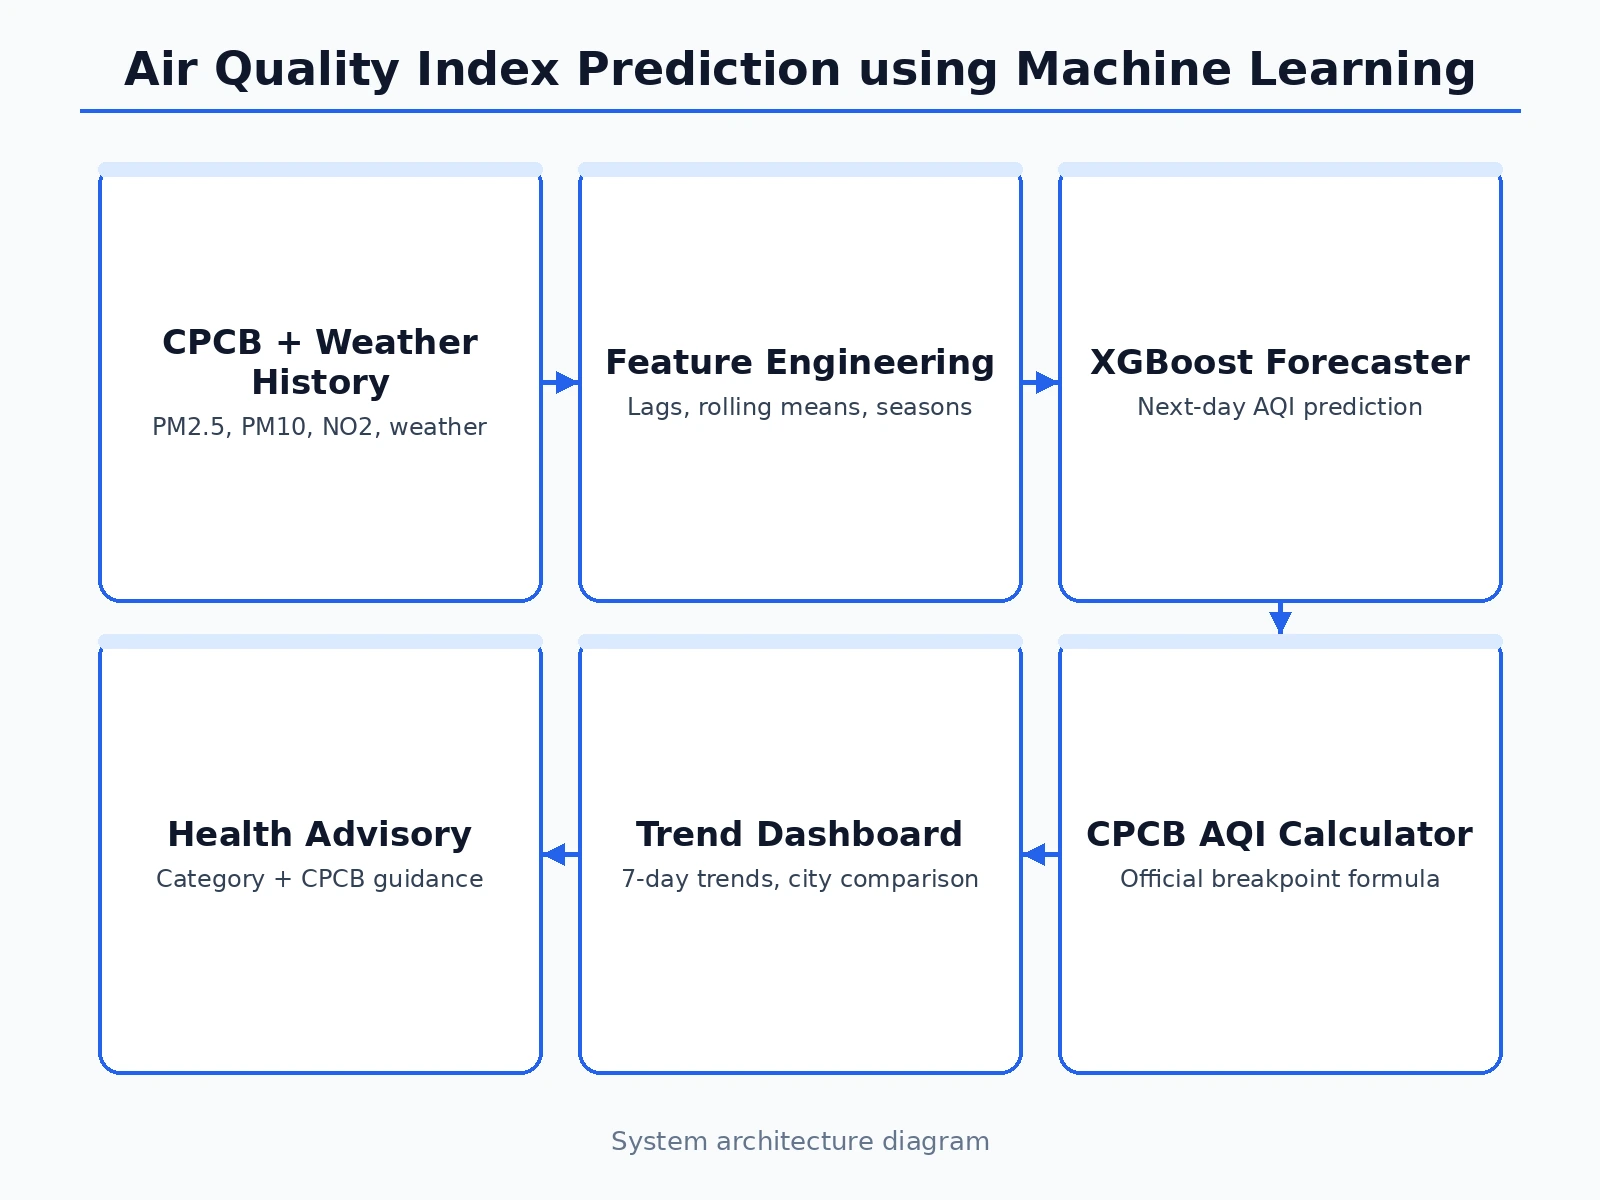
Air pollution kills an estimated 1.6 million Indians every year, and the Air Quality Index is how the public understands it — yet most students who attempt AQI projects compute today's index from a formula and call it prediction. The real engineering problem is forecasting: given pollutant history and weather, what will tomorrow's AQI be, so that authorities and citizens can act in advance? This project does both halves properly. First, a live calculator implements the official CPCB sub-index methodology exactly, so any pollutant reading converts to the correct AQI and category. Second, an XGBoost regressor trained on multi-year CPCB station history plus meteorological features forecasts next-day AQI, evaluated with time-series cross-validation against a persistence baseline. A trend dashboard makes the data tangible across cities and weeks.
Daily pollutant and weather readings.
Follow the working sequence
How it works
- Daily CPCB pollutant readings per station are collected and joined with IMD weather observations on date.
- Short sensor gaps (max 2 consecutive days) are interpolated; longer gaps are dropped; outliers clipped at the 99.5th percentile.
- Features are engineered: 1–3 day pollutant lags, 7-day rolling means, wind-direction encoding, seasonal and event flags.
- An XGBoost regressor is trained with time-series cross-validation (no shuffling across time); hyperparameters via randomized search.
- The model is evaluated on a held-out recent period: RMSE, MAE, R² and category accuracy, compared against the persistence baseline.
- In the web app, the calculator tab runs the official CPCB formula live for "what is AQI now"; the trained model answers "what will it be tomorrow".
Tech stack:
- Python 3, XGBoost, scikit-learn
- pandas, NumPy, Matplotlib
- Jupyter Notebook (training & evaluation)
- HTML/CSS/JavaScript (calculator + dashboard web app)
- CPCB historical data, IMD weather observations
Dataset & model details
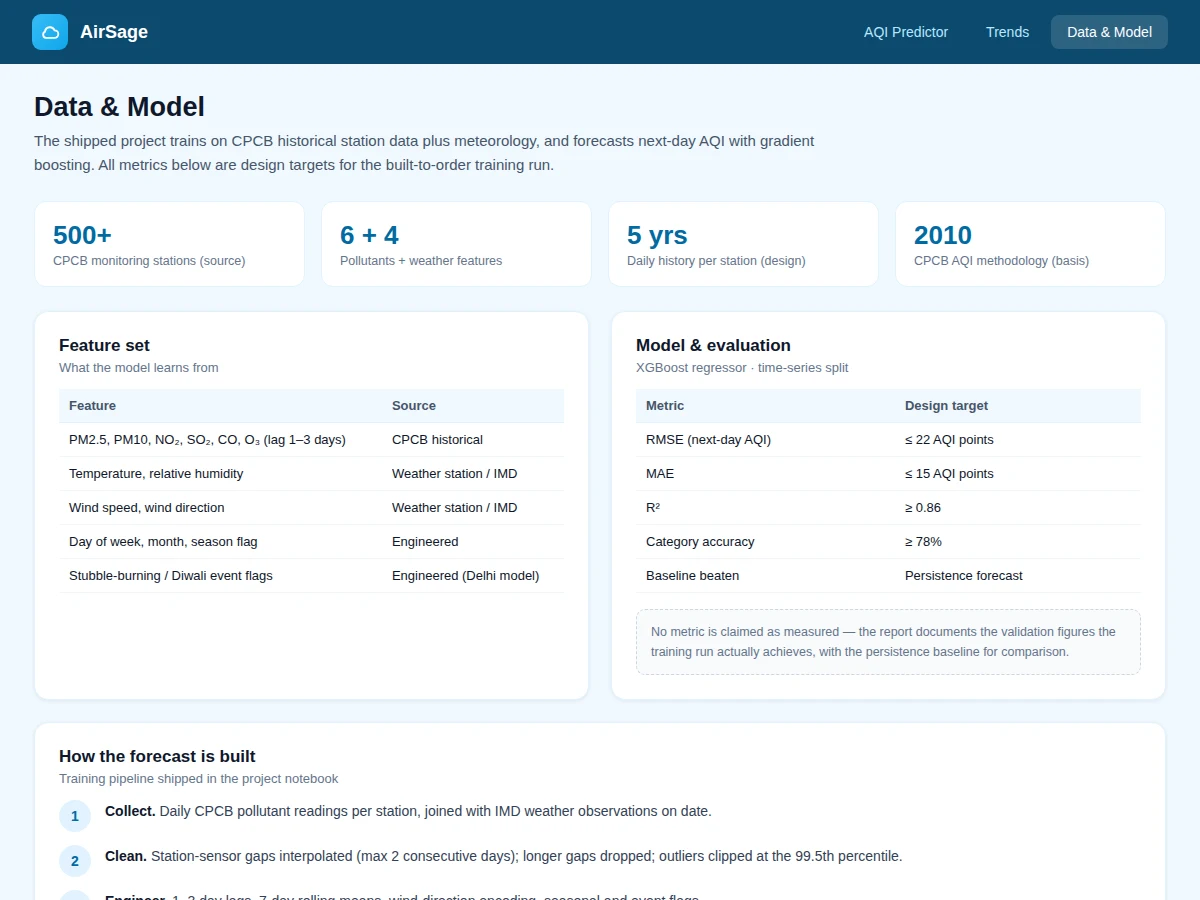
- Dataset: CPCB (Central Pollution Control Board) historical station data — 500+ monitoring stations, daily PM2.5, PM10, NO2, SO2, CO, O3 readings across ~5 years, joined with IMD temperature, humidity and wind observations.
- Task: Regression; input = 3-day pollutant lags + rolling means + weather + calendar/event features, output = next-day AQI (0–500 scale).
- Model: XGBoost regressor; time-series cross-validation; hyperparameters via randomized search; persistence-forecast baseline for comparison.
- Metrics: RMSE ≤ 22 AQI points, MAE ≤ 15, R² ≥ 0.86, category accuracy ≥ 78% — design targets for the built-to-order training run. No metric is claimed as measured until the run executes.
| Parameter | Value |
|---|---|
| Stations | 500+ CPCB monitoring stations (real public source) |
| Features | 6 pollutants (lagged) + 4 weather + calendar/event flags |
| Target | Next-day AQI, 0–500 scale |
| RMSE | ≤ 22 AQI points (design target, not a measured claim) |
| R² | ≥ 0.86 (design target) |
| Training time | Approximately 20–40 minutes on a laptop CPU (expected) |
| Inference | Under 100 ms per forecast (expected) |
| Demo | Single-file web app, runs offline after download |
Project features
- [Official CPCB AQI calculator] Live in-browser implementation of the CPCB sub-index breakpoint formula — enter pollutant readings, get the correct AQI, category and dominant pollutant.
- [Next-day AQI forecasting model] XGBoost regressor trained on CPCB history plus weather features, evaluated with time-series cross-validation.
- [Full training notebook] Data collection, gap interpolation, feature engineering (lags, rolling means, seasonal flags), training and baseline comparison in one reproducible notebook.
- [Trend dashboard] 7-day AQI trends, city comparisons and pollutant-contribution breakdowns rendered from realistic station data.
- [Honest baseline comparison] The model is scored against a persistence forecast, so the viva can discuss exactly how much the ML adds.
- [Health-advisory mapping] Each AQI category maps to the CPCB health advisory, shown alongside every prediction.
- [City presets] Realistic CPCB-style readings for 8 Indian cities pre-loaded in the calculator.
What is included
- Complete training & evaluation Jupyter notebook
- Trained XGBoost forecasting model with feature pipeline
- AQI calculator + trend dashboard web app (CPCB methodology)
- Baseline-comparison and feature-importance plots
- Project report PDF (background, AQI methodology, time-series evaluation, results)
- PPT presentation for final review
- Viva Q&A preparation document (AQI computation, gradient boosting, time-series validation, baselines)
Limitations & prerequisites
- All accuracy figures are design targets stated honestly; the report documents the actual achieved figures after the training run.
- Forecasts are only as good as station data quality — sensor outages and calibration drift affect real deployments.
- Extreme events (Diwali, dust storms, stubble burning) are partially covered by event flags but remain the hardest to predict.
- The model forecasts at station granularity; hyperlocal street-level variation is out of scope.
- Demo trend data is illustrative; the shipped project trains on real downloaded CPCB history.
Frequently Asked Questions
What data does the project use?
Historical daily readings from CPCB monitoring stations (PM2.5, PM10, NO2, SO2, CO, O3) joined with IMD weather data (temperature, humidity, wind). Both are real public sources; the notebook documents the download and cleaning steps.
How is AQI actually computed?
Per the official CPCB methodology: each pollutant maps to a sub-index via breakpoint interpolation, and the overall AQI is the maximum of the sub-indices. The calculator tab implements this exactly.
Why is time-series cross-validation needed?
Because shuffling would let the model "see the future" — training on January to predict last December. Time-based splits keep the evaluation honest, and the project compares against a persistence baseline (tomorrow = today).
What drives the forecast most?
Typically yesterday's PM2.5/PM10 levels, wind speed (dispersion) and seasonal flags — the feature-importance analysis in the report quantifies this per city.
Can it predict for my city?
Any city with CPCB station history can be modeled; the demo ships 8 city presets and the notebook documents adding a new station.
Is this project suitable for a final-year project?
Yes — for Computer Science, IT and AI/ML programs. It combines real public data, proper time-series methodology and a genuinely useful public-facing app. Suitable for B.E./B.Tech final-year projects in Computer Science, IT and AI & Machine Learning.
Components & software requirements
- Python 3, XGBoost, scikit-learn
- pandas, NumPy, Matplotlib
- Jupyter Notebook (training & evaluation)
- HTML/CSS/JavaScript (calculator + dashboard web app)
- CPCB historical data, IMD weather observations
Dataset & model details
- Dataset: CPCB (Central Pollution Control Board) historical station data — 500+ monitoring stations, daily PM2.5, PM10, NO2, SO2, CO, O3 readings across ~5 years, joined with IMD temperature, humidity and wind observations.
- Task: Regression; input = 3-day pollutant lags + rolling means + weather + calendar/event features, output = next-day AQI (0–500 scale).
- Model: XGBoost regressor; time-series cross-validation; hyperparameters via randomized search; persistence-forecast baseline for comparison.
- Metrics: RMSE ≤ 22 AQI points, MAE ≤ 15, R² ≥ 0.86, category accuracy ≥ 78% — design targets for the built-to-order training run. No metric is claimed as measured until the run executes.
Delivery information
Built-to-order project. Delivery timeline is shared after order confirmation based on current queue.
Support terms
Complete documentation, setup guide, and viva preparation included. Support for setup and explanation provided.
Download free synopsis (PDF)
Enter your name and WhatsApp number — the synopsis PDF downloads immediately. We may send occasional project updates on WhatsApp; no spam.