
More project photos (2)
The problem
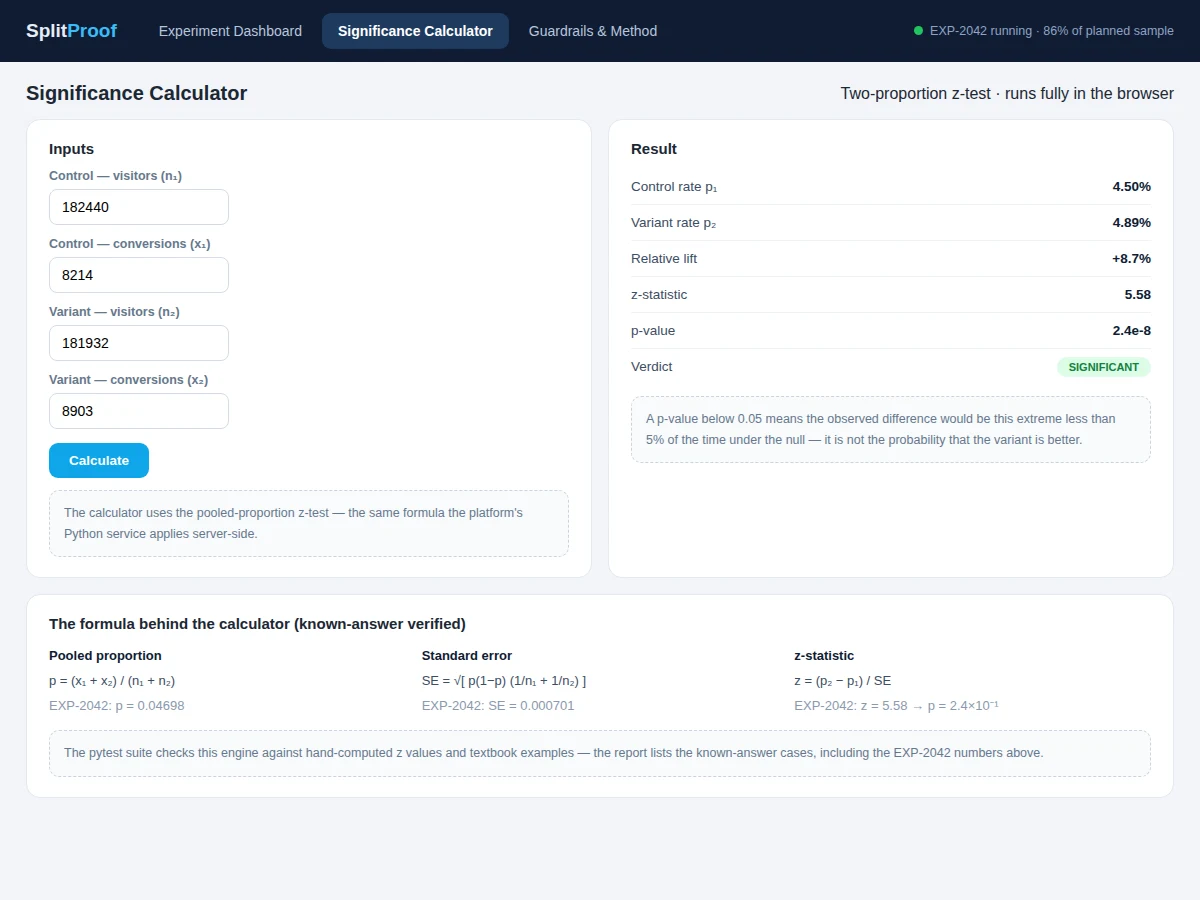
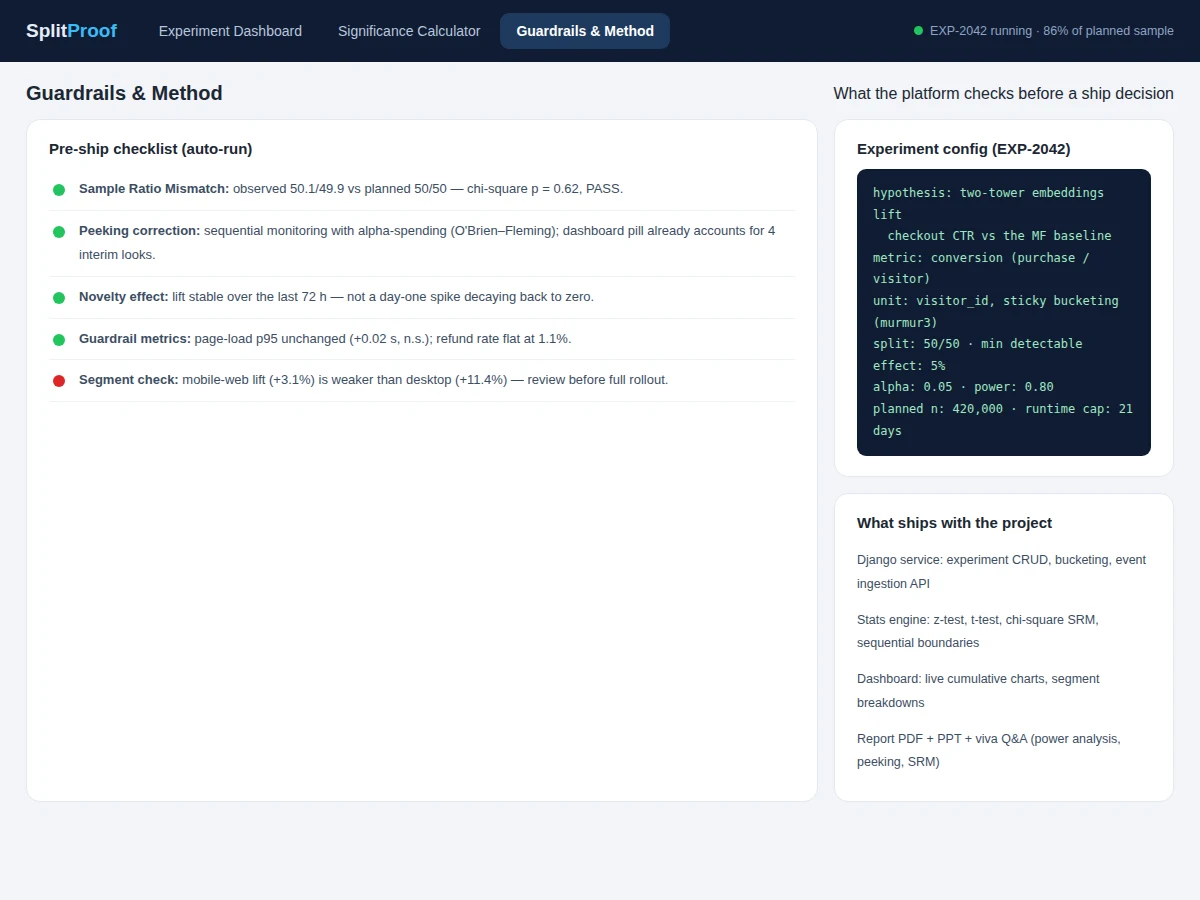
Every product team that ships machine-learning models faces the same question: is the new model actually better, or did the metric just wobble? Answering it correctly needs randomized experiments, correct statistics and the discipline not to peek at results until the sample is ready — and most student projects hand-wave all three. This project builds the real thing: a Django A/B testing platform with experiment lifecycle management, sticky visitor bucketing, event ingestion, a statistics engine (z-tests, t-tests, chi-square sample-ratio checks, sequential boundaries), a live dashboard with cumulative charts, and an automated pre-ship guardrail checklist. The demo walks through a realistic experiment — EXP-2042, a two-tower neural recommender against a matrix-factorization baseline — showing the dashboard, the browser-based significance calculator and the guardrail tab exactly as the platform renders them.
How it works
- The experimenter registers a hypothesis, primary metric, randomization unit and traffic split; the platform computes the required sample size from the minimum detectable effect, alpha and power.
- Incoming visitors are bucketed by a murmur3 hash of their visitor ID into control or variant, sticky across sessions.
- Impression and conversion events stream into the ingestion API; the dashboard aggregates them into cumulative conversion curves.
- The statistics engine runs the two-proportion z-test with pooled variance, reporting the p-value, the 95% confidence interval of the lift and achieved power.
- Sequential monitoring applies O'Brien–Fleming alpha-spending across interim looks, so the dashboard's significance pill already corrects for peeking.
- Before a ship decision, the guardrail suite checks sample-ratio mismatch, novelty decay, guardrail metrics and segment heterogeneity, and blocks the recommendation if any check fails.
Tech stack:
- Python 3.10, Django 4.2, Django REST Framework (experiment + event APIs)
- PostgreSQL (experiments, buckets, events); Redis (live counters)
- SciPy/NumPy statistics engine (z-test, t-test, chi-square SRM, sequential boundaries)
- HTML/CSS/JS dashboard (SVG cumulative charts, in-browser calculator)
- Single-file HTML/CSS/JS demo walkthrough mirroring the platform screens
- pytest suite for the statistics engine (known-answer z-tests, SRM detection)
| Parameter | Value |
|---|---|
| Backend | Django 4.2 + DRF, PostgreSQL, Redis counters |
| Randomization | Visitor-ID sticky bucketing (murmur3 hash) |
| Tests | Two-proportion z-test, t-test, chi-square SRM check |
| Sequential | O'Brien–Fleming alpha-spending boundaries |
| Demo experiment | EXP-2042: 364,372 visitors, +8.7% relative lift, p ≈ 6×10⁻⁸ |
| Calculator | In-browser z-test matching the server engine |
| Guardrails | SRM, novelty, latency/refund metrics, segment checks |
| Tests | pytest suite with known-answer statistical cases |
Project features
- [Experiment management] Create experiments with hypothesis, primary metric, unit of randomization, traffic split, minimum detectable effect and runtime cap.
- [Sticky bucketing] Visitors are bucketed by hashed ID so each user consistently sees the same variant across sessions.
- [Live dashboard] Cumulative conversion charts per variant, sample collection progress, and the statistical readout (z, p-value, confidence interval, power).
- [Significance calculator] Interactive two-proportion z-test that runs in the browser — the same formula as the server-side engine.
- [Sequential monitoring] Alpha-spending (O'Brien–Fleming) boundaries so interim looks don't inflate the false-positive rate.
- [Guardrail checks] Sample-ratio-mismatch chi-square, novelty-effect detection, guardrail metrics (latency, refund rate) and segment breakdowns.
- [Pre-ship checklist] Automated pass/fail list the platform runs before recommending a rollout — including the segment warning the demo surfaces.
- [Event ingestion API] REST endpoint for impression/conversion events with idempotency keys.
What is included
- Complete Django source code (experiment CRUD, bucketing, event ingestion, stats engine, dashboard)
- pytest test suite for the statistics engine and API permissions
- Project report PDF (experimentation background, statistical methods, system design, demo experiment analysis)
- PPT presentation for final review
- Viva Q&A preparation document (hypothesis testing, power analysis, peeking problem, SRM, sequential methods)
- Setup guide (environment, migrations, seed experiment data, running the demo)
Limitations & prerequisites
- The demo experiment's numbers illustrate the platform's output; they are sample data, not a claim about any real product.
- Sticky bucketing assumes a stable visitor ID — logged-out users who clear cookies can be re-bucketed, which the report discusses.
- The statistics engine covers proportion and mean metrics; survival/time-to-event metrics are out of scope.
- Guardrail checks are rules-based thresholds, not causal analyses — a failed segment check needs human investigation.
- Multi-armed bandit allocation is not included; the platform does fixed-horizon randomized experiments.
Frequently Asked Questions
What statistics does it implement?
Two-proportion z-tests with pooled variance, t-tests for continuous metrics, chi-square sample-ratio-mismatch checks, and O'Brien–Fleming sequential boundaries for interim looks.
How does it stop peeking from causing false positives?
The dashboard's significance pill uses alpha-spending across interim looks — early stopping boundaries are wider, so a green pill mid-experiment already accounts for the peeks.
What is a sample-ratio mismatch check?
It verifies the observed traffic split matches the planned split (chi-square test). A mismatch signals a bucketing or tracking bug that would invalidate the result.
Are the demo experiment results real?
They are realistic sample data illustrating the platform's output — the report and demo present them as such, not as measured product results.
What are the main limitations?
Sample (not real) demo data; cookie-clearing can re-bucket logged-out users; no time-to-event metrics; rules-based guardrails; no bandit allocation.
Is this project suitable for a final-year project?
Yes — for Computer Science, AI/ML and Data Science programs. It demonstrates full-stack development, applied statistics, experiment design and honest treatment of peeking and SRM pitfalls, all strong viva material. Suitable for B.E./B.Tech final-year projects in Computer Science, AI/ML and Data Science.
Components & software requirements
- Python 3.10, Django 4.2, Django REST Framework (experiment + event APIs)
- PostgreSQL (experiments, buckets, events); Redis (live counters)
- SciPy/NumPy statistics engine (z-test, t-test, chi-square SRM, sequential boundaries)
- HTML/CSS/JS dashboard (SVG cumulative charts, in-browser calculator)
- Single-file HTML/CSS/JS demo walkthrough mirroring the platform screens
- pytest suite for the statistics engine (known-answer z-tests, SRM detection)
Delivery information
Built-to-order project. Delivery timeline is shared after order confirmation based on current queue.
Support terms
Complete documentation, setup guide, and viva preparation included. Support for setup and explanation provided.