
More project photos (5)
The problem
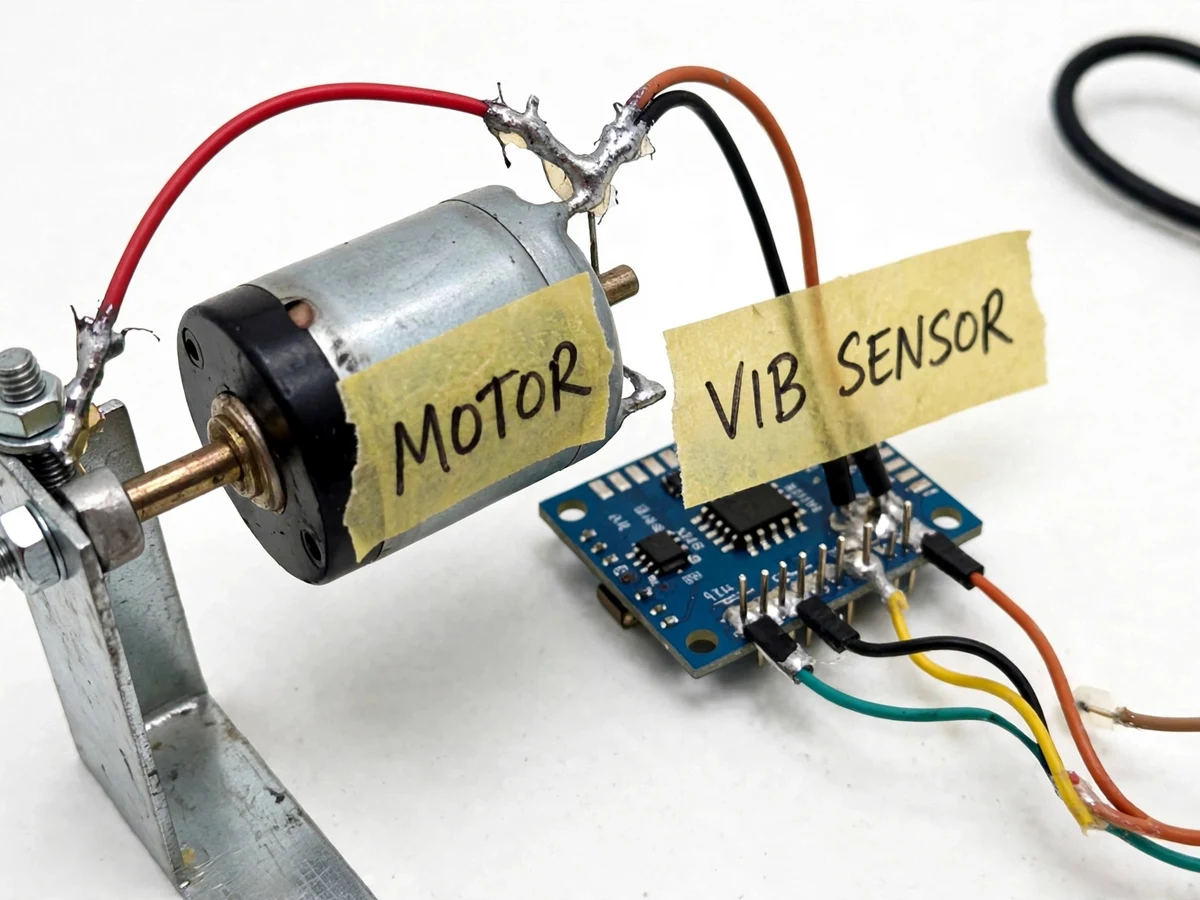
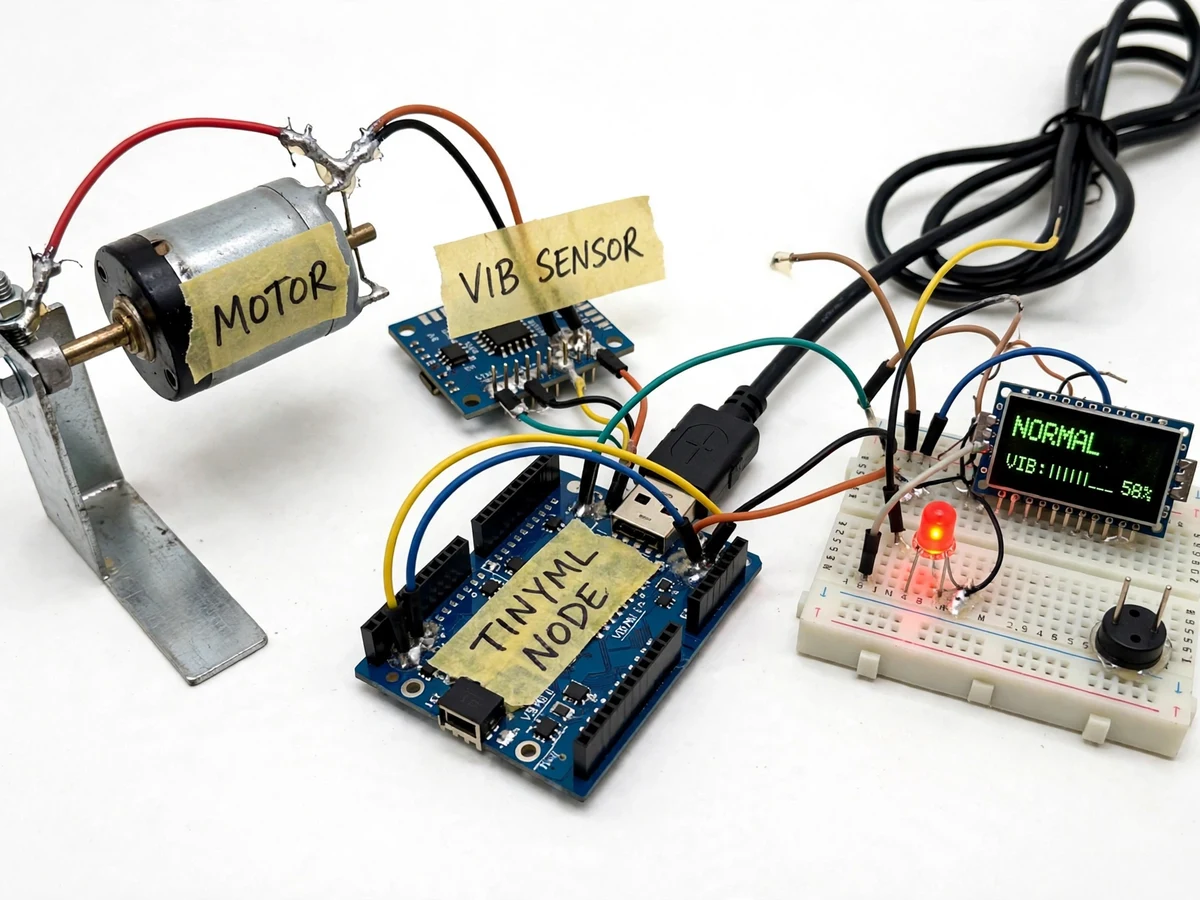
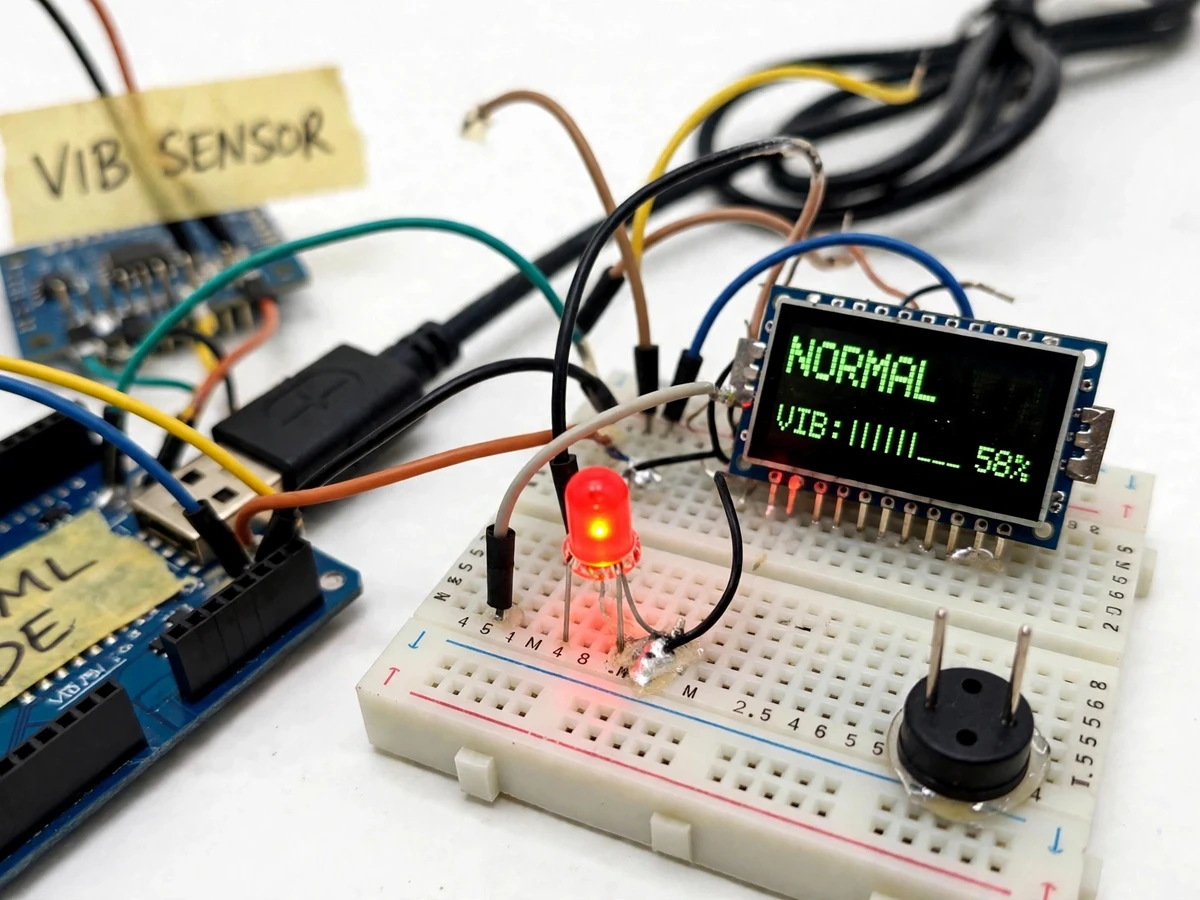
Bearing failures are the most common cause of unplanned motor downtime, and they announce themselves early: a healthy bearing produces a smooth, repeating vibration signature, while a damaged race or ball injects new frequency components into that signal. Industrial plants pay for dedicated condition-monitoring systems; this project brings the same principle down to a student-buildable scale using TinyML. An accelerometer bolted to a small DC motor streams vibration windows into a tiny neural network running on the microcontroller itself — inference happens at the edge, so detection works without Wi-Fi, without a server, and without data ever leaving the device. The network is trained on the well-documented Case Western Reserve University bearing dataset (real fault recordings, not synthetic waveforms), converted to an int8 TensorFlow Lite Micro model, and deployed to the board. On the demo rig, loosening a mount or adding an imbalance weight produces a fault signature the model flags with an LED, buzzer and OLED readout. Because the entire pipeline — data, features, quantization, deployment — stays visible, the student can defend every step in the viva.
How it works
- An accelerometer is rigidly mounted on the motor housing; firmware samples 3-axis acceleration at a configurable rate (design: ~1 kHz class) into fixed 1-second windows with overlap.
- Each window is preprocessed on-device: DC offset removal, then extraction of time-domain features (RMS, peak, crest factor) and frequency-band energies via FFT.
- The feature vector feeds a tiny 1D convolutional classifier converted to int8 TensorFlow Lite Micro, running entirely within the board's memory.
- The model scores every window as normal or fault; firmware applies a confirmation rule (several consecutive fault windows) before declaring a fault, rejecting single-window noise.
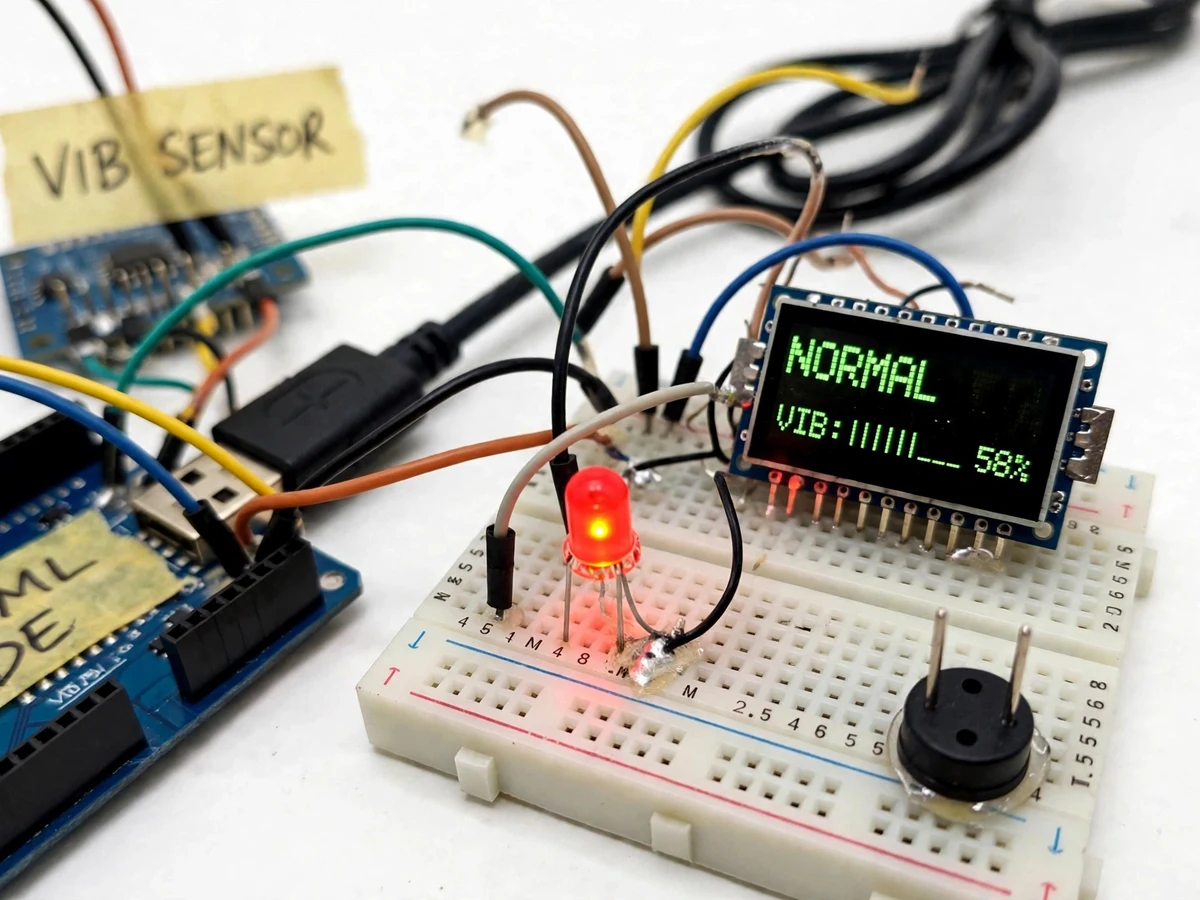
- On confirmed fault the board drives a red LED and buzzer and switches the OLED to FAULT with the confidence value; healthy windows keep the green NORMAL state.
- The model is trained offline on CWRU bearing recordings passed through the same windowing pipeline; the on-device demo is validated with the induced-fault procedure.
Tech stack:
- Arduino Nano 33 BLE Sense / ESP32 (microcontroller)
- ADXL345 / MPU6050 accelerometer (or onboard IMU)
- TensorFlow Lite Micro (int8 quantized inference)
- Python training pipeline (NumPy, TensorFlow)
- CWRU Bearing Dataset (training data)
- 0.96-inch OLED display, buzzer, status LEDs
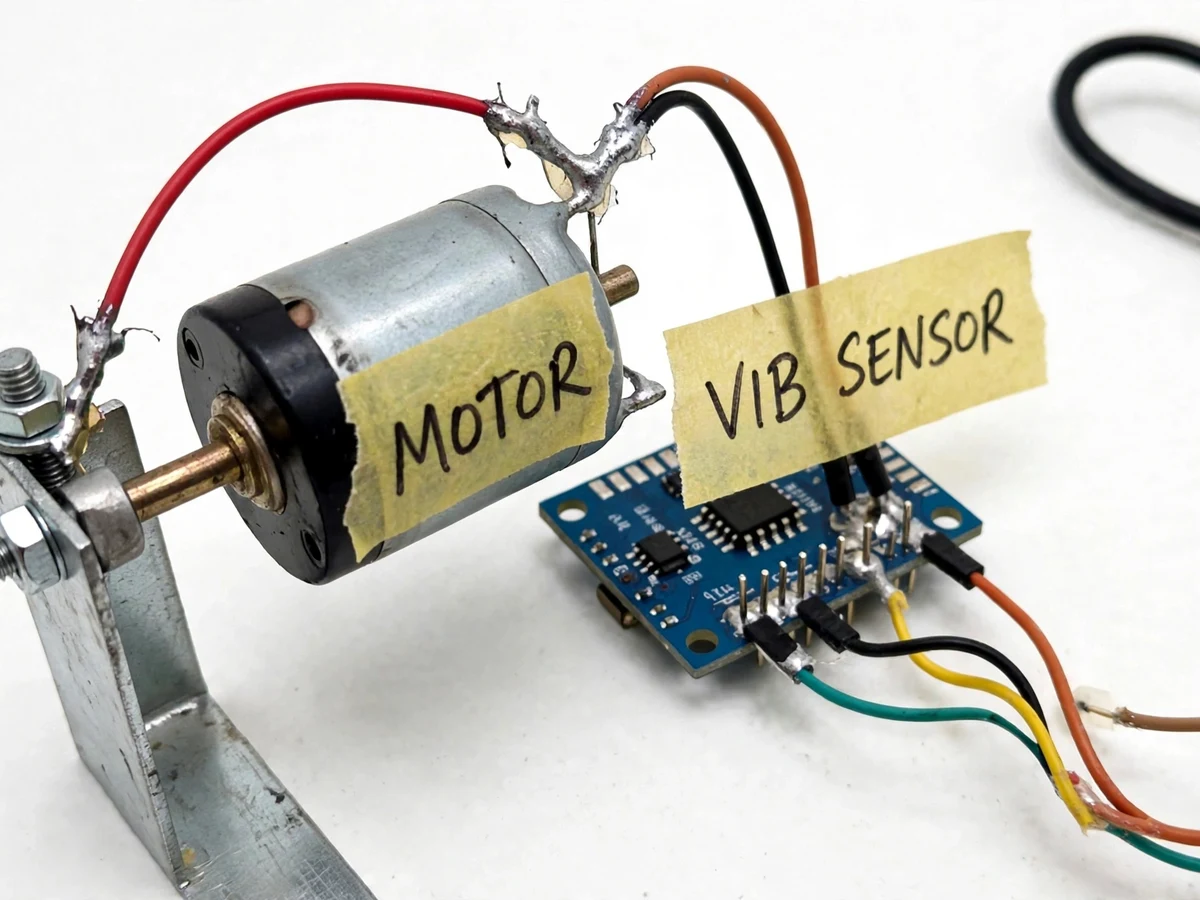
- DC motor demo rig with mounting hardware
- Arduino IDE / PlatformIO (C/C++ firmware)
Dataset & model details
- Dataset: Case Western Reserve University Bearing Data Center dataset — real accelerometer recordings of drive-end and fan-end bearings at 12 kHz and 48 kHz sample rates; classes: normal plus inner-race, outer-race and ball faults at multiple fault diameters and motor loads. Public research dataset from the CWRU Bearing Data Center.
- Task: Windowed vibration classification — input = 1-second acceleration window (or its extracted feature vector), output = normal vs fault probability.
- Model: Compact 1D convolutional network (design target ~20k–60k parameters), trained offline in Python, post-training quantized to int8 and deployed with TensorFlow Lite Micro. On-device feature stage: RMS, crest factor and FFT band energies.
- Metrics: Per-class precision/recall/F1 on held-out recording windows; validation accuracy is a design target (≥90% on the CWRU fault split) reported from the actual training run in the delivered report — never claimed as a measured figure in advance. On-device demo performance is characterized by the student's own induced-fault test procedure.
| Parameter | Value |
|---|---|
| Sampling rate | Up to ~1 kHz, configurable (design) |
| Analysis window | 1 s windows with 50% overlap (design) |
| Model size | Under ~100 KB flash after int8 quantization (design target) |
| Inference latency | Tens of milliseconds per window on-device (expected) |
| Fault classes | Normal, inner-race, outer-race, ball |
| Alert outputs | LED + buzzer + OLED status |
| Power | 5 V USB or battery pack |
| Demo rig | Small DC motor with mount and imbalance weights |
Project features
- [On-device anomaly detection] Vibration windows are classified by a quantized neural network running on the microcontroller itself — detection works with no internet, no gateway and no cloud round-trip.
- [Real bearing-fault training data] The model is trained on the Case Western Reserve University bearing dataset: real accelerometer recordings of healthy and faulty bearings (inner-race, outer-race and ball faults), not synthetic waveforms.
- [int8 quantization for microcontrollers] The network is quantized to 8-bit integers with TensorFlow Lite Micro, fitting inference into the tight RAM and flash budget of a typical dev board with latency in the tens of milliseconds.
- [Induced-fault demo rig] The student validates detection on their own build by inducing controlled faults — a loosened mount bolt, an added imbalance weight — following the included buyer-run test procedure.
- [Live status display] An OLED shows the current vibration level, the model confidence and NORMAL / FAULT status; a buzzer and LED give instant local alerts.
- [Documented feature pipeline] Raw acceleration is windowed and converted to time and frequency features (RMS, crest factor, spectral band energies) before inference — the report explains why each feature matters.
- [Reproducible training workflow] Data preparation, training and quantization follow a documented notebook pipeline the student can rerun, tweak and explain.
What is included
- Assembled vibration sensing node (microcontroller + accelerometer + OLED + buzzer)
- Motor demo rig with mounting bracket and imbalance weights
- Trained int8 TinyML model and the training notebook (CWRU pipeline)
- Firmware source with feature extraction and inference code
- Wiring diagram and buyer-run test/calibration procedure
- Project report PDF (theory, dataset, model, quantization, results)
- PPT presentation and viva Q&A document
Limitations & prerequisites
- The CWRU recordings were made on laboratory bearings at high sample rates; the student's low-cost accelerometer and lower sampling rate capture coarser signatures, so transfer to the demo rig is approximate, not guaranteed.
- Detection is demonstrated with induced imbalance and mount faults; real progressive bearing wear over weeks is not replicated in the demo.
- Accuracy figures are design targets from the training run, reported honestly after training — nothing is claimed as measured before the build.
- Strong ambient vibration (a shaking bench, nearby machinery) raises the noise floor and can cause false positives.
- The model classifies current vibration as normal or faulty; it does not estimate remaining useful life.
- On-device training is not supported — the model is trained offline and deployed frozen.
Frequently Asked Questions
What is TinyML and why use it here?
TinyML means running machine-learning models on microcontrollers with kilobytes of memory. It matters here because vibration monitoring must work at the machine — no Wi-Fi dependency, no latency, no data leaving the device. The project demonstrates the full path: train on real data, quantize, deploy.
Is the CWRU dataset real?
Yes — it is the Case Western Reserve University Bearing Data Center's public research dataset, the most-cited benchmark in bearing-fault diagnosis, with real accelerometer recordings of seeded bearing faults at documented loads and speeds.
How is the model tested on the student's own rig?
The kit includes a buyer-run test procedure: record baseline vibration, then induce controlled faults (loosen a mount bolt, add an imbalance weight) and log the model's fault flags. The report template has tables for the student's own results.
Why quantize to int8?
A microcontroller has roughly 256 KB of RAM — a float32 model may not fit or may run too slowly. int8 quantization shrinks the model about 4x and speeds inference, with a small documented accuracy tradeoff that the report discusses.
Can it predict when the bearing will fail?
No — it classifies current vibration as normal or faulty. Remaining-useful-life prediction needs run-to-failure data and a different model; it is listed as future scope.
Is this project suitable for a final-year project?
Yes — for AI & Machine Learning, Electronics and IoT programs. It combines signal processing, deep learning, quantization and embedded deployment into one defensible build. Suitable for B.E./B.Tech final-year projects in AI & Machine Learning, Electronics / E&TC and IoT & Embedded.
Components & software requirements
- Arduino Nano 33 BLE Sense / ESP32 (microcontroller)
- ADXL345 / MPU6050 accelerometer (or onboard IMU)
- TensorFlow Lite Micro (int8 quantized inference)
- Python training pipeline (NumPy, TensorFlow)
- CWRU Bearing Dataset (training data)
- 0.96-inch OLED display, buzzer, status LEDs
- DC motor demo rig with mounting hardware
- Arduino IDE / PlatformIO (C/C++ firmware)
Dataset & model details
- Dataset: Case Western Reserve University Bearing Data Center dataset — real accelerometer recordings of drive-end and fan-end bearings at 12 kHz and 48 kHz sample rates; classes: normal plus inner-race, outer-race and ball faults at multiple fault diameters and motor loads. Public research dataset from the CWRU Bearing Data Center.
- Task: Windowed vibration classification — input = 1-second acceleration window (or its extracted feature vector), output = normal vs fault probability.
- Model: Compact 1D convolutional network (design target ~20k–60k parameters), trained offline in Python, post-training quantized to int8 and deployed with TensorFlow Lite Micro. On-device feature stage: RMS, crest factor and FFT band energies.
- Metrics: Per-class precision/recall/F1 on held-out recording windows; validation accuracy is a design target (≥90% on the CWRU fault split) reported from the actual training run in the delivered report — never claimed as a measured figure in advance. On-device demo performance is characterized by the student's own induced-fault test procedure.
Delivery information
Built-to-order project. Delivery timeline is shared after order confirmation based on current queue.
Support terms
Complete documentation, setup guide, and viva preparation included. Support for setup and explanation provided.