
More project photos (3)
The problem
Smart buildings save energy by knowing whether rooms are occupied — HVAC and lighting follow people, not schedules. But cameras are intrusive and PIR sensors miss still occupants; environmental sensors (temperature, humidity, light, CO2) already present in HVAC systems carry the same signal passively. The UCI Occupancy Detection dataset (Candanedo & Feldheim) is the standard benchmark: minute-by-minute readings from an office, labeled occupied or not. This project trains and compares classifiers on the full dataset, and makes the learning tangible with a live demo — a logistic-regression model is actually fitted in your browser by gradient descent on genuine UCI measurements, and its predictions, learned weights and held-out metrics are all shown live. Because the demo trains for real and labels every figure as measured or design target, the student can defend the whole pipeline in the viva.
20,560 training rows, sensor features.
Follow the working sequence
How it works
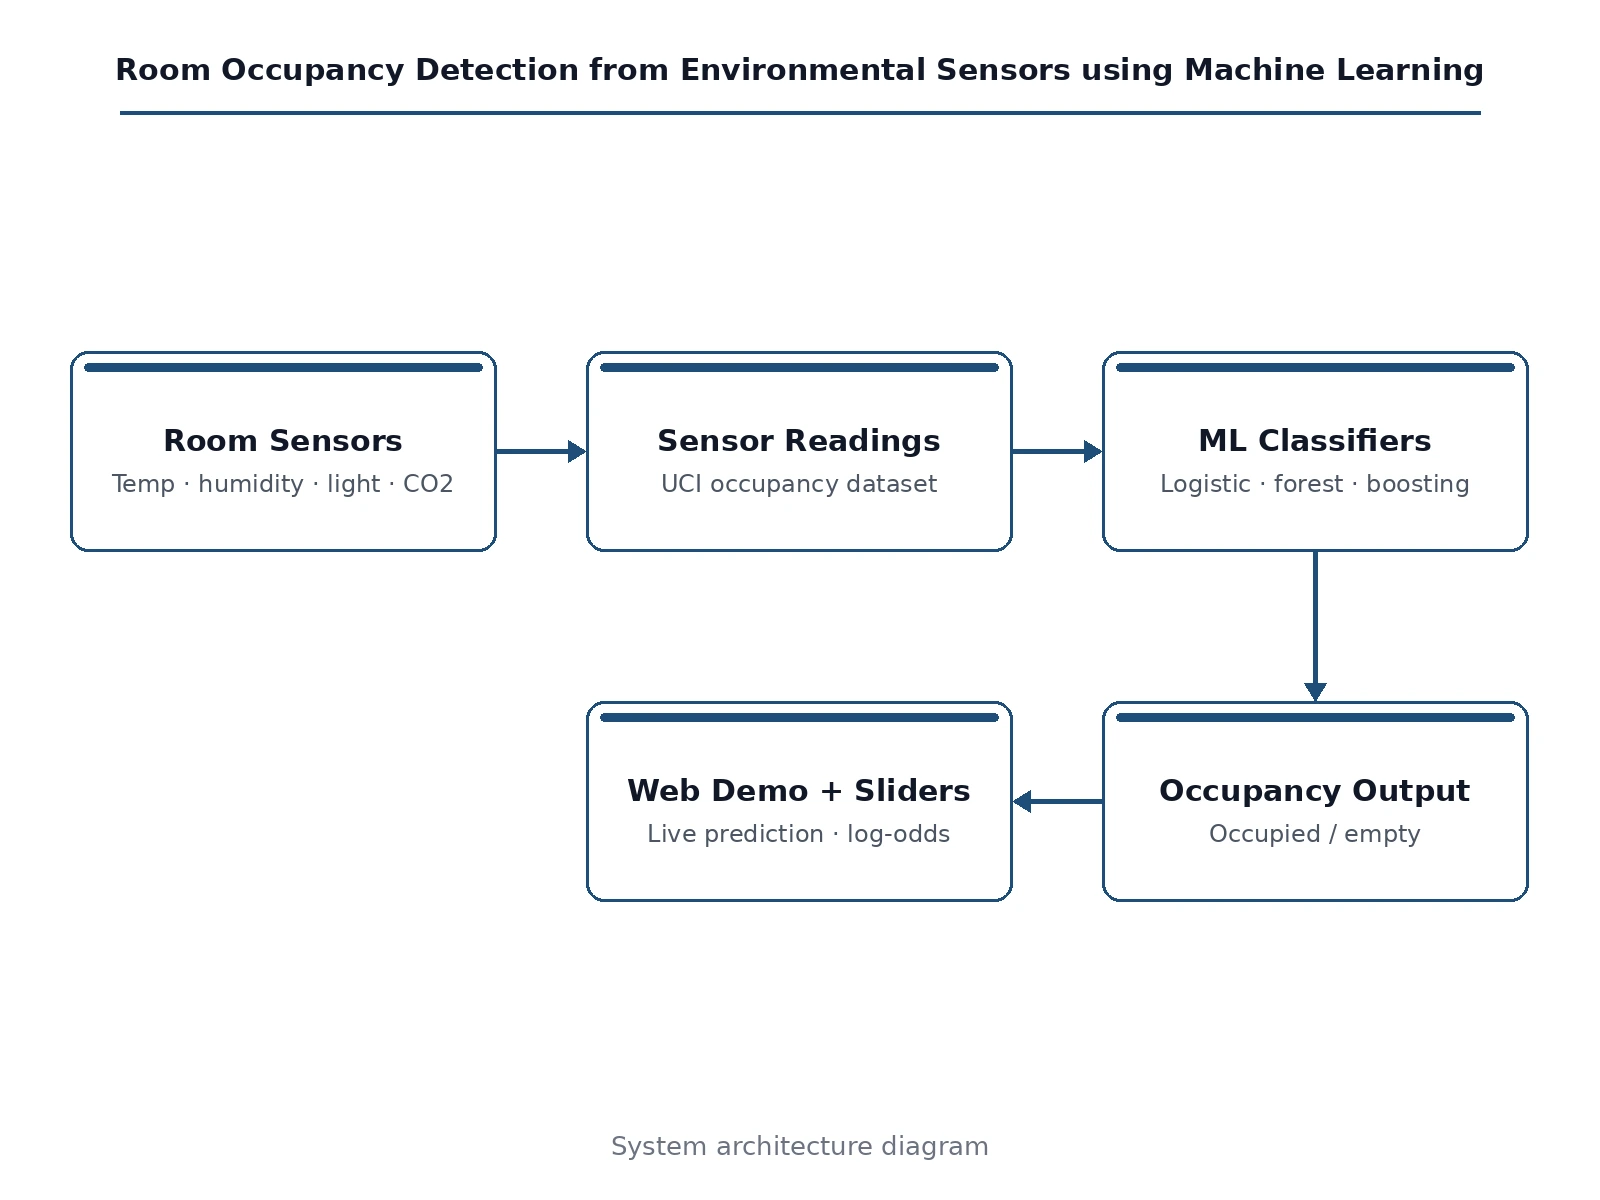
- UCI occupancy data is loaded (date, temperature, humidity, light, CO2, humidity ratio, occupancy label); features are standardized and the train/test split follows the dataset's own files.
- Logistic regression is trained by gradient descent, random forest and gradient boosting by their standard fitting procedures — all in one reproducible notebook.
- The held-out test set is evaluated once: accuracy, precision, recall, F1, ROC-AUC and the confusion matrix are generated for each model.
- In the web demo, a logistic-regression model is fitted live in the browser on an embedded UCI sample (204 rows, 300 epochs), with the loss curve drawn as it trains.
- Slider readings are standardized with the training statistics, dotted with the learned weights, and passed through the sigmoid to give P(occupied | sensors).
- The demo's measured metrics come from the embedded held-out sample (267 rows); the built-to-order report carries the full-dataset evaluation.
Tech stack:
- Python 3, scikit-learn (logistic regression, RF, GBM)
- NumPy, pandas, Matplotlib (metrics & plots)
- Jupyter Notebook (training & evaluation)
- HTML5 + JavaScript (live in-browser training demo)
- UCI Occupancy Detection dataset
Dataset & model details
- Dataset: UCI Occupancy Detection (Candanedo & Feldheim) — 20,560 training rows and 2,665 test rows of minute-level office sensor data. Features: temperature, relative humidity, light, CO2, humidity ratio. Label: room occupied or not.
- Task: Binary classification; input = 5-D environmental sensor vector, output = P(occupied | sensors).
- Model: Demo: logistic regression trained by gradient descent (300 epochs) in the browser. Built-to-order: logistic regression, random forest and gradient boosting trained on the full dataset and compared.
- Metrics: Demo (measured live on the embedded 267-row held-out sample): accuracy 97.4%, precision 93.3%, recall 100.0%, confusion TP 97 · TN 163 · FP 7 · FN 0. Built-to-order evaluation on the full test set reports accuracy, precision, recall, F1 and ROC-AUC per model. Full-dataset figures are design targets until the training run executes for the order.
| Parameter | Value |
|---|---|
| Input format | 5-D sensor vector (temp, humidity, light, CO2, humidity ratio) |
| Dataset | UCI Occupancy: 20,560 train / 2,665 test rows |
| Demo metrics (measured) | Accuracy 97.4%, precision 93.3%, recall 100.0% on 267 held-out rows |
| Demo training | 204 rows, 300 epochs gradient descent, in-browser |
| Built-to-order models | Logistic regression, random forest, gradient boosting |
| Key predictors | Light (+3.18) and CO2 (+1.70) dominate (learned weights) |
| Demo | Single-file web app; model trains live on page load |
Project features
- [Real in-browser training demo] A logistic-regression model is fitted live by gradient descent (300 epochs) on 204 genuine UCI training rows — the loss curve, learned weights and held-out metrics are computed in your session, not canned.
- [Live occupancy predictor] Move temperature, humidity, light, CO2 and humidity-ratio sliders; the probability comes from the fitted weights, with per-feature log-odds contributions shown.
- [Measured held-out metrics] Accuracy 97.4%, precision 93.3%, recall 100.0% on 267 held-out rows with the full confusion matrix — genuinely measured on the embedded sample in the demo.
- [Full-dataset training notebook] Logistic regression, random forest and gradient boosting trained and compared on all 20,560 UCI training rows with a reproducible evaluation on the 2,665-row test set.
- [Feature-importance analysis] The learned weights show light and CO2 dominating the decision — exactly what the occupancy literature reports — with the analysis documented.
- [Model comparison] The three classifiers compared on accuracy, precision, recall, F1 and ROC-AUC, with the tradeoffs (interpretability vs accuracy) discussed for the viva.
- [Occupancy presets] One-click occupied-room and empty-room sensor presets demonstrating how the model's decision boundary behaves.
What is included
- Complete training & evaluation Jupyter notebook on the full UCI dataset
- Trained classifier models with preprocessing and inference code
- Live in-browser training + predictor + model lab web demo
- Confusion matrices, ROC curves and model-comparison tables
- Project report PDF (sensor-fusion background, model theory, methodology, results)
- PPT presentation for final review
- Viva Q&A preparation document (logistic regression, gradient descent, precision vs recall, sensor fusion, occupancy literature)
Limitations & prerequisites
- The demo trains on a 204-row embedded sample for speed; the built-to-order models train on the full 20,560-row dataset — the report states which figures come from which.
- The demo's 97.4% accuracy is genuinely measured on its embedded sample but is a small-sample figure; full-dataset performance is reported after the order's training run.
- The dataset is one office over a few days — different buildings, climates and ventilation change the feature distributions; the report states this generalization limit.
- CO2 rises slowly, so occupancy onset lags in CO2-only reasoning; light dominates when available — the limitation is discussed honestly in the report.
- Sensor drift and calibration over months are out of scope; the project assumes calibrated readings.
Frequently Asked Questions
Which sensors are used and why?
Temperature, relative humidity, light, CO2 and humidity ratio — all standard in modern HVAC systems. Occupants raise CO2 and humidity, switch on lights and warm the room, so the fusion of these signals detects presence without cameras.
What is the UCI Occupancy Detection dataset?
A public benchmark from Candanedo & Feldheim: minute-by-minute sensor readings from an office, 20,560 training rows and 2,665 test rows, each labeled occupied or not. It is the standard dataset for this task.
Does the demo really train a model?
Yes — when the page loads, logistic regression is fitted by gradient descent (300 epochs) on 204 genuine UCI training rows inside your browser. The loss curve, learned weights and held-out metrics are computed live in your session.
Which features matter most?
Light and CO2 — the learned weights (+3.18 for light, +1.70 for CO2) match the published literature. The demo shows each feature's log-odds contribution for your slider settings.
Why compare three models?
Logistic regression is interpretable (you can read the weights), while random forest and gradient boosting usually score higher. The comparison lets the viva discuss the interpretability–accuracy tradeoff with real numbers.
Is this project suitable for a final-year project?
Yes — for AI/ML, IoT and Computer Science programs. It demonstrates real model training, honest evaluation, sensor fusion and a live interactive demo. Suitable for B.E./B.Tech final-year projects in AI & Machine Learning, IoT and Computer Science.
Components & software requirements
- Python 3, scikit-learn (logistic regression, RF, GBM)
- NumPy, pandas, Matplotlib (metrics & plots)
- Jupyter Notebook (training & evaluation)
- HTML5 + JavaScript (live in-browser training demo)
- UCI Occupancy Detection dataset
Dataset & model details
- Dataset: UCI Occupancy Detection (Candanedo & Feldheim) — 20,560 training rows and 2,665 test rows of minute-level office sensor data. Features: temperature, relative humidity, light, CO2, humidity ratio. Label: room occupied or not.
- Task: Binary classification; input = 5-D environmental sensor vector, output = P(occupied | sensors).
- Model: Demo: logistic regression trained by gradient descent (300 epochs) in the browser. Built-to-order: logistic regression, random forest and gradient boosting trained on the full dataset and compared.
- Metrics: Demo (measured live on the embedded 267-row held-out sample): accuracy 97.4%, precision 93.3%, recall 100.0%, confusion TP 97 · TN 163 · FP 7 · FN 0. Built-to-order evaluation on the full test set reports accuracy, precision, recall, F1 and ROC-AUC per model. Full-dataset figures are design targets until the training run executes for the order.
Delivery information
Built-to-order project. Delivery timeline is shared after order confirmation based on current queue.
Support terms
Complete documentation, setup guide, and viva preparation included. Support for setup and explanation provided.
Download free synopsis (PDF)
Enter your name and WhatsApp number — the synopsis PDF downloads immediately. We may send occasional project updates on WhatsApp; no spam.