
More project photos (2)
The problem
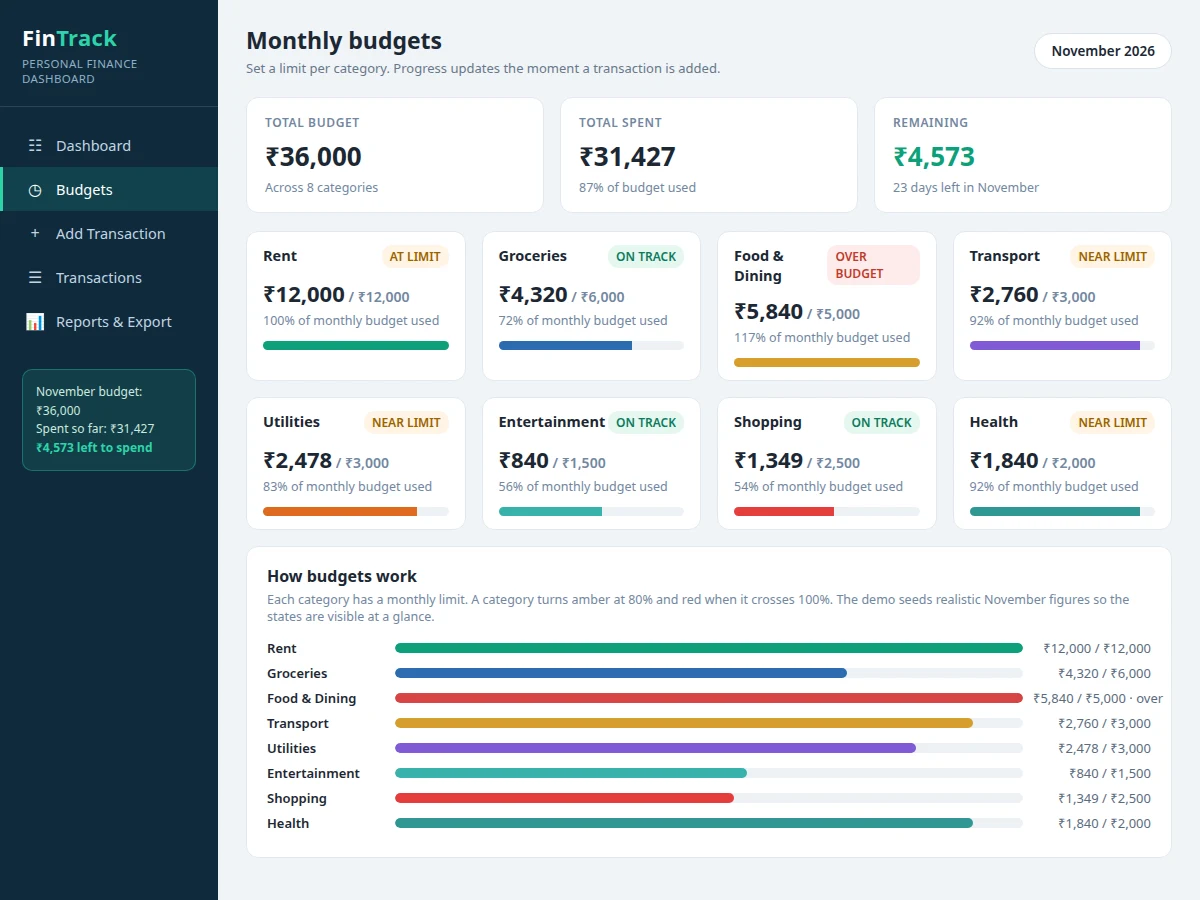
Most students and young earners know their salary figure but cannot say where it went by the third week of the month. A personal finance dashboard web app with budget tracking and expense charts answers that question by turning scattered spending into one visible picture: every expense is recorded, filed under a category, and compared against a monthly budget. The problem is not a lack of money but a lack of visibility — cash, UPI and card payments leave no single record, so small daily spends on food delivery, transport and shopping add up unnoticed until the account is low. This dashboard keeps the workflow small enough to sustain: type an expense in seconds or import a CSV statement, see the category bar move, and check the month's charts before spending more. The working demo built for this listing ships with 31 seeded November transactions across 8 categories, totalling ₹31,427 of spending against a ₹36,000 budget.
Adds an expense or imports a CSV statement, then checks budgets and charts.
Follow the working sequence
How it works
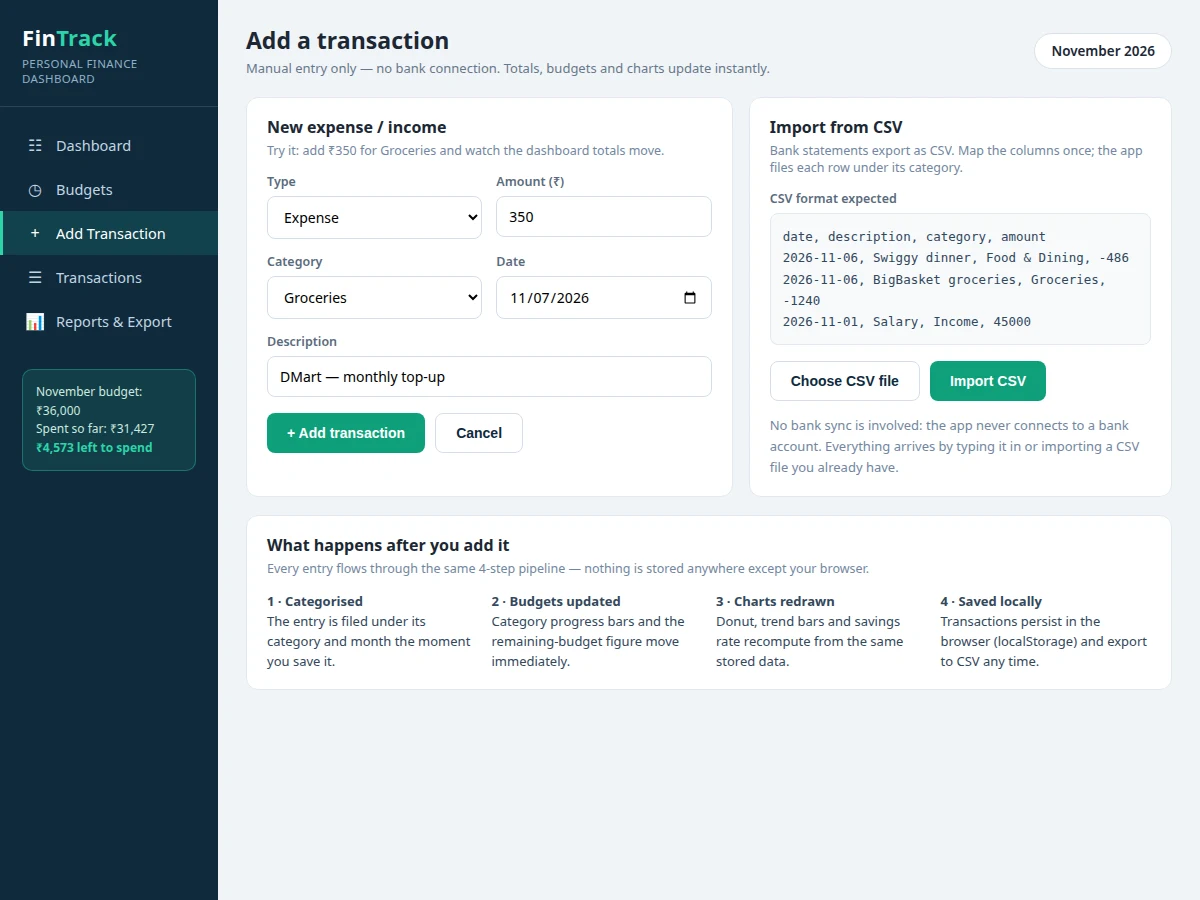
An entry travels from the form to the charts in four stages with no server in between. First, the user types an expense or imports a CSV file, and the app files it under one of 8 categories with its date and amount. Second, the entry is added to that category's monthly total and compared with the category budget, so the progress bar and the remaining-budget figure move at once. Third, the same stored transactions feed both charts — the donut recomputes each category's share of the month's spending and the trend chart adds the month to a six-month series — and the summary recalculates the savings rate and average daily spend. Finally, everything is written to the browser's local storage, so the dashboard survives a reload, and the full month exports to CSV whenever a report is needed. Because the data never leaves the browser, there is no login, no sync delay and no bank connection to configure.
- The user adds an expense or income manually through the form, or imports a CSV file in the documented date, description, category, amount format.
- The app validates the entry and files it under one of the 8 categories for the selected month.
- The category total is updated and compared with that category's monthly budget; progress bars and alerts change immediately.
- Both charts redraw from the same stored transactions — the donut by category share and the trend chart by monthly total.
- The monthly summary recomputes the savings rate, biggest category, top merchant and average daily spend.
- The entry is saved to localStorage, and the month's transactions can be exported to CSV at any time.
Tech stack:
- HTML5, CSS3 (dashboard layout & styling)
- JavaScript (ES6, application logic)
- Canvas API (donut & trend charts)
- localStorage API (browser persistence)
- CSV import & export
- Git (version control)
| Parameter | Value |
|---|---|
| Categories | 8 default categories (design target) |
| Budget period | 1 calendar month per category |
| Seeded demo data | 31 transactions across 8 categories (demo build) |
| Demo spending (November) | ₹31,427 across 31 transactions (demo data) |
| Demo monthly budget | ₹36,000 across 8 categories (demo data) |
| Demo savings rate | 35.2% for November (demo data) |
| Charts | 2 chart types: donut by category + 6-month trend (design target) |
| Storage | Browser localStorage, approximately 5 MB limit (browser-dependent) |
| Data entry | Manual entry + CSV import; no bank sync |
| Export | CSV file, 1 file per month |
| Chart redraw | Design target: under 1 second after an entry |
| Runs on | Any modern browser, no server required |
Project features
The dashboard is built around four capabilities that work together: fast manual entry and CSV import, monthly budgets per category, charts that show where money actually goes, and a monthly summary that closes the loop. Adding a transaction takes seconds — amount, category, date and a short description — and the totals, budget bars and charts update immediately without a page reload. Each of the 8 default categories (Rent, Groceries, Food & Dining, Transport, Utilities, Entertainment, Shopping and Health) carries its own monthly limit, with amber warnings at 80% and a red flag once the limit is crossed. Two canvas charts sit at the centre of the dashboard: a donut of spending by category and a six-month trend of total spending against the monthly budget. The monthly summary pulls it together with the savings rate, the biggest category, the top merchant and an average daily spend figure, and every transaction exports to CSV for a report or a viva demonstration.
- [Manual expense & income entry] Add any transaction in seconds — amount, category, date and description — and the totals, budget bars and charts update immediately without a page reload.
- [Category budgets with progress & alerts] Each of the 8 default categories carries a monthly limit; progress bars turn amber at 80% of the budget and red once the limit is crossed, with a plain-language alert on the dashboard.
- [Spending charts] A donut chart shows the month's spending by category and a six-month bar chart tracks total spending against the monthly budget, both drawn on canvas from the same stored transactions.
- [CSV import & export] Import a bank statement as CSV using the documented 4-column format, and export any month's transactions to CSV for records or a viva report.
- [Monthly summary & insights] The summary reports the savings rate, the biggest spending category, the top merchant and the average daily spend for the month, all computed from the entered data.
- [Search, filter & transaction history] The full transaction list can be browsed newest-first by date and category, so any single payment can be found and checked against its budget.
- [Local persistence, no server] All data is stored in the browser's localStorage, so the dashboard survives a reload, works offline, and needs no account, login or server to run.
What is included
- Complete single-file dashboard web app (HTML, CSS, JavaScript)
- Seeded demo data: 31 realistic November transactions across 8 categories
- CSV import template and one-click monthly CSV export
- Project report PDF (background, methodology, architecture, outcomes)
- PPT presentation for final review
- Viva Q&A preparation document (budgets, charts, localStorage, CSV handling)
- Setup instructions — open the file in any modern browser, no server or installation needed
Limitations & prerequisites
- No bank sync or live account connection — data arrives only by manual entry or CSV import.
- Data lives in the browser's localStorage (approximately 5 MB limit, browser-dependent); clearing browser data removes it unless it has been exported to CSV.
- Single-user by design — no login, no multi-user accounts and no cloud sync.
- Budgets are monthly and per category only; weekly budgets and shared household budgets are not included.
- CSV import expects the documented 4-column format (date, description, category, amount); other bank formats need their columns mapped first.
- Charts cover the current month and a 6-month trend; longer history views are future scope.
- Demo figures (₹31,427 spending, 35.2% savings rate) describe the seeded November data, not measured results from a real user.
Timeline
- Week 1: requirements, category and budget design, dashboard layout.
- Week 2: transaction entry, localStorage persistence and CSV import/export.
- Week 3: budget tracking, charts and monthly summary.
- Week 4: testing with the seeded data, report, PPT and viva preparation.
Support
- Setup guidance for running the dashboard in any modern browser, with no server or installation.
- Demonstration guidance for the viva, including the seeded November data walkthrough.
- Customization support for extra categories, budget periods or report formats, quoted separately.
Frequently Asked Questions
Is this project suitable for a final-year project?
Yes — for Computer Science, IT and Web Development programmes. It demonstrates front-end development, data handling, browser storage, chart rendering and file import/export in one complete product, and the viva can walk through a real working dashboard with realistic data instead of slides alone. The report documents the architecture, the budget-comparison logic and the limitations honestly.
Does it connect to my bank account?
No, it never connects to any bank account. The app has no bank sync, no login and no server; every transaction arrives by typing it in or by importing a CSV file you already have, and all data stays in your own browser. That makes it safe to demonstrate with realistic data and simple to explain in the viva.
How does budget tracking work?
Each of the 8 categories has a monthly limit that you set. Every new expense adds to its category total, the progress bar moves immediately, it turns amber at 80% of the limit, and it turns red with a dashboard alert once the limit is crossed. The remaining-budget figure for the whole month updates at the same time.
Can I add more categories or change the budgets?
Yes. Categories and their monthly limits are configurable in the code and through the budget view, so a team can rename categories, add new ones such as education or subscriptions, or change limits to match a different household. The charts and summary pick up new categories automatically.
Does it need internet or a server to run?
No. The dashboard is a single HTML file that runs in any modern browser with no server, no installation and no account. It works offline once downloaded, because all data is stored in the browser's localStorage and all charts are drawn locally with the Canvas API.
What will I receive with the project?
The complete single-file dashboard web app with the seeded demo data, the CSV import template and export feature, the project report PDF, a PPT presentation for the final review, a viva Q&A document, and setup instructions. The app is delivered ready to open in a browser and demonstrate.
Components & software requirements
- HTML5, CSS3 (dashboard layout & styling)
- JavaScript (ES6, application logic)
- Canvas API (donut & trend charts)
- localStorage API (browser persistence)
- CSV import & export
- Git (version control)
Delivery information
Built-to-order project. Delivery timeline is shared after order confirmation based on current queue.
Support terms
Complete documentation, setup guide, and viva preparation included. Support for setup and explanation provided.
Download free synopsis (PDF)
Enter your name and WhatsApp number — the synopsis PDF downloads immediately. We may send occasional project updates on WhatsApp; no spam.