
More project photos (2)
The problem
A People Counter for Shops with Infrared Sensors and Cloud Dashboard is a shop footfall counter that records every visitor who walks through a shop entrance and turns those crossings into hourly counts and daily totals on a cloud dashboard. Small shops currently guess at footfall: the owner watches the door, remembers busy spells roughly, or counts till receipts, and none of that shows when the shop was actually busy or whether a quiet morning is a staffing problem or a location problem. Without a record, decisions about opening hours, staff rotas and promotions rest on memory instead of evidence, and a shop that cannot measure its busiest hour cannot test whether a change made it busier. This project closes that gap with two infrared break-beam sensors, an ESP32 and a cloud dashboard, giving a small shop the footfall record large retail chains buy from expensive commercial counters, built from low-cost parts a student team can assemble, calibrate and explain.
Counting method comparison:
| Method | What it detects | Cost | Limitation |
|---|---|---|---|
| Infrared break-beam pair (this project) | Beam breaks in sequence | Low | Two people side by side count as 1 crossing |
| PIR motion sensor | Movement in a zone | Low | Cannot tell entry from exit |
| Camera counting | People in a video frame | High | Needs processing power and raises privacy questions |
Walks through the shop entrance, breaking the two infrared beams in sequence.
Follow the working sequence
How it works
The People Counter for Shops with Infrared Sensors and Cloud Dashboard works as a chain from beam to browser: two infrared break-beam sensors watch the shop entrance, the ESP32 reads their signals and works out the direction of each crossing, a debounce filter stops one person from counting twice, the live count appears on a small OLED display at the door, and the ESP32 uploads the totals over Wi-Fi to a cloud dashboard that draws hourly footfall bars, names the peak hour and keeps a time-stamped log of every entry and exit. The whole chain uses no camera and no face recognition: it counts only the order in which two invisible beams are broken, which keeps the hardware cheap, the wiring simple and the system free of privacy concerns about filming shoppers.
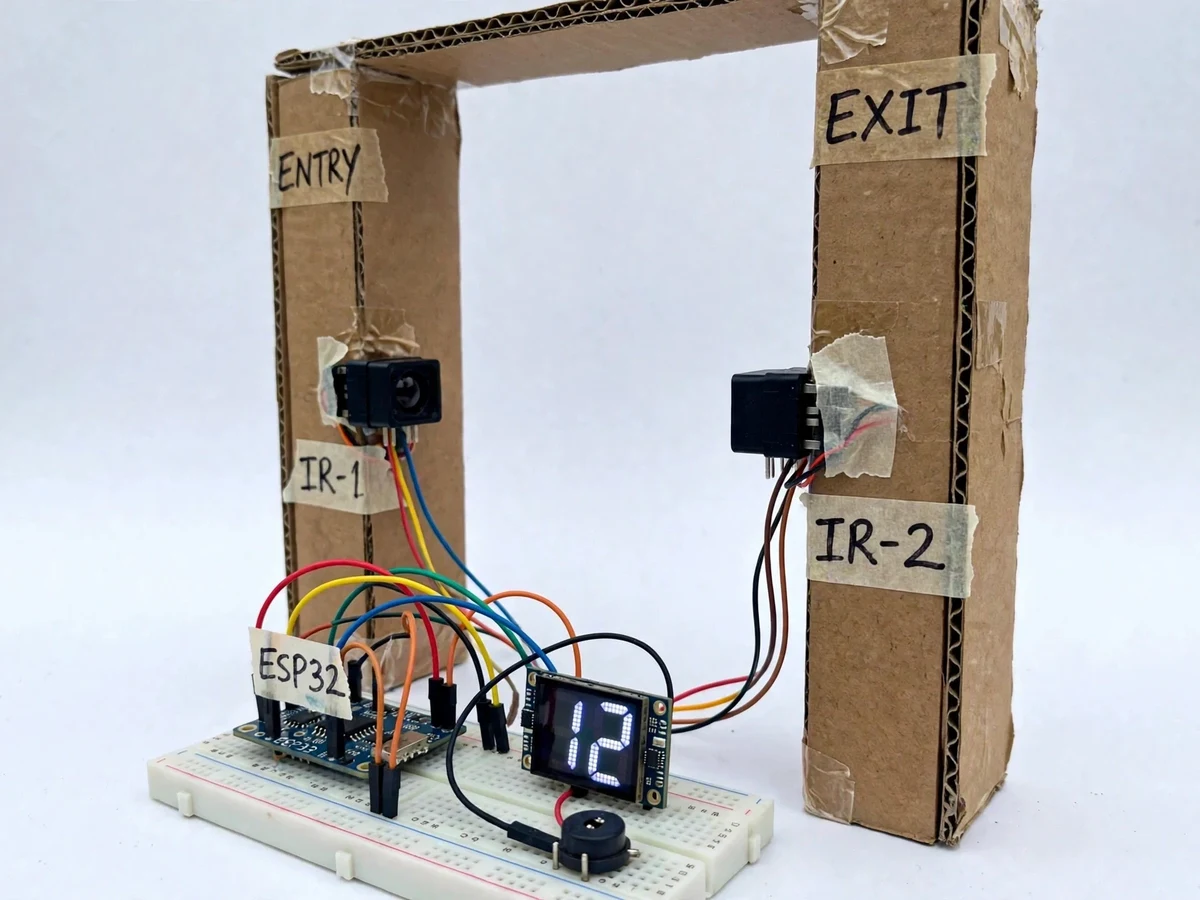
- Two infrared break-beam sensor modules are mounted on opposite sides of the entrance at approximately 0.9 m above floor level (design target), spaced approximately 25 cm apart along the walking direction (design target).
- A visitor walking in breaks the IR-1 beam first and the IR-2 beam second; a visitor walking out breaks them in the reverse order.
- The ESP32 reads both sensor outputs, applies a 50 ms debounce (design target) to ignore signal flicker, and accepts only a complete two-beam sequence as one crossing.
- On an entry the inside count rises by 1; on an exit it falls by 1, and the new count is shown immediately on the 0.96 inch OLED display at the door.
- Every 60 seconds (design target) the ESP32 uploads the current entries, exits and inside count over Wi-Fi to the cloud dashboard.
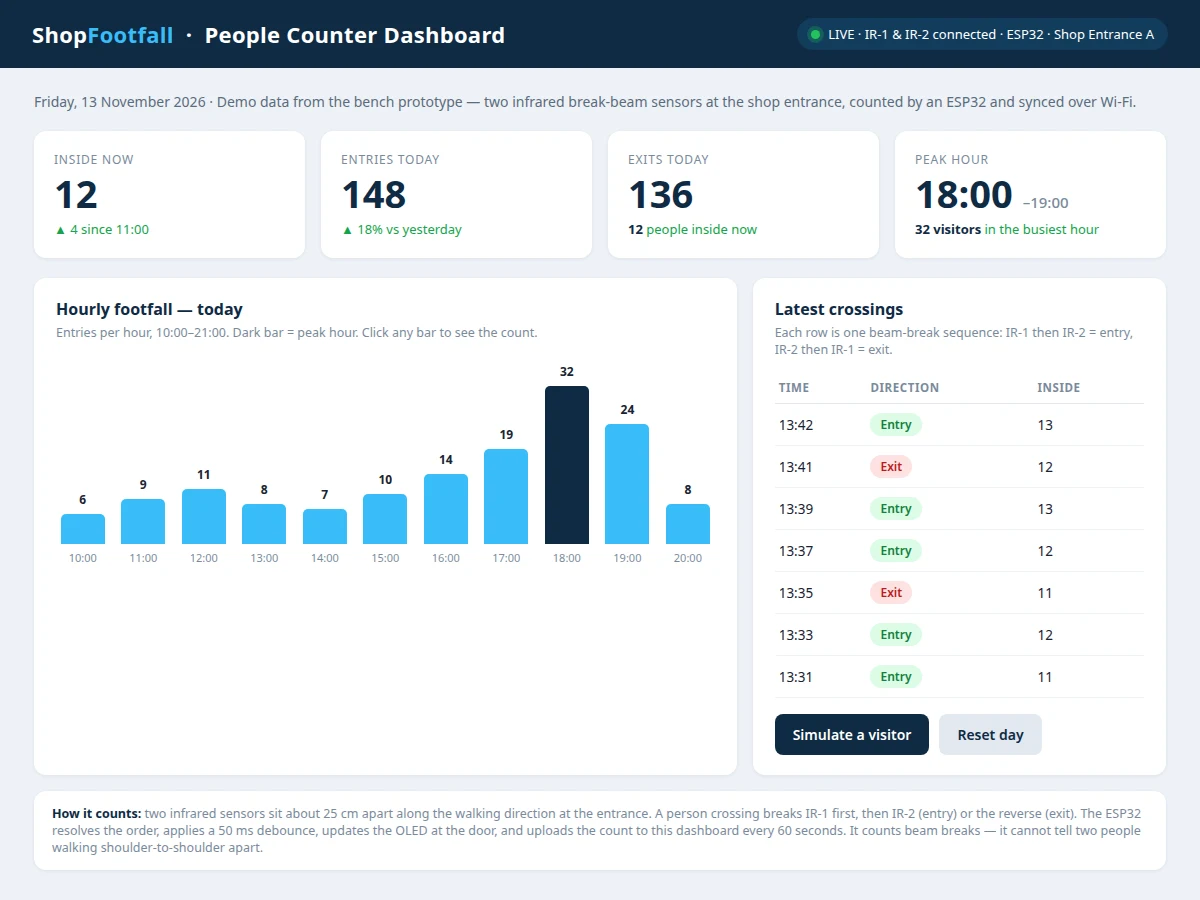
- The dashboard aggregates the uploads into hourly bars, identifies the peak hour, totals the day and appends each crossing to the time-stamped log.
- At the start of a trading day the owner resets the daily totals from the dashboard, and counting begins again from zero.
Builder note: during the bench build, mounting the sensor pair at approximately 0.9 m above floor level and spacing the two sensors approximately 25 cm apart along the walking direction stopped the double-counts seen when the sensors were mounted lower and closer together, because at waist height a single passer-by breaks each beam once in a clean sequence instead of waving a hand or bag through the beams twice.
Tech stack:
- ESP32 development board
- Infrared break-beam sensor modules
- Arduino IDE (ESP32 firmware)
- 0.96 inch OLED display · I2C
- Wi-Fi · HTTP JSON upload
- HTML · CSS · JavaScript dashboard
- Breadboard · jumper wires
- 5 V USB power supply
| Parameter | Value |
|---|---|
| Controller | ESP32 development board (dual-core, 240 MHz clock speed, datasheet value) |
| Sensors | 2 × infrared break-beam modules with digital output |
| Sensor mounting height | Approximately 0.9 m above floor level (design target) |
| Sensor spacing | Approximately 25 cm along the walking direction (design target) |
| Display | 0.96 inch OLED, 128 × 64 pixels (datasheet value) |
| Connectivity | Wi-Fi 802.11 b/g/n (datasheet value) |
| Upload interval | Every 60 seconds (design target) |
| Debounce | 50 ms (design target) |
| Power | 5 V USB supply (datasheet value) |
| Dashboard | Hourly bars, peak hour, daily totals, crossing log |
| Counting method | Beam-break sequence only; no camera and no face recognition |
| Entrance covered | 1 doorway of approximately 1 m width (design target) |
Project features
The People Counter for Shops with Infrared Sensors and Cloud Dashboard combines four capabilities that matter most to a shop owner: bidirectional counting that tells entries apart from exits, a cloud dashboard that turns raw crossings into hourly bars, a peak hour and daily totals, a live OLED count at the door so staff can see occupancy without opening a phone, and Wi-Fi syncing that keeps the dashboard current while the local display keeps working even when the internet drops. Around those four, the build adds debounce logic so one person crossing the beams counts exactly once, a crossing log that records the time and direction of each event, and a manual day reset so each trading day starts clean. Every feature is part of the base build, not an optional extra.
- [Bidirectional entry and exit counting] Two infrared sensors mounted a short distance apart along the walking direction detect the order of beam breaks: IR-1 then IR-2 means entry, IR-2 then IR-1 means exit, so the count tracks people inside as well as total visitors.
- [Cloud dashboard with hourly footfall] The dashboard shows entries per hour as a bar chart, highlights the peak hour, and lists entries, exits and daily totals, so the owner can see at a glance when the shop is busiest.
- [Live OLED count at the door] A 0.96 inch OLED display shows the current number of people inside, updating with every crossing, so staff can check occupancy without opening the dashboard.
- [Debounce and direction logic] The ESP32 applies a 50 ms debounce (design target) to each sensor signal, so the flicker of a single crossing cannot register as two visitors, and only a complete IR-1 to IR-2 sequence changes the count.
- [Wi-Fi sync to the cloud] The ESP32 uploads the latest totals over Wi-Fi every 60 seconds (design target), so the dashboard stays current during the trading day without any cable to the shop computer.
- [Crossing log] Every entry and exit is recorded with its time and direction in a running log on the dashboard, giving a checkable record behind the headline totals.
- [Offline local counting] If Wi-Fi drops, the sensors, ESP32 and OLED keep counting at the door, and the totals sync to the dashboard when the connection returns.
- [Manual day reset] A reset on the dashboard clears the daily totals so each trading day starts from zero, while the hourly history of the previous day remains visible in the log.
What is included
- Working prototype: ESP32, 2 infrared sensors, OLED display, buzzer and breadboard wiring on a model entrance frame
- ESP32 firmware with direction logic, debounce and Wi-Fi upload
- Cloud dashboard with hourly footfall chart, peak hour, daily totals and crossing log
- Circuit and wiring documentation with sensor mounting guidance
- Component list with part names and connection details
- Project report PDF (background, problem, methodology, working, results, applications, future scope)
- PPT presentation for final review
- Viva Q&A preparation document (infrared sensing, ESP32, debounce, Wi-Fi sync, counting limits)
- Demonstration guidance for the entrance-frame setup
Limitations & prerequisites
- The system counts beam breaks, not people: two visitors walking shoulder-to-shoulder through the entrance together register as 1 crossing.
- A visitor following closely behind another within the 50 ms debounce window (design target) may not register as a separate crossing.
- Strong direct sunlight on the sensor lenses can cause false triggers, so indoor entrance placement is expected.
- A power cut restarts the local OLED count from zero; the cloud dashboard keeps the last uploaded total.
- The dashboard needs Wi-Fi to update; the local OLED display keeps counting offline and syncs when the connection returns.
- The base build covers 1 doorway of approximately 1 m width (design target); a wide entrance needs an additional sensor pair.
- This is a counting prototype, not a security or access-control device: it identifies no individual and records no images.
Frequently Asked Questions
Is this project suitable for a final-year project?
Yes — for IoT & Embedded, Electronics and Computer Engineering students. It demonstrates infrared sensing, ESP32 firmware, debounce and direction logic, Wi-Fi data upload and a working cloud dashboard, all in one build that can be shown live at the entrance frame. The counting limits, such as two people side by side registering as one crossing, give honest discussion material for the viva.
How does it tell entries apart from exits?
By the order in which the two infrared beams break. A visitor entering breaks IR-1 first and IR-2 second, while a visitor leaving breaks IR-2 first and IR-1 second, and the ESP32 uses that order to add or subtract from the inside count. A single sensor could only say someone passed; the pair is what gives direction, which is why the two sensors must be spaced approximately 25 cm apart along the walking direction.
Does it use a camera or recognise faces?
No — the system uses only two infrared break-beam sensors and no camera, so it records no images, recognises no individual and raises none of the privacy questions a camera would raise; it counts only the order in which two beams are broken. That keeps the hardware cheap and the wiring simple, and it is also why the system cannot tell two people walking side by side apart.
Does the dashboard work without Wi-Fi?
The local counting works without Wi-Fi, but the dashboard does not update until the connection returns. The sensors, ESP32 and OLED display at the door keep counting offline, and the ESP32 uploads the latest totals over Wi-Fi every 60 seconds (design target) once the connection is back. For the demonstration, the dashboard can run on the same local network as the ESP32.
Can it cover a wide entrance or a whole mall?
Not as shipped — the base build covers 1 doorway of approximately 1 m width (design target) with a single pair of infrared sensors. A wider entrance needs an additional sensor pair mounted beside the first, and a mall would need one counter per entrance with the dashboard combining the totals. The firmware and dashboard are structured so extra sensor pairs and entrances can be added as a customisation.
What will I receive with the project?
The working prototype on its model entrance frame, the ESP32 firmware, the cloud dashboard, wiring and mounting documentation, the component list, the project report PDF, a PPT for the final review, a viva Q&A document and demonstration guidance. Everything is built to order, so the report and documentation describe the exact hardware and dashboard delivered, not a generic template.
Components & software requirements
- ESP32 development board
- Infrared break-beam sensor modules
- Arduino IDE (ESP32 firmware)
- 0.96 inch OLED display · I2C
- Wi-Fi · HTTP JSON upload
- HTML · CSS · JavaScript dashboard
- Breadboard · jumper wires
- 5 V USB power supply
Delivery information
Built-to-order project. Delivery timeline is shared after order confirmation based on current queue.
Support terms
Complete documentation, setup guide, and viva preparation included. Support for setup and explanation provided.
Download free synopsis (PDF)
Enter your name and WhatsApp number — the synopsis PDF downloads immediately. We may send occasional project updates on WhatsApp; no spam.