
More project photos (2)
The problem
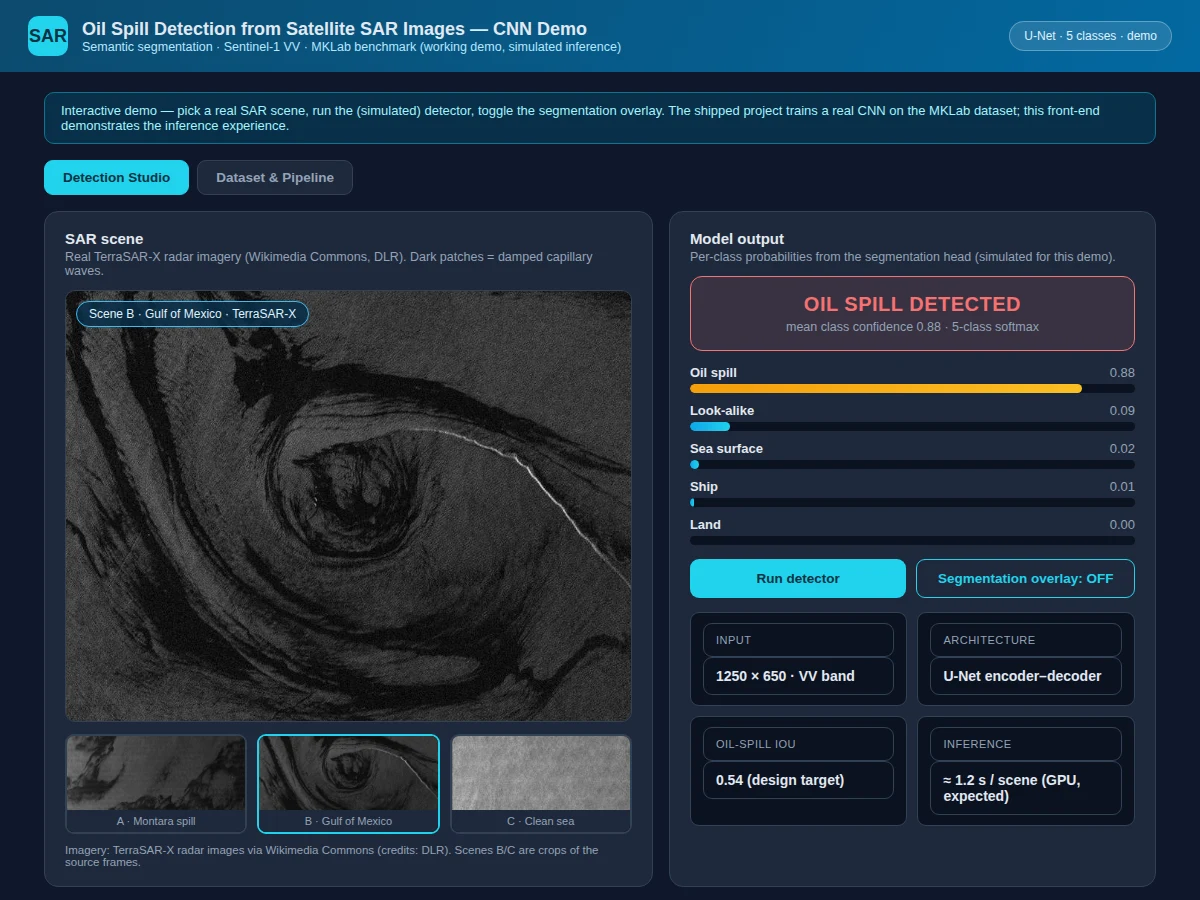
When oil hits the sea surface it damps the tiny wind-driven capillary waves that radar reflects off, so spills appear as dark patches in synthetic-aperture-radar images — visible day and night, through cloud cover. The catch is that low-wind zones, biogenic films and other look-alikes produce the same dark signature, and telling them apart is the whole problem. This project takes the modern approach: a U-Net style encoder-decoder CNN trained for five-class semantic segmentation on the MKLab oil-spill benchmark, learning shape, texture and context instead of relying on hand-crafted dark-spot features. The training notebook covers SNAP-style preprocessing, augmentation, weighted loss functions for the class imbalance, and honest per-class IoU reporting. A web demo lets you pick real SAR scenes — including the TerraSAR-X Montara and Gulf of Mexico spill imagery — and watch the detector classify each scene with per-class probabilities and a segmentation overlay.
VV-polarization SAR scenes from the MKLab benchmark.
Follow the working sequence
How it works
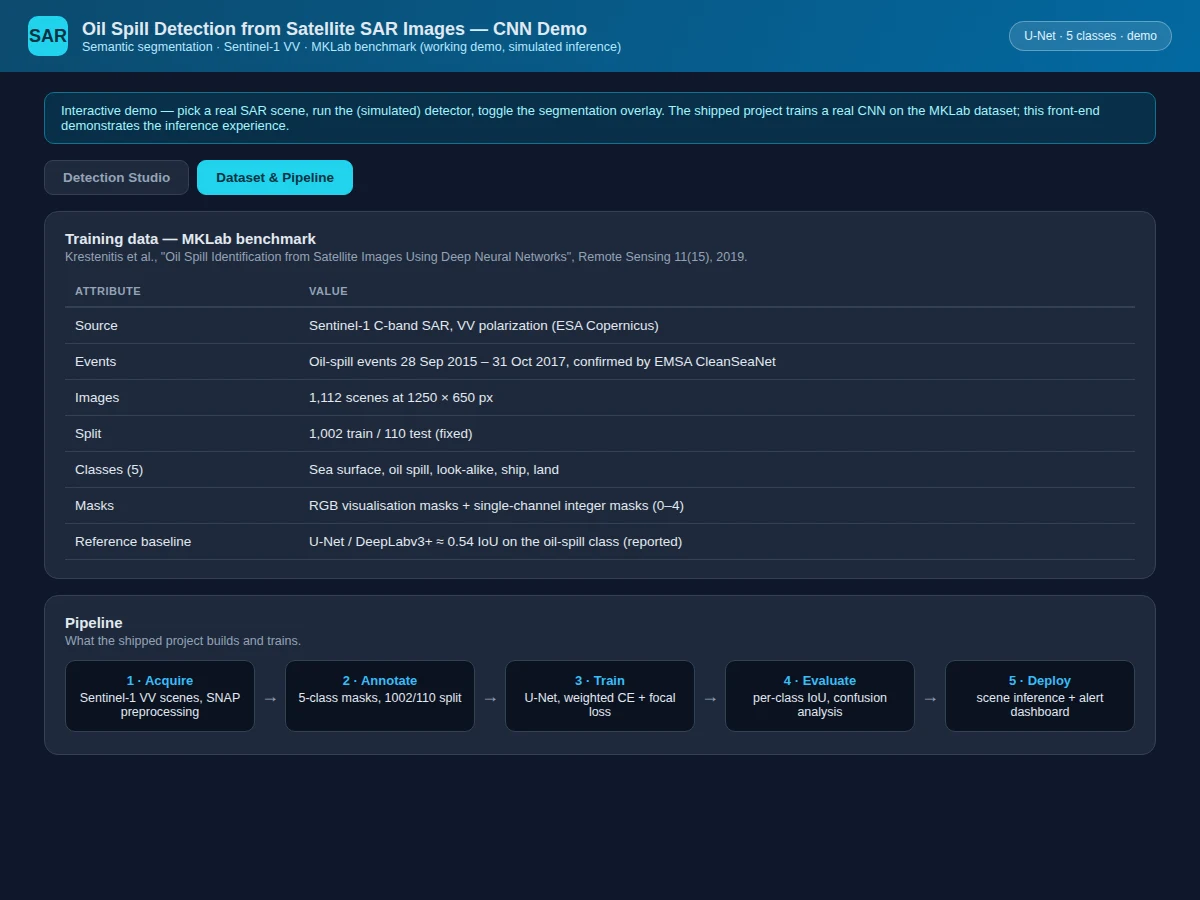
- Sentinel-1 VV-polarization SAR scenes are preprocessed (region cropping, radiometric calibration, speckle filtering, dB-to-luminance conversion) following the benchmark's published pipeline.
- The 1,112 annotated scenes (1,002 train / 110 test) provide five-class masks: sea surface, oil spill, look-alike, ship and land.
- A U-Net encoder-decoder is trained with weighted cross-entropy (plus focal-loss experiments) to handle the severe class imbalance — spill pixels are rare.
- Augmentation (rotation, flipping) expands the effective training set, since SAR scenes are robust to affine transforms.
- The test split is evaluated once: per-class IoU, with the oil-spill class as the headline metric, plus qualitative overlay inspection.
- In the web demo, a selected scene passes through the saved model; the app shows the five class probabilities, the verdict, and the toggleable segmentation overlay.
Tech stack:
- Python 3, PyTorch (or TensorFlow/Keras — buyer's choice)
- NumPy, Matplotlib, scikit-learn (metrics)
- Jupyter Notebook (training & evaluation)
- HTML5 + JavaScript (detection-studio web demo)
- SNAP-style SAR preprocessing chain
- MKLab oil-spill SAR benchmark
- Git
Dataset & model details
- Dataset: MKLab oil-spill SAR benchmark (Krestenitis et al., "Oil Spill Identification from Satellite Images Using Deep Neural Networks", Remote Sensing 11(15), 2019) — 1,112 Sentinel-1 C-band SAR scenes (VV polarization) at 1250×650 px, fixed 1002/110 train/test split. Events span 28 Sep 2015 – 31 Oct 2017, confirmed by EMSA CleanSeaNet. RGB visualisation masks plus single-channel integer masks (0–4) are provided.
- Task: 5-class semantic segmentation; input = 1250×650×1 SAR scene, output = per-pixel class map over {sea surface, oil spill, look-alike, ship, land}.
- Model: U-Net encoder-decoder (contracting path + expansive path with skip connections); weighted cross-entropy loss with focal-loss variant; rotation/flip augmentation.
- Metrics: Per-class IoU; reported literature baselines are ≈0.54 IoU on the oil-spill class for U-Net/DeepLabv3+ (Krestenitis et al., 2019). The built-to-order training run targets comparable performance — stated as a design target, with the report documenting the actual achieved figures after training. No accuracy is claimed as measured until the training run is executed for the order.
| Parameter | Value |
|---|---|
| Input | 1250 × 650 single-channel SAR, VV polarization |
| Classes | 5 (sea surface, oil spill, look-alike, ship, land) |
| Dataset | 1,112 scenes; 1002 train / 110 test (fixed split) |
| Model | U-Net encoder-decoder (design) |
| Oil-spill IoU | Approximately 0.54 (design target, not a measured claim) |
| Training time | Several hours on a GPU (expected; CPU training not recommended) |
| Inference | Approximately 1.2 s per scene on GPU (expected) |
| Demo | Single-file web app; SAR scenes embedded |
Project features
- [U-Net segmentation model] Encoder-decoder CNN with skip connections for five-class pixel-wise segmentation — sea surface, oil spill, look-alike, ship and land.
- [Real SAR demo scenes] The web demo runs over genuine TerraSAR-X radar imagery (Montara platform spill, Gulf of Mexico oil-polluted area, clean open sea) with per-class probability bars.
- [Segmentation overlay] Toggleable mask overlay on each scene showing where the model places the spill boundary.
- [Full training notebook] Data loading, augmentation, model definition, weighted cross-entropy and focal loss, training loop and evaluation in one reproducible notebook.
- [Per-class IoU reporting] Intersection-over-union for every class, with explicit analysis of the oil-spill vs look-alike confusion that defines this task.
- [Look-alike analysis] Dedicated evaluation of the hardest distinction in the field — dark patches that are not oil — documented for the viva.
- [Exported trained model] Saved weights plus the preprocessing pipeline, so the demo runs the real network without retraining.
What is included
- Complete training & evaluation Jupyter notebook
- Trained segmentation model weights with preprocessing code
- Detection-studio web demo with real SAR scenes, probability bars and overlay toggle
- Per-class IoU report and look-alike confusion analysis
- Project report PDF (SAR principles, dataset, architecture rationale, methodology, results)
- PPT presentation for final review
- Viva Q&A preparation document (SAR backscatter, Doppler-free imaging, U-Net, IoU, class imbalance, look-alikes)
Limitations & prerequisites
- The model segments what the training data teaches: rare spill morphologies (long thin slicks) are the known weak point in the literature and in this build.
- SAR detection needs wind in a working band — near-zero wind or storm cells make slicks undetectable regardless of the model; this is physics, not a model flaw.
- 0.54 IoU is a design target anchored to published baselines — the report documents the actual achieved figure after the training run.
- Training needs a GPU; a CPU-only laptop will take impractically long, stated plainly before purchase.
- The demo's inference is simulated in-browser to keep it a single file; the shipped notebook trains and runs the real network.
- This is an educational/environmental-monitoring build, not a certified operational spill-response system.
Frequently Asked Questions
Which dataset is used and why?
The MKLab benchmark (Krestenitis et al., Remote Sensing 2019) — 1,112 Sentinel-1 SAR scenes with five-class annotations and a fixed train/test split. It is the standard public benchmark for this task, with events verified by the European Maritime Safety Agency.
Why is oil-spill detection hard?
Oil and harmless look-alikes (low-wind zones, biogenic films) both appear as dark patches in SAR. Brightness alone cannot separate them — the network must learn shape, texture and context, which is exactly what the segmentation approach trains for.
What does the model output?
A per-pixel map over five classes plus scene-level class probabilities. The demo shows the probability bars, the verdict, and a toggleable overlay of the predicted spill region on the SAR scene.
How is it evaluated?
Per-class Intersection-over-Union on the fixed 110-scene test split, with the oil-spill class as the headline number. Published U-Net baselines sit near 0.54 IoU; the report records what the actual training run achieves.
Can it run on a normal laptop?
Inference yes — the demo runs in a browser. Training needs a GPU; CPU training is impractically slow and the report says so upfront.
Is this project suitable for a final-year project?
Yes — for Computer Science, IT and AI/ML programs. It combines remote-sensing domain knowledge, a real benchmark dataset, segmentation architecture design, disciplined evaluation and a working demo on real satellite imagery. Suitable for B.E./B.Tech final-year projects in Computer Science, IT and AI & Machine Learning.
Components & software requirements
- Python 3, PyTorch (or TensorFlow/Keras — buyer's choice)
- NumPy, Matplotlib, scikit-learn (metrics)
- Jupyter Notebook (training & evaluation)
- HTML5 + JavaScript (detection-studio web demo)
- SNAP-style SAR preprocessing chain
- MKLab oil-spill SAR benchmark
- Git
Dataset & model details
- Dataset: MKLab oil-spill SAR benchmark (Krestenitis et al., "Oil Spill Identification from Satellite Images Using Deep Neural Networks", Remote Sensing 11(15), 2019) — 1,112 Sentinel-1 C-band SAR scenes (VV polarization) at 1250×650 px, fixed 1002/110 train/test split. Events span 28 Sep 2015 – 31 Oct 2017, confirmed by EMSA CleanSeaNet. RGB visualisation masks plus single-channel integer masks (0–4) are provided.
- Task: 5-class semantic segmentation; input = 1250×650×1 SAR scene, output = per-pixel class map over {sea surface, oil spill, look-alike, ship, land}.
- Model: U-Net encoder-decoder (contracting path + expansive path with skip connections); weighted cross-entropy loss with focal-loss variant; rotation/flip augmentation.
- Metrics: Per-class IoU; reported literature baselines are ≈0.54 IoU on the oil-spill class for U-Net/DeepLabv3+ (Krestenitis et al., 2019). The built-to-order training run targets comparable performance — stated as a design target, with the report documenting the actual achieved figures after training. No accuracy is claimed as measured until the training run is executed for the order.
Delivery information
Built-to-order project. Delivery timeline is shared after order confirmation based on current queue.
Support terms
Complete documentation, setup guide, and viva preparation included. Support for setup and explanation provided.
Download free synopsis (PDF)
Enter your name and email — the synopsis PDF downloads immediately. We may send occasional project updates; no spam, unsubscribe anytime.