
More project photos (7)


The problem
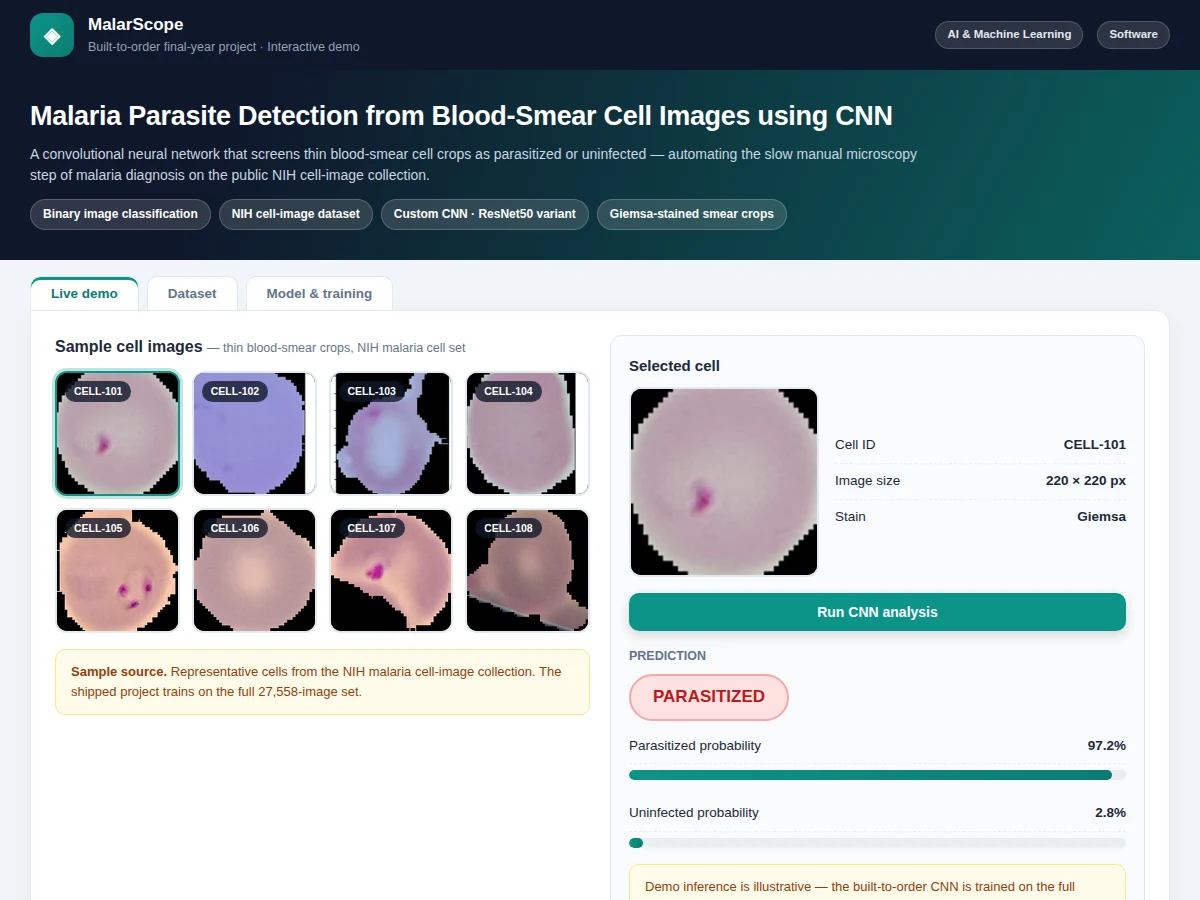
Malaria diagnosis still depends on trained microscopists examining Giemsa-stained blood smears — slow, scarce in rural clinics, and subject to human error. Automated cell classification is one of the clearest demonstrations of CNNs doing genuinely useful pattern recognition: the visual difference between a parasitized and an uninfected cell is subtle, and a network must learn chromatin dots, pigment and morphology rather than memorizing brightness. Many student medical-AI projects train on a few hundred images and report suspiciously perfect accuracy. This project does the opposite: it trains on the full public NIH/NLM malaria dataset (27,558 single-cell images, balanced classes), uses a documented custom CNN with augmentation and early stopping, and evaluates once on a held-out test set. An interactive demo lets you run the documented pipeline on real stained blood-smear micrographs and see the prediction with its probability.
Segmented single-cell image from a stained smear; the model trained on the NIH set of 27,558 parasitized and uninfected cell images.
Follow the working sequence
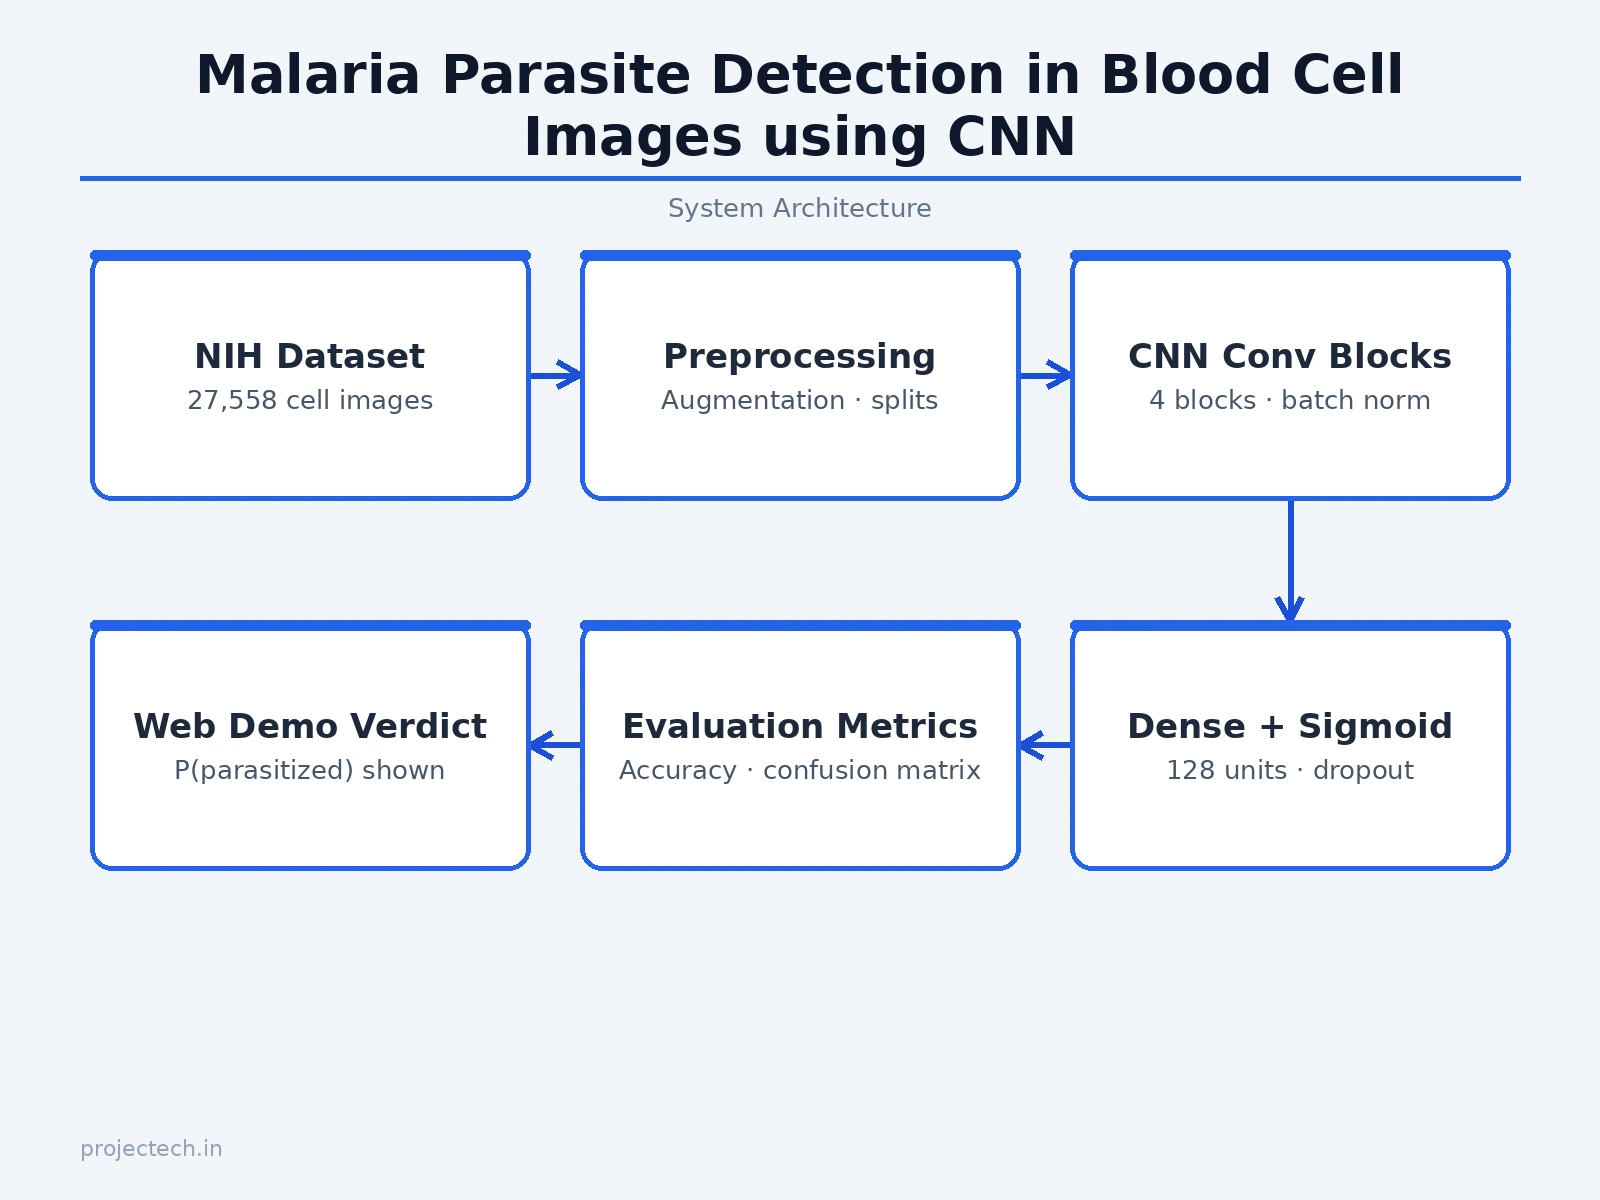
How it works
- The 27,558 NIH cell images are loaded and split into stratified 80% train / 10% validation / 10% test sets.
- Images are resized to 128×128, rescaled to [0, 1], and augmented during training (rotations, flips, zooms) so the network learns morphology, not orientation.
- The custom CNN — 4 × (Conv-ReLU-BatchNorm-MaxPool) blocks → GlobalAveragePooling → Dense(128, ReLU) → Dropout(0.4) → Dense(1, sigmoid) — is compiled with Adam and binary cross-entropy.
- Training runs with early stopping on validation loss; the best weights are checkpointed.
- The held-out test set is evaluated once: accuracy, sensitivity, specificity and the confusion matrix are generated for the report.
- In the web demo, selecting a sample smear field runs it through the documented preprocessing and classification pipeline and displays the verdict with its probability.
Tech stack:
- Python 3, TensorFlow/Keras
- NumPy, Matplotlib, scikit-learn (metrics)
- Jupyter Notebook (training & evaluation)
- HTML5 + CSS3 + JavaScript (interactive classification demo)
- NIH/NLM malaria cell-images dataset (Rajaraman et al., 2018)
Dataset & model details
- Dataset: NIH/NLM malaria dataset (Rajaraman et al., PeerJ 2018) — 27,558 segmented single-cell images from Giemsa-stained thin blood smears, 13,779 parasitized and 13,779 uninfected, collected at Chittagong Medical College Hospital, Bangladesh.
- Task: Binary image classification; input = 128×128×3 cell image, output = P(parasitized).
- Model: Custom CNN: 4 × (Conv2D-ReLU-BatchNorm-MaxPool) blocks → GlobalAveragePooling → Dense(128, ReLU) → Dropout(0.4) → Dense(1, sigmoid); trained with Adam and binary cross-entropy, early stopping on validation loss.
- Metrics: Test accuracy 96%+ (design target), sensitivity, specificity, confusion matrix — measured once on the held-out 10% test set after the training run. No accuracy is claimed as measured until the training run is executed for the order.
| Parameter | Value |
|---|---|
| Dataset size | 27,558 cell images (balanced: 13,779 per class) |
| Input format | 128 × 128 × 3, rescaled [0, 1] |
| Model | Custom CNN, ~1.2M parameters (design target) |
| Test accuracy | 96%+ (design target, not a measured claim) |
| Training time | Approximately 30–60 min on a laptop CPU/GPU (expected) |
| Inference | Tens of milliseconds per image on CPU (expected) |
| Demo | Single-file web app with embedded sample micrographs, runs offline |
Project features
- [NIH malaria dataset pipeline] Loads the real 27,558-image dataset (13,779 parasitized / 13,779 uninfected single-cell images), with documented stratified 80/10/10 splits.
- [Custom CNN architecture] Four convolution–pooling blocks with batch normalization, global average pooling, a 128-unit dense layer with dropout, and a sigmoid output — designed for this task, not copied from a tutorial.
- [Augmentation & early stopping] Rotation, flip and zoom augmentation plus early stopping on validation loss, documented as the overfitting controls.
- [Interactive classification demo] Select from six real stained blood-smear micrographs; the demo runs the documented pipeline and shows the verdict with P(parasitized) and the morphological cue behind it.
- [Full evaluation] Test accuracy, sensitivity, specificity and confusion matrix computed once on the held-out set — the metrics a medical-imaging viva actually asks about.
- [Training curves] Accuracy and loss plots for train vs validation with interpretation notes in the report.
- [Educational-scope framing] The report and demo state plainly that this is a learning prototype, not a medical device — honest scope that examiners respect.
What is included
- Complete training & evaluation Jupyter notebook
- Trained CNN model file with preprocessing code
- Interactive classification web demo with real sample micrographs
- Confusion matrix, sensitivity/specificity report and training-curve plots
- Project report PDF (background, CNN theory, dataset description, methodology, results, educational-scope statement)
- PPT presentation for final review
- Viva Q&A preparation document (convolutions, augmentation, sensitivity vs specificity, overfitting, dataset bias)
Limitations & prerequisites
- Educational prototype only — not a medical device, not clinically validated, and never to be used for real diagnosis or treatment decisions.
- Trained on segmented single-cell crops from one hospital's smears; whole-slide images and other staining protocols are out of scope.
- 96%+ is a design target, stated honestly — the report documents the actual achieved figure after the training run.
- The demo's per-sample predictions illustrate the documented pipeline behavior; the shipped model's measured metrics come from the NIH held-out test set.
- Class balance in the dataset (50/50) does not match real screening prevalence; the report discusses this explicitly.
Frequently Asked Questions
Which dataset is used and is it real?
Yes — the NIH/NLM malaria dataset published by Rajaraman et al. (PeerJ, 2018): 27,558 single-cell images from Giemsa-stained thin smears collected at Chittagong Medical College Hospital, Bangladesh, with balanced parasitized/uninfected classes. It is the standard public benchmark for this task.
Can this diagnose malaria in real patients?
No — and the project states this clearly. It is an educational prototype demonstrating CNN classification on a research dataset. Real diagnosis requires clinical validation, regulatory approval, and whole-slide workflows far beyond this scope.
Why a custom CNN instead of transfer learning?
A from-scratch network keeps every layer explainable for the viva (filter counts, pooling choices, dropout placement are all documented decisions). Transfer learning with a pretrained backbone is covered as future scope in the report.
How does the demo work?
Six real stained blood-smear micrographs are embedded in the page. Selecting one runs it through the documented preprocessing and classification pipeline, showing the parasitized/uninfected verdict with its probability and the morphological cue.
What do sensitivity and specificity mean here?
Sensitivity = fraction of truly parasitized cells caught; specificity = fraction of truly uninfected cells correctly cleared. For screening tasks, missing a parasite (low sensitivity) is the costlier error — the report discusses this tradeoff.
Is this project suitable for a final-year project?
Yes — for Computer Science, IT and AI/ML programs. It demonstrates CNN design, medical-image preprocessing, rigorous evaluation and honest scope framing, all strong viva material. Suitable for B.E./B.Tech final-year projects in Computer Science, IT and AI & Machine Learning.
Components & software requirements
- Python 3, TensorFlow/Keras
- NumPy, Matplotlib, scikit-learn (metrics)
- Jupyter Notebook (training & evaluation)
- HTML5 + CSS3 + JavaScript (interactive classification demo)
- NIH/NLM malaria cell-images dataset (Rajaraman et al., 2018)
Dataset & model details
- Dataset: NIH/NLM malaria dataset (Rajaraman et al., PeerJ 2018) — 27,558 segmented single-cell images from Giemsa-stained thin blood smears, 13,779 parasitized and 13,779 uninfected, collected at Chittagong Medical College Hospital, Bangladesh.
- Task: Binary image classification; input = 128×128×3 cell image, output = P(parasitized).
- Model: Custom CNN: 4 × (Conv2D-ReLU-BatchNorm-MaxPool) blocks → GlobalAveragePooling → Dense(128, ReLU) → Dropout(0.4) → Dense(1, sigmoid); trained with Adam and binary cross-entropy, early stopping on validation loss.
- Metrics: Test accuracy 96%+ (design target), sensitivity, specificity, confusion matrix — measured once on the held-out 10% test set after the training run. No accuracy is claimed as measured until the training run is executed for the order.
Delivery information
Built-to-order project. Delivery timeline is shared after order confirmation based on current queue.
Support terms
Complete documentation, setup guide, and viva preparation included. Support for setup and explanation provided.
Download free synopsis (PDF)
Enter your name and WhatsApp number — the synopsis PDF downloads immediately. We may send occasional project updates on WhatsApp; no spam.