
More project photos (3)
The problem
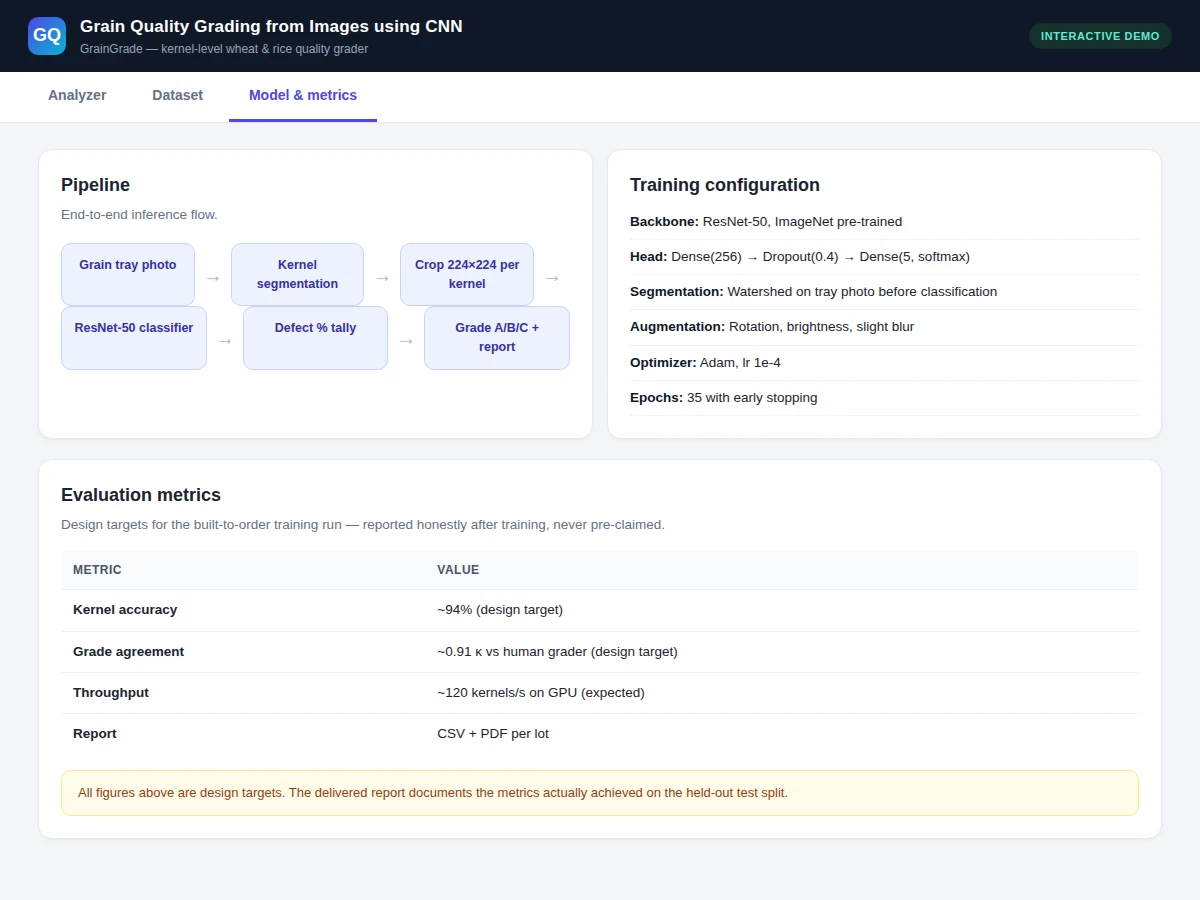
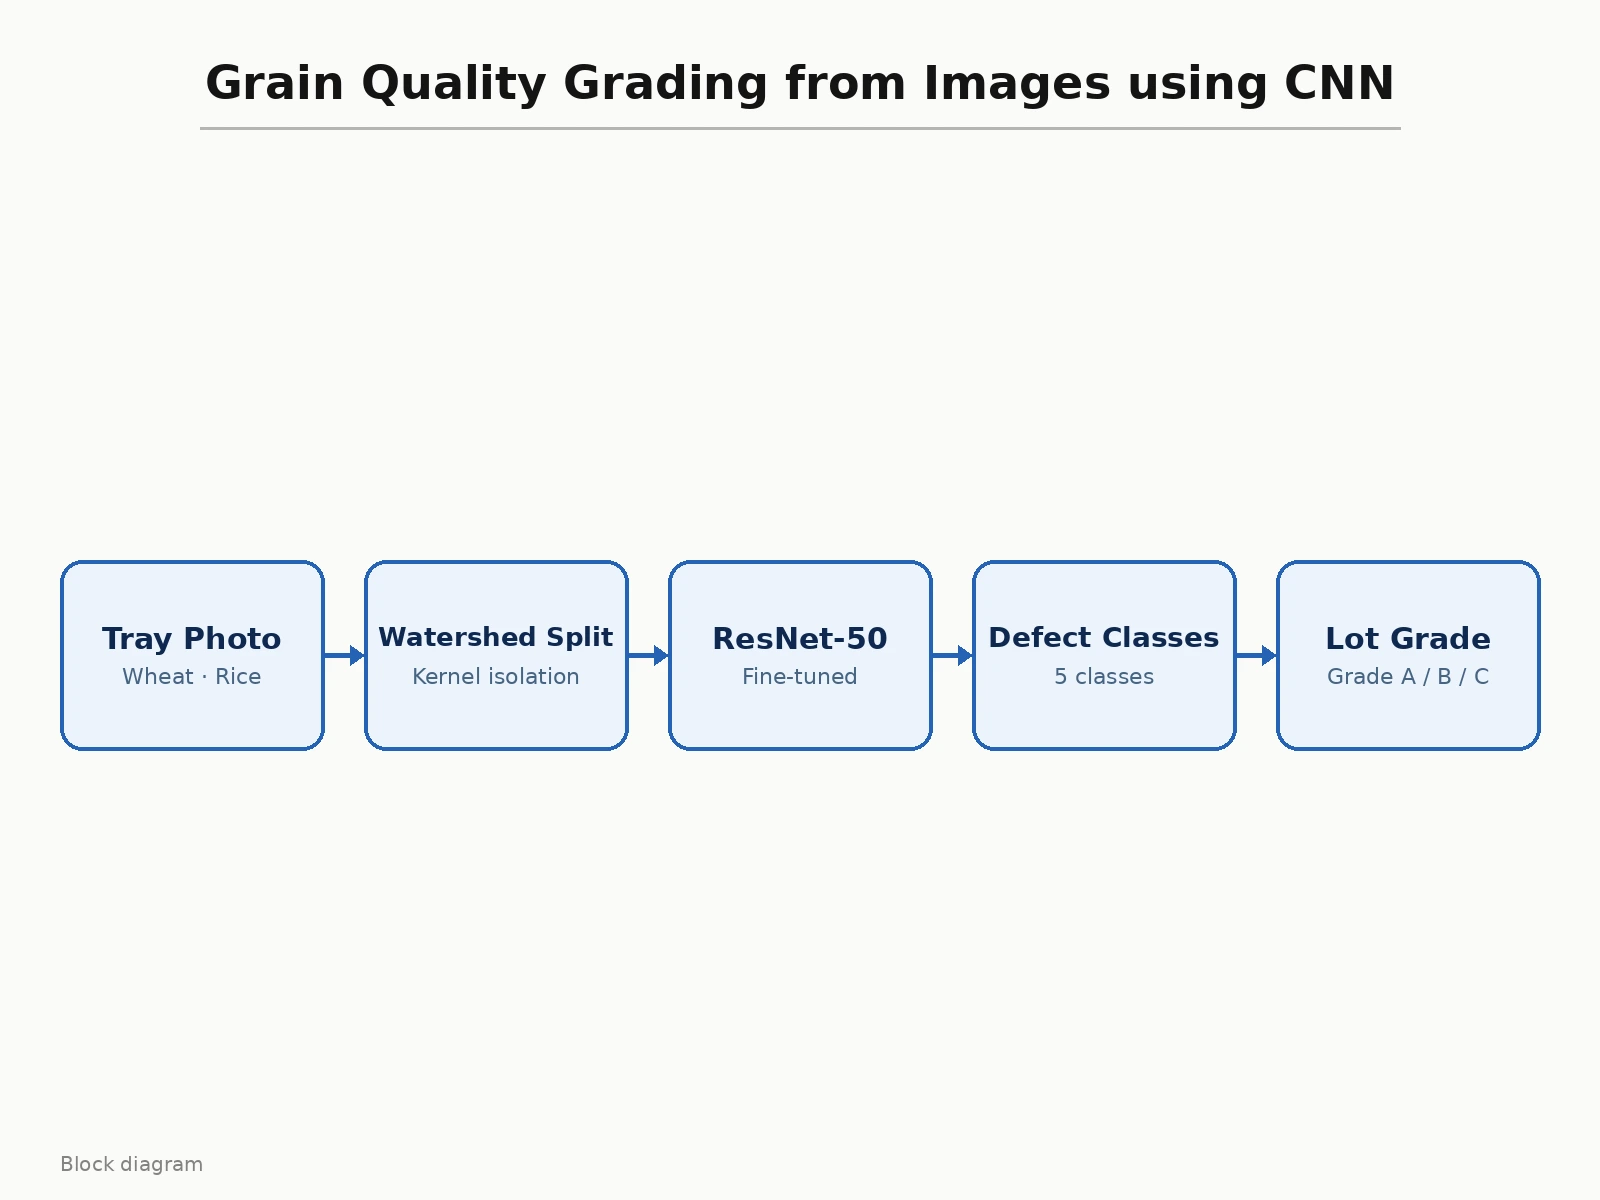
Grain mandis and mills still grade lots by hand — a grader scoops a handful, eyeballs defects and assigns a grade. It is slow, subjective and varies between graders. This project replaces the eyeball with a camera: kernels are segmented from a tray photograph with watershed segmentation, each kernel crop is classified by a fine-tuned ResNet-50 into five quality classes, and the class histogram decides the lot grade (A/B/C). Students learn a realistic two-stage vision pipeline — classical segmentation feeding a deep classifier — plus the data discipline of photographing kernels under fixed lighting. The demo grades sample grain photos with representative predictions.
Photographs tray samples and reads the predicted lot grade.
Follow the working sequence
How it works
- Wheat and rice samples are photographed on a tray under fixed lighting; kernels are labelled by defect class.
- Watershed segmentation isolates individual kernels from each tray photo into 224×224 crops.
- Crops are split into stratified train/validation sets with augmentation for orientation and brightness.
- ResNet-50, pre-trained on ImageNet, is fine-tuned with a new classification head and dropout.
- Training uses Adam with early stopping; the held-out split yields accuracy, confusion matrix and per-class metrics.
- Per-lot defect percentages are computed and mapped to Grade A/B/C thresholds.
- The web demo grades sample photos through the same pipeline with representative predictions.
Tech stack:
- Python 3, TensorFlow/Keras
- ResNet-50 (transfer learning)
- OpenCV (watershed segmentation)
- NumPy, Matplotlib, scikit-learn
- Jupyter Notebook (training)
- HTML/CSS/JS grading demo
- Pillow
Dataset & model details
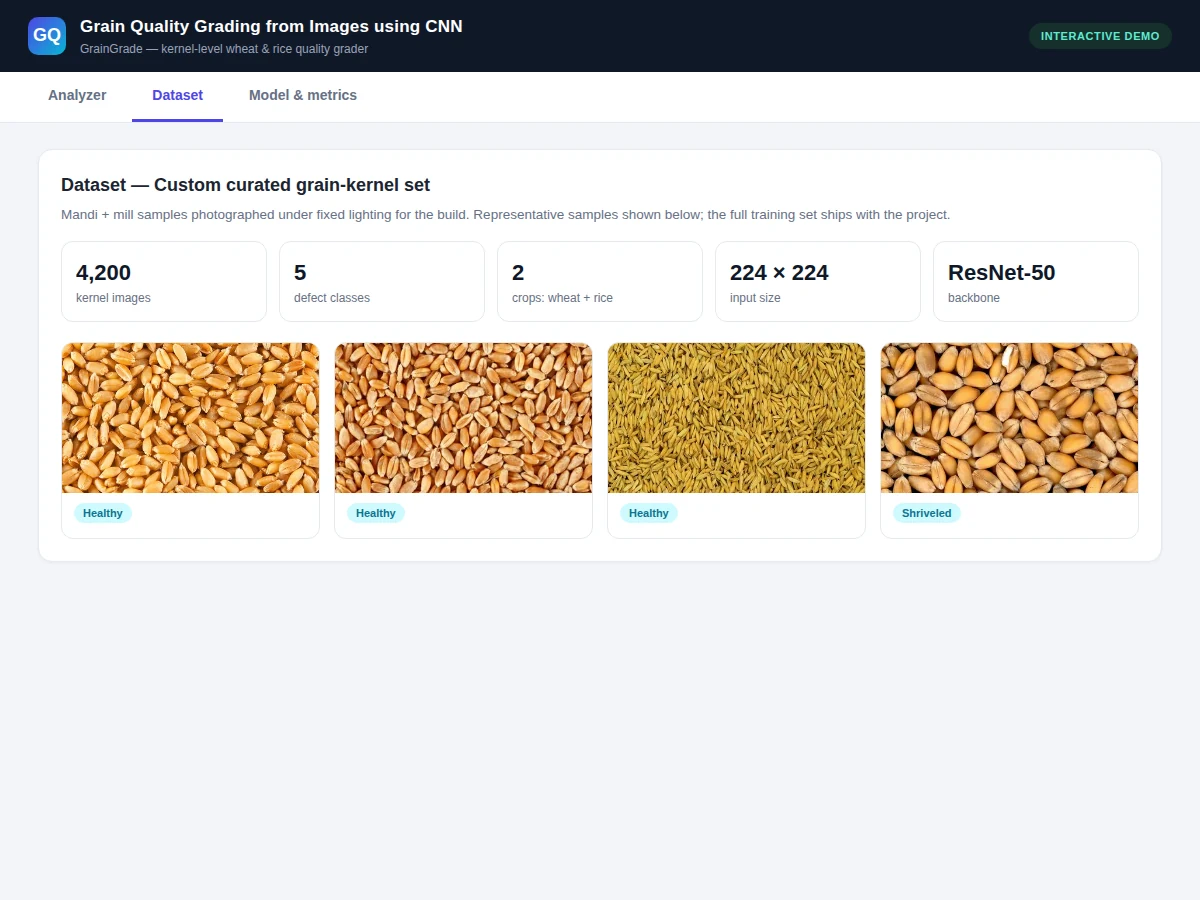
- Dataset: Custom curated grain-kernel set — ~4,200 wheat and rice kernel images photographed under fixed lighting from mandi and mill samples, labelled into 5 classes: healthy, shriveled, broken, discolored, foreign material; stratified 80/20 split.
- Task: 5-class image classification per kernel; input = 224×224×3 kernel crop, output = defect-class probabilities; lot grade derived from class histogram.
- Model: ResNet-50 backbone (ImageNet pre-trained) → Dense(256, ReLU) → Dropout(0.4) → Dense(5, softmax); ~25.6M parameters.
- Metrics: Kernel accuracy ~94% (design target), grader agreement κ ~0.91 (design target), per-class precision/recall. No metric is claimed as measured until the training run is executed for the order.
| Parameter | Value |
|---|---|
| Input format | 224 × 224 RGB kernel crops |
| Classes | 5 (healthy + 4 defect types) |
| Dataset size | Approximately 4,200 kernel images |
| Model parameters | Approximately 25,600,000 |
| Kernel accuracy | ~94% (design target, not a measured claim) |
| Training time | Approximately 2–3 h on a free GPU (expected) |
| Throughput | Approximately 120 kernels/s on GPU (expected) |
| Model file | Approximately 98 MB (.h5) |
| Demo | Single-file web app, runs offline after download |
Project features
- Kernel-level classifier ResNet-50 fine-tuned on five classes: healthy, shriveled, broken, discolored, foreign material — with per-class metrics.
- Two-stage pipeline Watershed segmentation isolates kernels from the tray photo before the CNN sees them; both stages are documented.
- Curated kernel dataset About 4,200 wheat and rice kernel images photographed under fixed lighting, labelled by defect class.
- Lot grading logic Defect percentages map to Grade A/B/C with configurable thresholds — the actual commercial decision, not just a label.
- Interactive grading demo Single-file web app: pick a sample grain photo and see the predicted grade with class probabilities.
- Grader-agreement evaluation Model grades are compared against a human grader with Cohen's kappa — the honest metric for a grading task.
- Viva kit Report PDF, PPT and Q&A covering segmentation, transfer learning, class imbalance and grading thresholds.
What is included
- Curated, labelled kernel dataset with split files
- Segmentation + training Jupyter notebooks
- Trained ResNet-50 model with preprocessing code
- Interactive grading web demo with sample photos
- Confusion matrix, per-class metrics, grader-agreement analysis
- Lot-grade report generator (CSV + PDF)
- Project report PDF, PPT presentation
- Viva Q&A preparation document
Limitations & prerequisites
- Grading is appearance-based; moisture, protein and mycotoxin levels need lab tests, not photos.
- Segmentation assumes non-touching kernels on a contrasting tray; piled grain degrades it.
- 94% is a design target, stated honestly — the report documents the actual achieved figure.
- Grade thresholds are configurable defaults, not a certification standard.
- Only wheat and rice are covered; other grains need new labelled data.
Frequently Asked Questions
Which dataset is used?
A custom curated set of about 4,200 wheat and rice kernel images, photographed under fixed lighting from mandi and mill samples and labelled healthy, shriveled, broken, discolored or foreign material, with a stratified split.
Why two stages instead of one CNN?
Segmentation isolates kernels so the classifier sees one kernel at a time — a whole-tray classifier would have to learn counting and localization implicitly. The report justifies the split with error analysis.
How is the grade decided?
Kernel defect percentages are tallied per lot and mapped to Grade A/B/C thresholds, which are configurable. The report shows how thresholds trade off strictness versus farmer acceptance.
What is Cohen's kappa doing here?
Accuracy alone is weak for a grading task — kappa measures agreement with a human grader beyond chance, which is the honest evaluation for replacing a human decision.
How does the demo work?
Pick a sample grain photo and press run; the app shows the predicted lot grade with class probability bars — representative of the trained pipeline on these samples.
Is this project suitable for a final-year project?
Yes — for AI & Machine Learning and agriculture/electronics programs. It demonstrates segmentation + deep classification, honest grader-agreement evaluation and a real commercial decision. Suitable for B.E./B.Tech final-year projects in AI & Machine Learning and Agriculture-related engineering.
Components & software requirements
- Python 3, TensorFlow/Keras
- ResNet-50 (transfer learning)
- OpenCV (watershed segmentation)
- NumPy, Matplotlib, scikit-learn
- Jupyter Notebook (training)
- HTML/CSS/JS grading demo
- Pillow
Dataset & model details
- Dataset: Custom curated grain-kernel set — ~4,200 wheat and rice kernel images photographed under fixed lighting from mandi and mill samples, labelled into 5 classes: healthy, shriveled, broken, discolored, foreign material; stratified 80/20 split.
- Task: 5-class image classification per kernel; input = 224×224×3 kernel crop, output = defect-class probabilities; lot grade derived from class histogram.
- Model: ResNet-50 backbone (ImageNet pre-trained) → Dense(256, ReLU) → Dropout(0.4) → Dense(5, softmax); ~25.6M parameters.
- Metrics: Kernel accuracy ~94% (design target), grader agreement κ ~0.91 (design target), per-class precision/recall. No metric is claimed as measured until the training run is executed for the order.
Delivery information
Built-to-order project. Delivery timeline is shared after order confirmation based on current queue.
Support terms
Complete documentation, setup guide, and viva preparation included. Support for setup and explanation provided.
Download free synopsis (PDF)
Enter your name and WhatsApp number — the synopsis PDF downloads immediately. We may send occasional project updates on WhatsApp; no spam.