
More project photos (2)
The problem
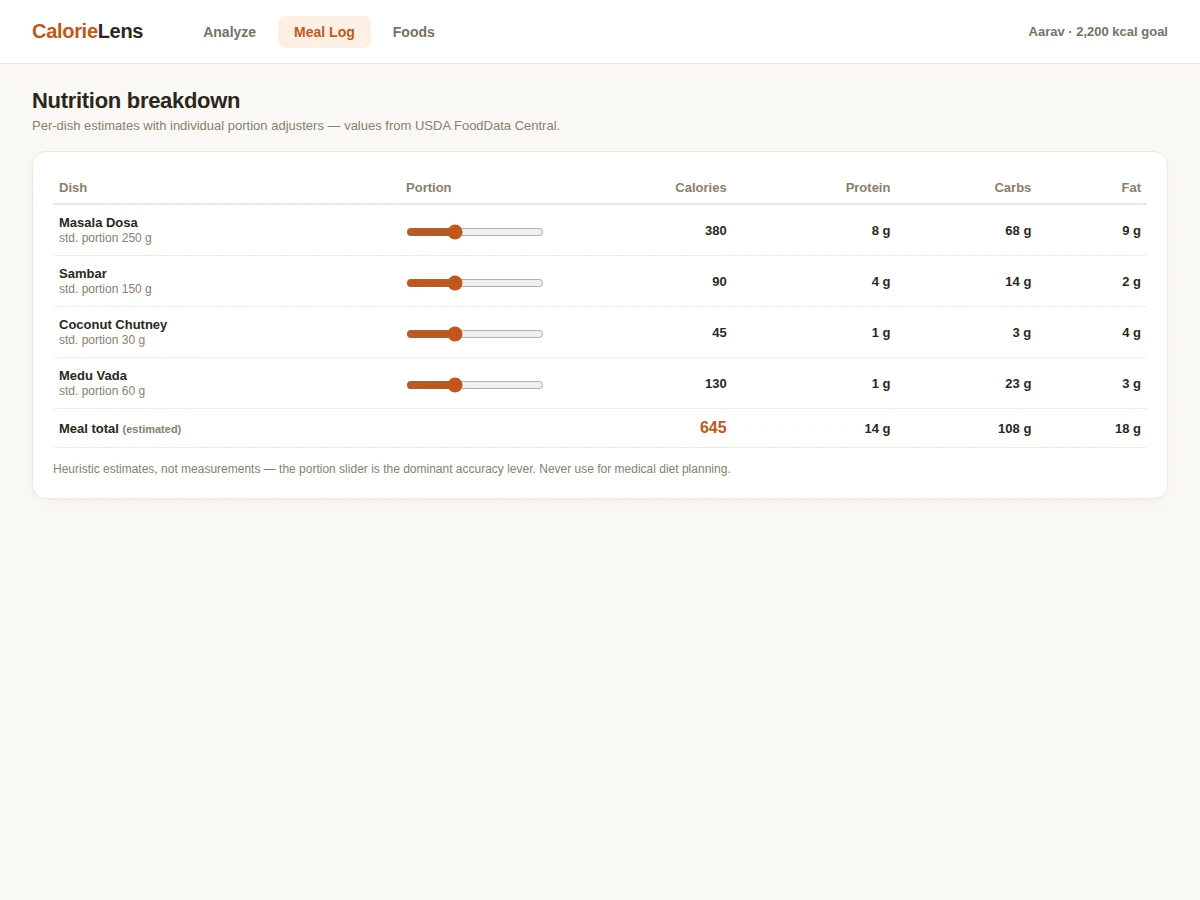
Logging every meal by hand is why diet-tracking apps get abandoned within a week — every entry costs effort, and users stop bothering. A photo is the lowest-friction input there is: point the camera at the plate and let the model do the logging. But fully automatic calorie estimation has a hard limit — portion size, the dominant source of error, cannot be measured from a single photo, and no model can weigh your food from pixels. The honest middle path is what this project takes: automatic dish recognition plus a transparent portion heuristic the user adjusts, with every calorie figure clearly labeled as an estimate. The model identifies the dish, a nutrition module applies per-100g reference values with a standard-portion assumption, and a slider lets the user correct the portion live. That transparency is also the project's strength as an academic build — it demonstrates classification, heuristic modeling and honest error discussion instead of pretending at a measurement it cannot make.
Frequently asked questions
- How accurate are the calorie numbers? They are heuristic estimates, not measurements: a standard-portion assumption multiplied by USDA per-100g values, adjustable with the portion slider. The report and Limitations sections state this explicitly — for real diet planning, consult a dietitian.
- What is Food-101? A public research dataset of 101,000 food images across 101 categories, widely used as the benchmark for food image classification. The model is fine-tuned on it, and the report documents its class coverage.
- Can it recognize Indian dishes? Only where they overlap with Food-101's categories — the dataset skews Western, so this is a known limitation the report covers, with notes on how the dataset could be extended.
- How does the portion slider work? The app starts from a standard-portion assumption for the recognized dish; the user moves the slider to match what is actually on the plate, and the estimate recomputes live.
- Is this project suitable for a final-year project? Yes. It suits B.E./B.Tech students in Computer Science, AI/ML and Data Science, demonstrating transfer learning, 101-class classification, heuristic modeling with real nutrition data, and an honest treatment of model limitations.
- What will I receive? Complete source code, trained weights (.h5), the USDA-based nutrition reference CSV, project report PDF, PPT presentation, viva Q&A document and a setup guide.
How it works
Dataset & model:
Dataset name: Food-101.
Source: publicly released research dataset for food image classification.
Task: 101-class image classification, followed by a heuristic calorie-mapping stage (not a learned calorie regressor).
Classes: 101 food categories (101,000 images total).
Model: EfficientNet-B0, fine-tuned from ImageNet transfer learning.
Input: food photo, resized to 224x224 and normalized.
Prediction: 101-way softmax over dish classes.
Output: top-3 dishes with confidence, estimated calories and macronutrient split from the USDA-based heuristic, daily meal log.
Evaluation metrics: top-1 accuracy, loss curves, confusion matrix for the recognition stage — computed by the training notebook on the validation split during the build. Calorie figures are heuristics and are not evaluated as measurements.
Design target: ~80%+ top-1 recognition accuracy on the validation split. This is a design target, not a measured claim; the notebook computes the actual score during the build.
Working:
- Training phase: an EfficientNet-B0 model pre-trained on ImageNet is fine-tuned on the Food-101 dataset for 101-category dish classification; the training notebook logs accuracy/loss curves and a confusion matrix during the build.
- Evaluation phase: recognition performance is evaluated on the validation split; calorie numbers are never presented as measured values — they are heuristic estimates by design.
- Inference phase: the user uploads or captures a food photo in the demo app; the preprocessing pipeline resizes and normalizes the image to 224x224.
- The model classifies the dish into one of the 101 Food-101 categories and the app shows the top-3 predictions with confidence scores.
- The nutrition module maps the top prediction to USDA FoodData Central per-100g values and applies the standard-portion assumption to produce the calorie estimate and macronutrient split.
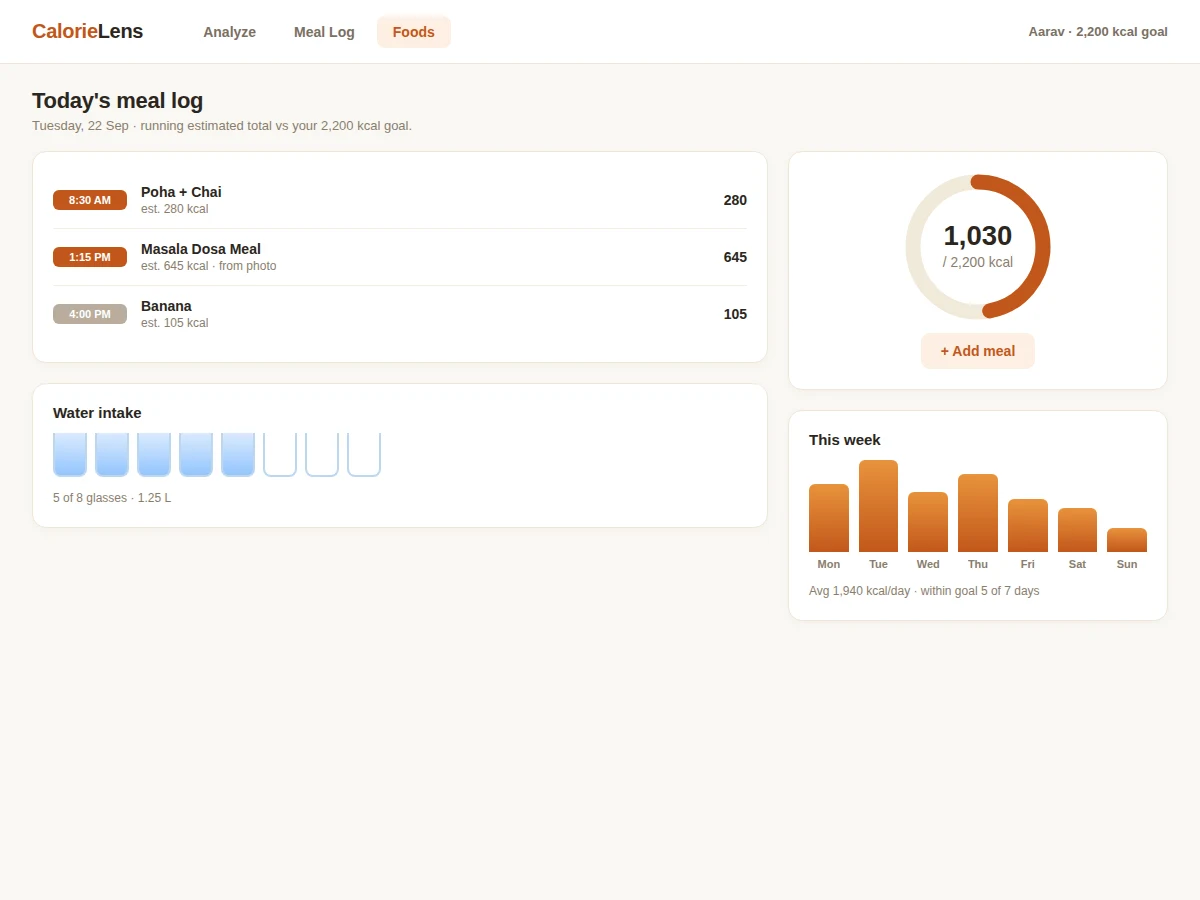
- The user adjusts the portion slider; the estimate and macronutrient split recompute live, and accepted estimates accumulate in the daily meal log.
Specifications:
Model | EfficientNet-B0, fine-tuned (ImageNet transfer learning)
Dataset | Food-101 — 101,000 images across 101 food categories
Design target | ~80%+ top-1 recognition accuracy on the validation split (design target, not a measured claim)
Calorie estimation | Heuristic: standard-portion assumption x USDA per-100g values, user-adjustable — estimates, not measurements
Input | Phone photo, resized to 224x224
Meal log | Daily estimated calorie total
Platform | Windows/Linux/macOS, Python 3.10; demo web app
Project features
[Dish Recognition across 101 Categories] (implemented) — The fine-tuned EfficientNet-B0 CNN identifies the dish in a single food photo across all Food-101 classes.
[Top-3 Predictions] (implemented) — The demo shows the three most likely dishes with confidence scores, so near-miss classifications stay visible.
[Heuristic Calorie Estimation] (implemented) — The nutrition module multiplies USDA per-100g values by a standard-portion assumption; every figure is presented as an estimate, never a measurement.
[Adjustable Portion Slider] (implemented) — The user corrects the portion to match what is actually on the plate, and the calorie and macronutrient estimates recompute live.
[USDA Nutrition Reference] (implemented) — Ships a CSV of per-100g values from USDA FoodData Central backing the calorie mapping.
[Daily Meal Log] (implemented) — Accepted estimates accumulate into a running daily estimated-calorie total in the demo app.
[Grad-CAM Overlays] (implemented) — Heatmaps show which part of the plate drove the dish prediction, giving an explainability story for the viva.
[Training & Evaluation Notebook] (implemented) — Logs accuracy/loss curves and a confusion matrix on the validation split during the build.
What is included
Complete source code (training, evaluation, inference, Flask app, nutrition module)
Trained model weights (.h5)
USDA-based nutrition reference CSV
Project report PDF (methodology, Food-101 analysis, heuristic-calorie design, honest error discussion)
PPT presentation for the final review
Viva Q&A preparation document (CNNs, transfer learning, multi-class metrics, Food-101, heuristic modeling)
Setup guide (environment, dependencies, dataset download steps)
Limitations & prerequisites
Calorie numbers are heuristic estimates, not measurements — never use them for medical diet planning or clinical decisions.
Mixed dishes, occluded portions and dishes outside Food-101's 101 categories (the set skews Western, with limited Indian food) degrade recognition and estimates.
Portion estimation is the dominant error source: the same dish photographed differently yields a different estimate — the report discusses this openly.
All reported figures are design targets from the buyer's own training run; no pre-measured accuracy is claimed.
This is a demonstration and learning tool, not a certified diet or medical product.
Components & software requirements
Python 3.10
TensorFlow and Keras
OpenCV, NumPy, pandas
Matplotlib, Seaborn
Flask
Food-101 dataset (public; download scripts included)
GPU recommended for training (cloud-GPU guidance included); inference runs on CPU
Delivery information
Built to order — the source code, trained weights, project report, PPT and viva Q&A are prepared fresh for each buyer after the order is placed. The delivery schedule is confirmed at order time, and includes time for training the model and assembling the complete documentation kit.
Support terms
- Environment and dependency setup guidance, including dataset download steps.
- Viva preparation support covering transfer learning, multi-class metrics, Food-101 and heuristic modeling.
- Explanation of the training notebook output and how to present the heuristic design honestly in the review.
- Discussion of feasible customizations before ordering, such as extending the dataset with Indian dishes or adding a macro-goal tracker.