
More project photos (3)
The problem
Standby generators fail at the worst moment for three boring reasons: the day tank ran dry, the crank battery was flat, or the service was overdue — and nobody logged any of it. Facilities check generators weekly with a clipboard, which means fuel theft, rising consumption and a dying battery all go unnoticed between visits. The engineering gap is continuous logging: fuel level on a curve, load in kW, runtime accumulating honestly, and battery voltage watched daily, with the controller raising service alerts from the data instead of the calendar. This project builds that on an ESP32: a float sensor in the fuel tank, a CT on the output cable, an hour-meter in firmware, and a dashboard with consumption trends and maintenance flags.
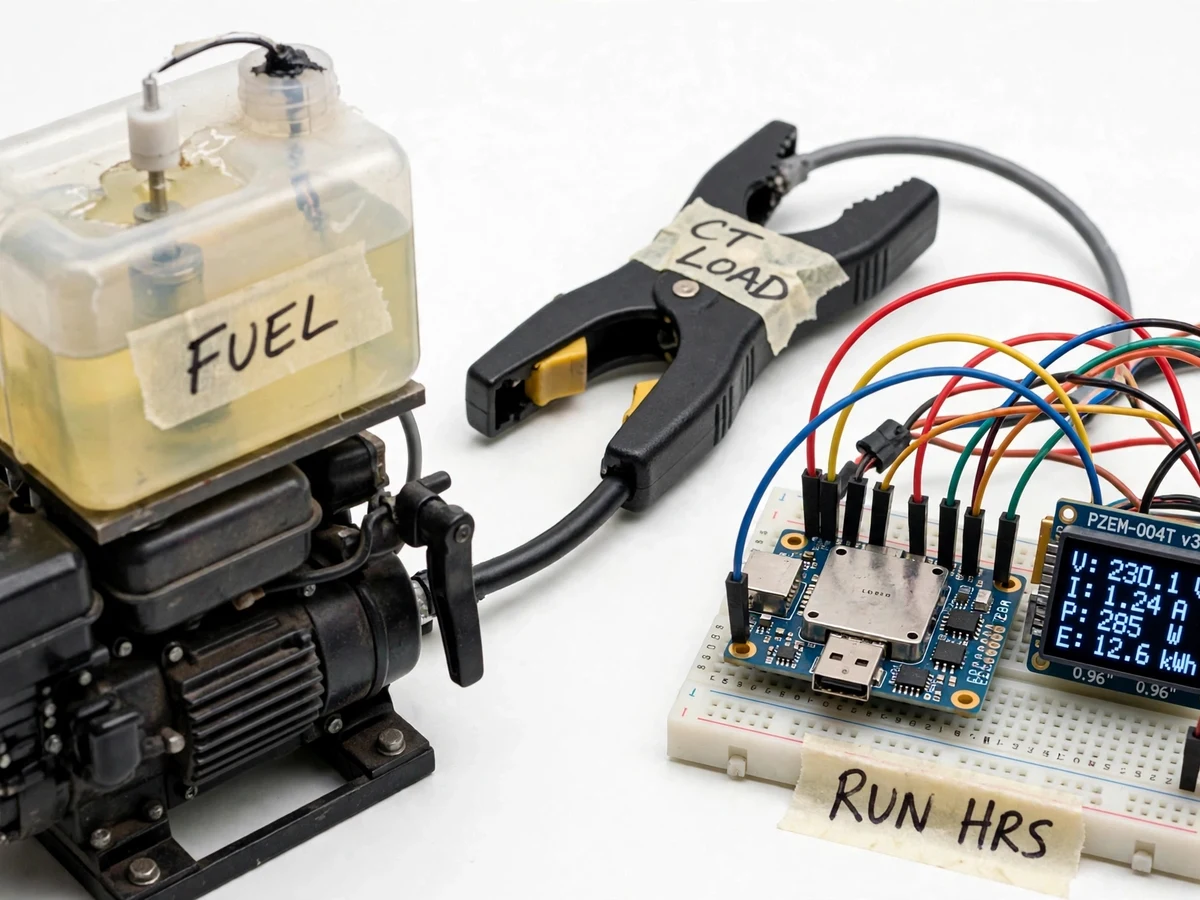
Float sensor in the day tank reports fuel level continuously.
Follow the working sequence
How it works
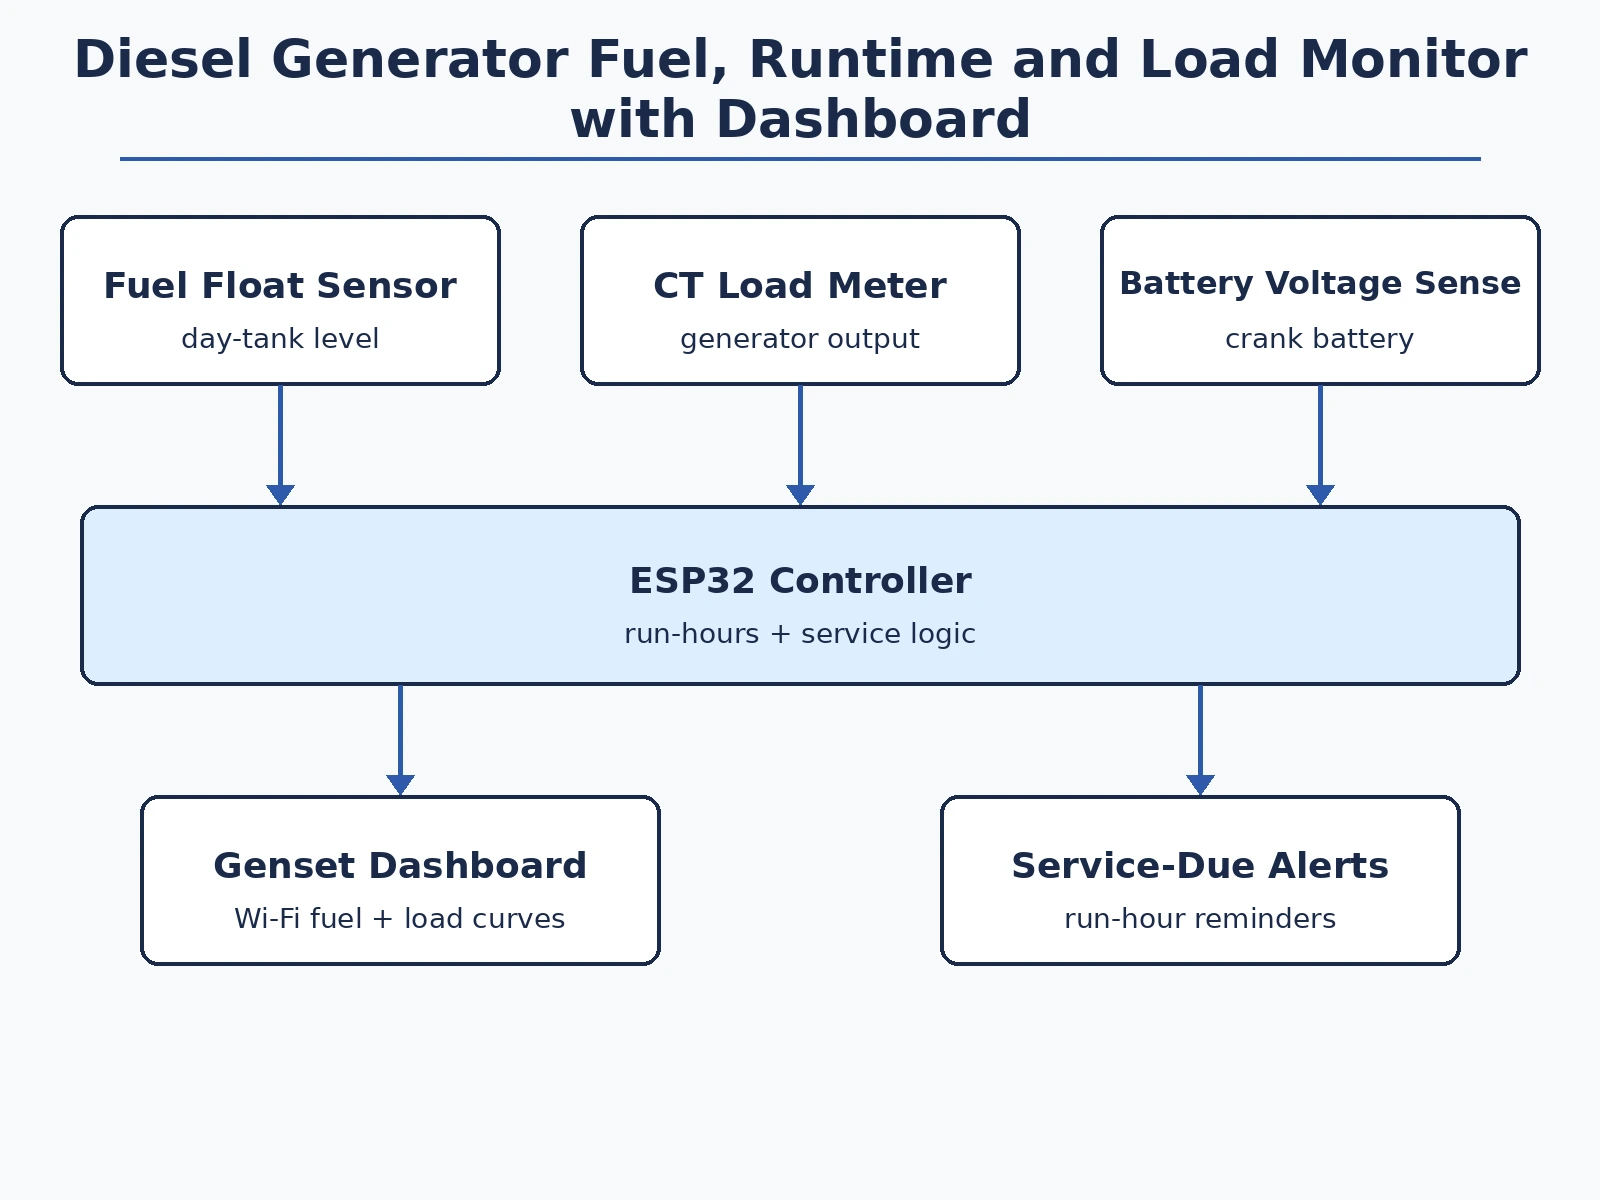
- The float sensor reports day-tank level and the CT reports output current; the ESP32 samples both continuously.
- Firmware detects starts and stops from the load/CT signature and accumulates run-hours only while the set is actually running.
- Fuel consumed per session is derived from level change; with the metered kWh it yields litres-per-kWh for the report.
- Battery voltage is sampled on a daily schedule and trended; a configured floor raises the charge-check alert.
- Service counters (oil, filters, general) decrement with run-hours and alert at their thresholds.
- All of it streams to the dashboard; start/stop, refuelling and alert events log with timestamps.
Tech stack:
- ESP32 development board (Wi-Fi telemetry)
- Fuel float level sensor (day tank)
- CT clamp on generator output (load)
- PZEM energy meter module (kWh, optional per build)
- Battery voltage divider (crank battery)
- Model diesel genset (demo rig)
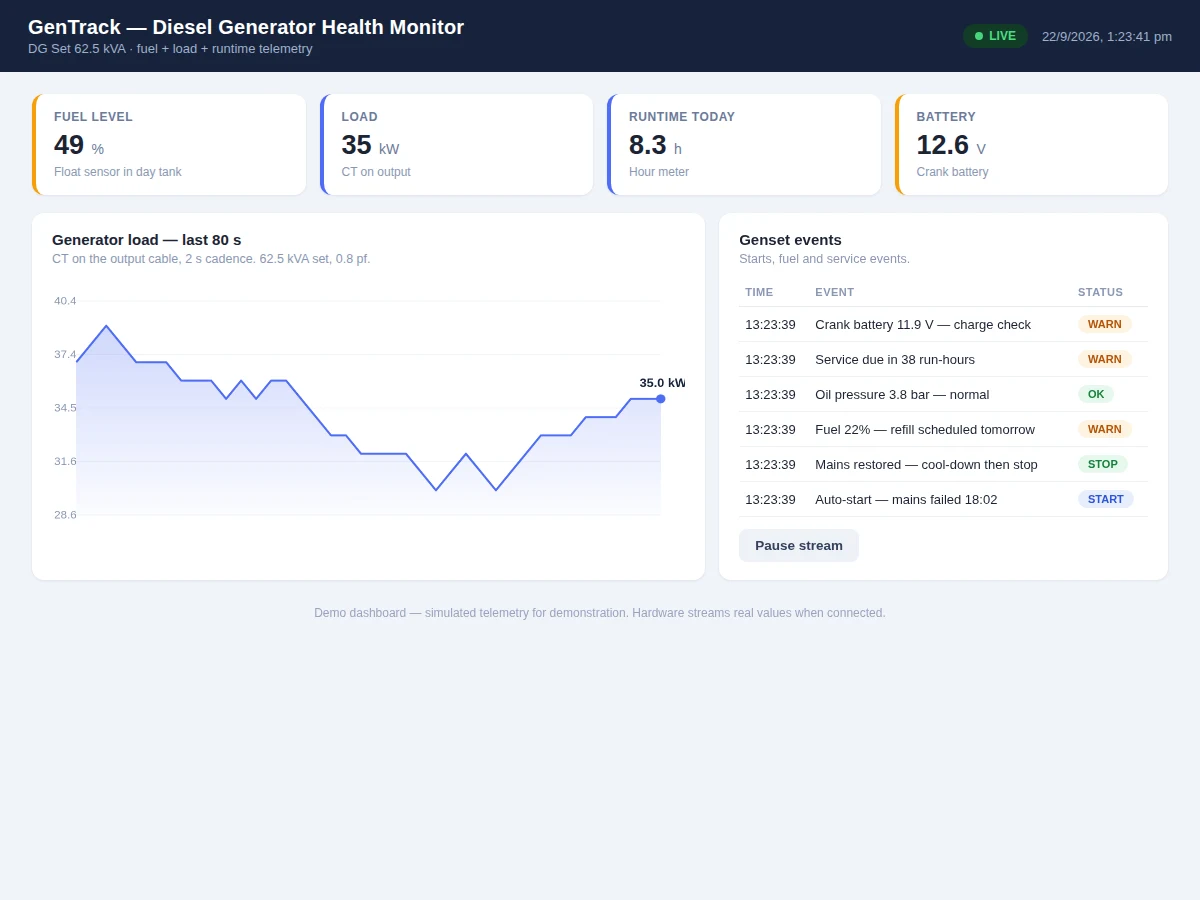
- Single-page genset dashboard (HTML/JS)
| Parameter | Value |
|---|---|
| Controller | ESP32, Wi-Fi dashboard sync |
| Fuel sensing | Float sensor in day tank; level in %, calibrated at build |
| Load sensing | CT on output cable; kW computed in firmware |
| Runtime | Firmware hour-meter from start/stop detection |
| Battery | Crank-battery voltage divider; daily sampling with trend |
| Service alerts | From run-hours: oil, filter, general (configurable intervals) |
| Dashboard | Fuel/load curves, runtime, battery trend, event log |
| Demo | Model genset; a real DG set needs proper sensor mounting (guidance included) |
Project features
- [Fuel-level sensing] A float sensor in the day tank reports level continuously; the dashboard shows the curve and flags low-fuel and sudden drops.
- [Load metering] A CT on the generator output meters kW in real time, so consumption can be discussed per unit of energy delivered.
- [Runtime logging] Firmware accumulates true run-hours from start/stop detection — the honest basis for service intervals.
- [Crank-battery watch] Battery voltage is sampled daily; a sagging trend raises a charge-check alert before the no-start morning.
- [Service-due alerts] Oil, filter and general service reminders fire from run-hours, not from guesswork.
- [Genset dashboard] Fuel curve, load curve, runtime totals, battery trend and a start/stop/service event log on one screen.
- [Theft/drop flagging] A fuel drop with the set stopped flags as a possible siphoning event in the log.
What is included
- Working genset-monitor prototype (float sensor, CT, battery sense, ESP32)
- Model diesel genset demo rig
- Complete firmware source code (sensing, hour-meter, service logic, dashboard sync)
- Genset dashboard with consumption trends and alerts
- Circuit and wiring documentation
- Fuel-sensor calibration procedure (buyer-run tank calibration)
- Project report PDF (genset O&M, instrumentation, logged data from the buyer's run)
- PPT presentation for final review
- Viva Q&A preparation document (CT metering, hour-meters, battery health, service logic)
Limitations & prerequisites
- Demonstrated on a model genset; fitting sensors to a real DG set needs proper mechanical mounting and electrical safety practice — guidance included, high-voltage work excluded.
- Fuel-consumption figures are derived from level change and metered energy — indicative, not certified fuel-flow metering.
- Float sensors have dead bands at the top and bottom of travel; the calibration documents the usable range.
- Service intervals in firmware are configurable defaults from typical practice, not manufacturer specifications for any particular set.
- Battery voltage alone cannot fully diagnose battery health; it flags the trend for investigation.
Frequently Asked Questions
How does it know the generator is running?
Start/stop is detected from the CT/load signature — current flowing means the set is under load — and the firmware hour-meter accumulates only during true run time.
How is fuel consumption calculated?
Level drop per session from the float sensor, divided by the kWh metered in that session, gives litres per kWh — the number that exposes a thirsty or under-loaded set.
What flags fuel theft?
A level drop while the set is stopped and no refuelling was logged is flagged in the event log as a possible siphoning event for the facility manager to check.
Why watch the crank battery daily?
A flat battery is the most common no-start cause. The daily voltage trend shows the decline weeks before the morning it fails to crank.
Does it work on a real generator?
The sensing and logic transfer directly; the deliverables include mounting guidance. High-voltage terminations stay with a qualified electrician — the project does not ask students to do that work.
Is this project suitable for a final-year project?
Yes — for Electrical, Electronics and IoT & Embedded programs. It is practical O&M instrumentation: fuel, load, runtime and battery in one honest logging system. Suitable for B.E./B.Tech final-year projects in Electrical, Electronics and IoT & Embedded Systems.
Components & software requirements
- ESP32 development board (Wi-Fi telemetry)
- Fuel float level sensor (day tank)
- CT clamp on generator output (load)
- PZEM energy meter module (kWh, optional per build)
- Battery voltage divider (crank battery)
- Model diesel genset (demo rig)
- Single-page genset dashboard (HTML/JS)
Delivery information
Built-to-order project. Delivery timeline is shared after order confirmation based on current queue.
Support terms
Complete documentation, setup guide, and viva preparation included. Support for setup and explanation provided.
Download free synopsis (PDF)
Enter your name and WhatsApp number — the synopsis PDF downloads immediately. We may send occasional project updates on WhatsApp; no spam.