
More project photos (4)
The problem
Diabetes Risk Prediction with XGBoost (PIMA Indians Dataset) is a machine-learning project that estimates diabetes risk from 8 clinical measurements using a gradient-boosted classifier trained on 768 real patient records. The project exists because most student ML builds stop at fitting a model to a clean CSV, while real clinical data is messy: in this dataset, roughly 17% of entries in the five affected fields are zeros that actually mean "missing", and ignoring them silently poisons every model trained on top. Diabetes screening matters because early risk flags let people change course before complications set in, yet clinicians still assess risk from thresholds and experience rather than from patterns across thousands of cases. The gap this build demonstrates is honest end-to-end ML on genuinely imperfect data — audit the missing values, impute them properly, handle the 500:268 class imbalance, tune XGBoost with stratified validation, and state clearly that the result is an educational prototype, never a diagnostic device.
Enters the 8 clinical measurements into the risk calculator.
Follow the working sequence
How it works
A set of 8 measurements enters the pipeline, zeros in the five affected fields are replaced with training-set medians, and the cleaned vector is passed to a trained XGBoost ensemble of decision trees. Each tree adds its vote to a running log-odds total, the total is squashed through a logistic function into a probability between 0 and 1, and that probability is shown as a risk band with a per-feature breakdown of which measurements pushed it up or down. Before any of that, training runs in a strict order: the 768 records are audited for zero-as-missing entries, the data is split into 80% train and 20% holdout with the class balance preserved, XGBoost is fitted with early stopping while hyperparameters are grid-searched under stratified 5-fold cross-validation, and the final model is scored once on the untouched holdout to produce accuracy, ROC-AUC and the confusion matrix. The web demo then serves inference only — it never retrains or changes the model.
- The 768-record PIMA dataset is loaded and audited: zeros in glucose, blood pressure, skin thickness, insulin and BMI are flagged as missing values.
- Flagged zeros are replaced with the training-split median of each feature (medians computed on train only, no leakage into validation).
- The data is split 80/20 into train and holdout with stratification, preserving the 65/35 class balance in both splits.
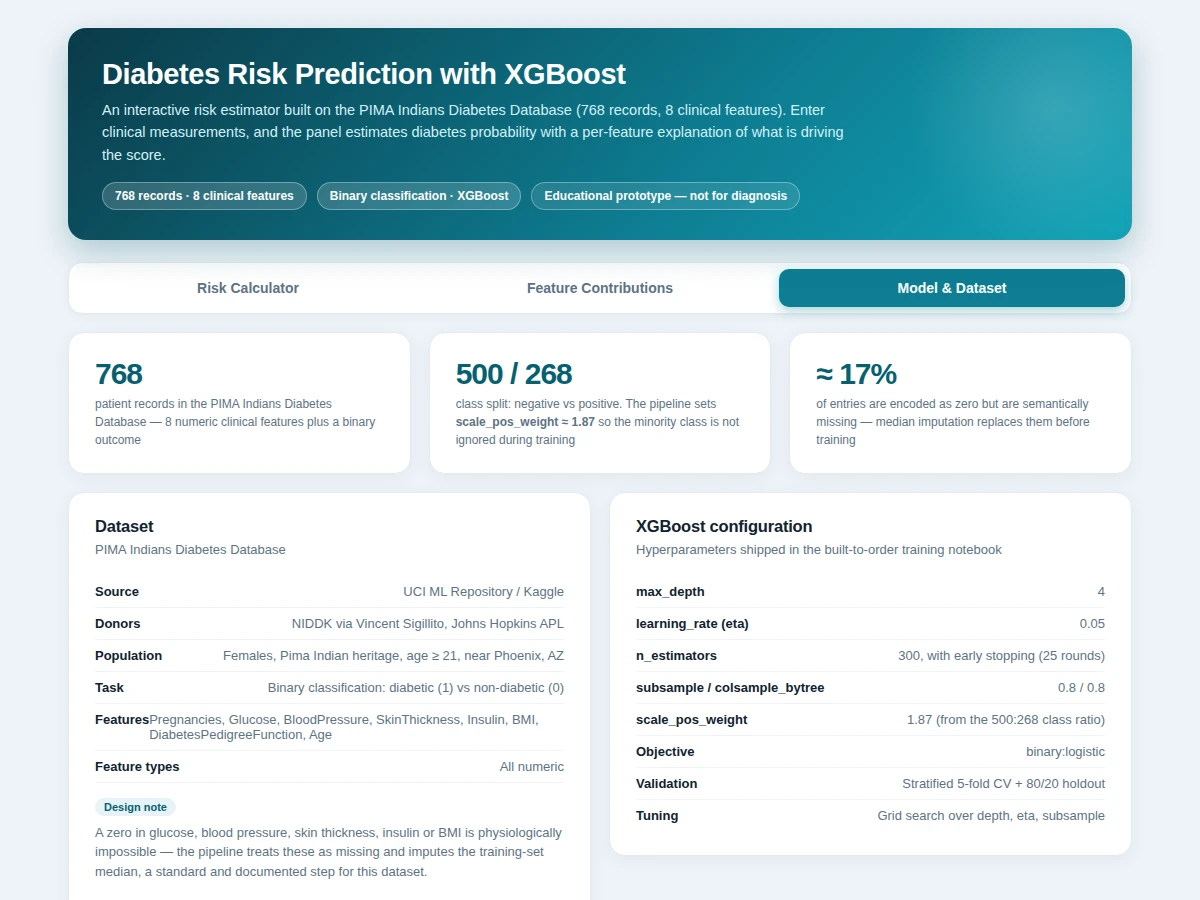
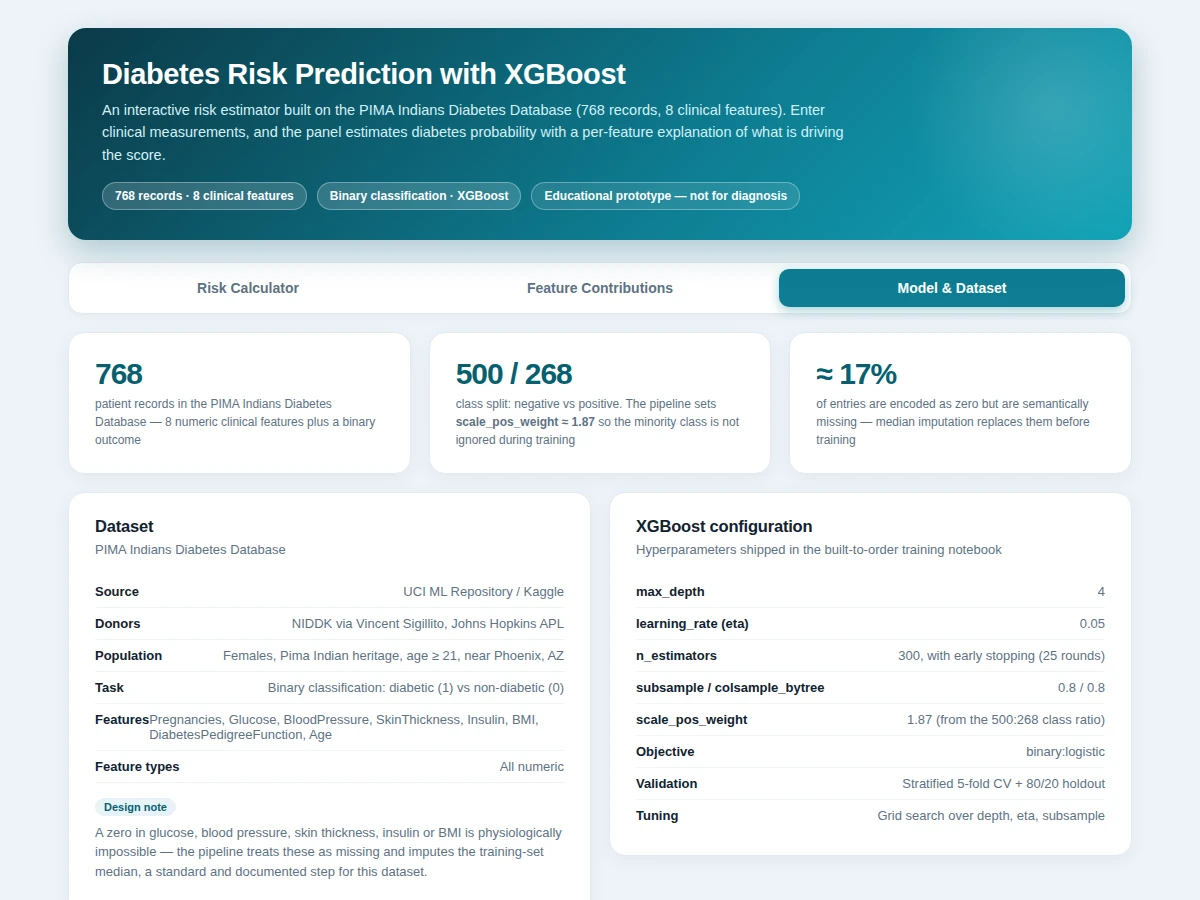
- An XGBoost classifier (max_depth 4, learning rate 0.05, 300 estimators, subsample/colsample_bytree 0.8, scale_pos_weight ~1.87) is trained with early stopping after 25 rounds without validation improvement.
- Hyperparameters are grid-searched under stratified 5-fold cross-validation on the training split.
- The final model is evaluated once on the untouched holdout: accuracy, ROC-AUC, precision, recall, F1 and confusion matrix go into the report.
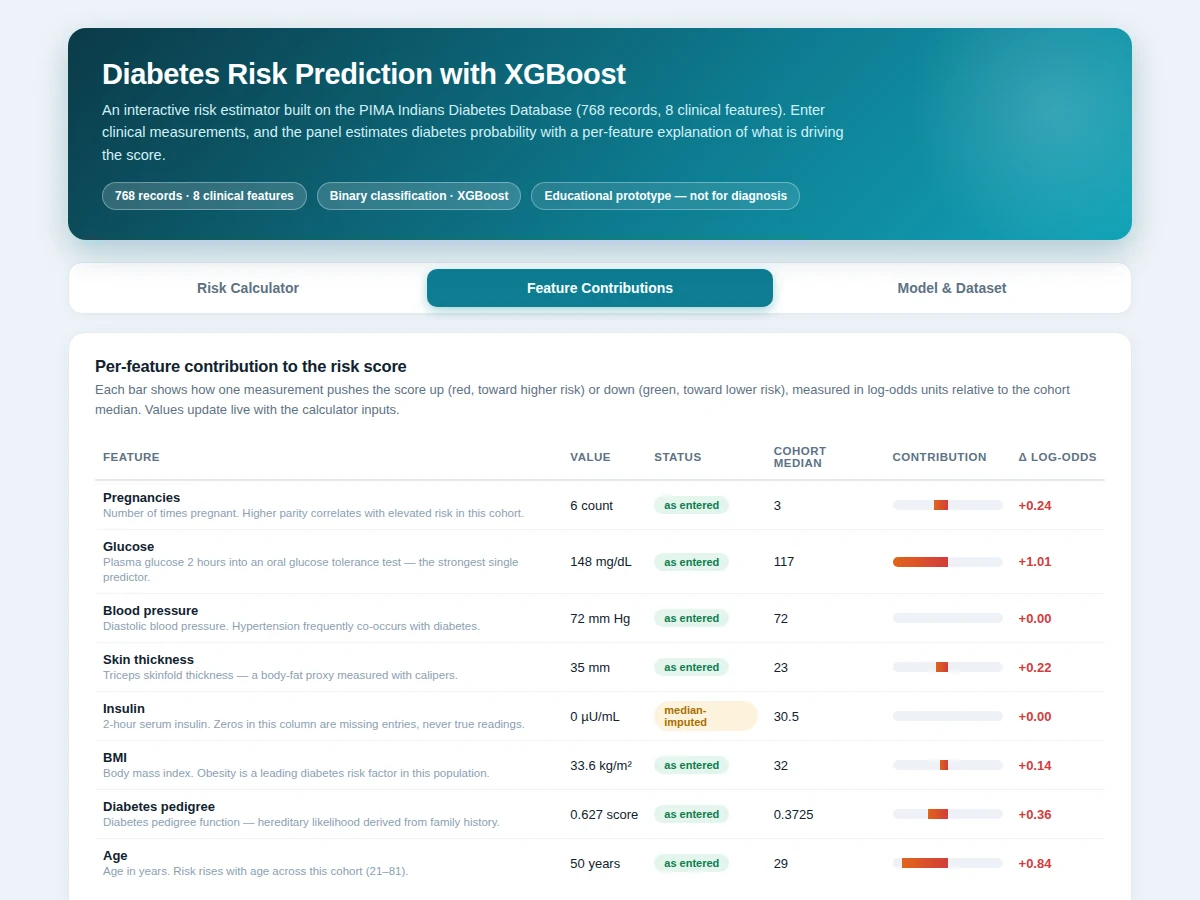
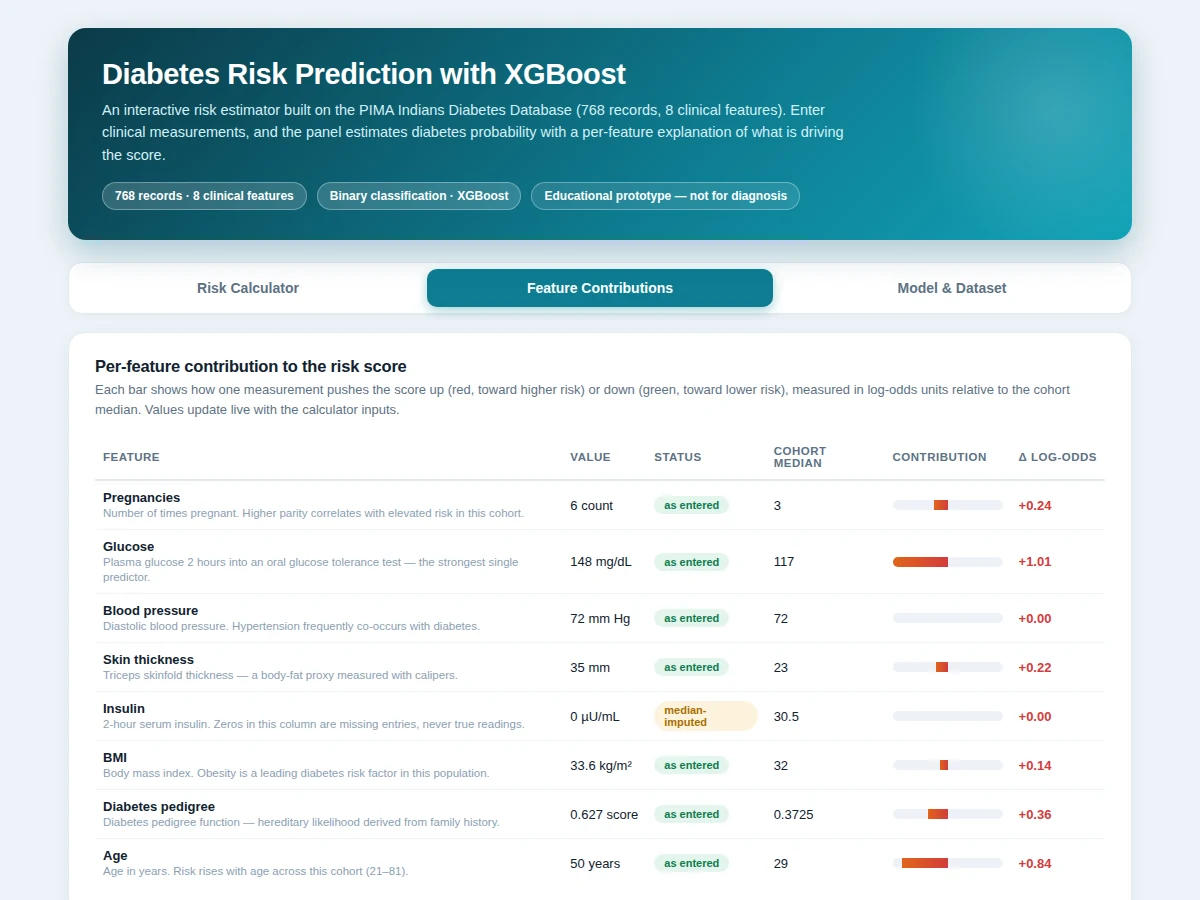
- In the web demo, 8 entered measurements pass through the same imputation, the model outputs a probability, and the app shows the risk band plus per-feature contributions.
Tech stack:
- Python 3
- XGBoost
- scikit-learn
- pandas · NumPy
- Jupyter Notebook
- Matplotlib
- PIMA Indians Diabetes dataset
- HTML · CSS · JavaScript demo
Dataset & model details
- Dataset: PIMA Indians Diabetes Database — 768 patient records, 8 numeric clinical features (Pregnancies, Glucose, BloodPressure, SkinThickness, Insulin, BMI, DiabetesPedigreeFunction, Age) plus a binary outcome (1 = tested positive for diabetes, 0 = negative). Donated to the UCI ML Repository by Vincent Sigillito (Johns Hopkins APL) from National Institute of Diabetes and Digestive and Kidney Diseases data; also mirrored on Kaggle. Population: females of Pima Indian heritage, age 21 years or older, living near Phoenix, Arizona. Class split: 500 negative / 268 positive.
- Task: Binary classification — input = the 8 clinical measurements, output = probability of a positive diabetes test.
- Model: XGBoost gradient-boosted tree classifier (max_depth 4, learning_rate 0.05, n_estimators 300 with early stopping at 25 rounds, subsample 0.8, colsample_bytree 0.8, scale_pos_weight ~1.87, objective binary:logistic), hyperparameters chosen by grid search under stratified 5-fold cross-validation.
- Metrics: Holdout accuracy ~0.77, ROC-AUC ~0.83, precision ~0.68, recall ~0.64, F1 ~0.66 (all design targets for the built-to-order training run — the report carries the actual measured figures after the run), plus a confusion matrix. No accuracy is claimed as measured until the training run is executed for the order.
| Parameter | Value |
|---|---|
| Records | 768 patient records |
| Features | 8 numeric clinical measurements |
| Classes | 2 (0 = non-diabetic, 1 = diabetic) |
| Class split | 500 negative / 268 positive |
| Model | XGBoost binary classifier, 300 trees (design target) |
| Holdout accuracy | ~0.77 (design target, not a measured claim) |
| ROC-AUC | ~0.83 (design target, not a measured claim) |
| Training time | Approximately 1–3 min on a laptop CPU (expected) |
| Inference | Approximately 5 ms per prediction on CPU (expected) |
| Model file | Under 1 MB (expected) |
| Demo | Single-file web app, runs offline after download |
Project features
The build centres on four working capabilities: a median-imputation pipeline that repairs the PIMA dataset's zero-as-missing entries before any training happens; a tuned XGBoost binary classifier whose hyperparameters, class weighting and early stopping are all documented and reproducible; stratified evaluation that reports accuracy, ROC-AUC, precision, recall, F1 and a confusion matrix on an untouched holdout; and an interactive web demo that estimates risk for any set of 8 measurements and explains the score feature by feature. Around those sit the supporting pieces a final-year submission needs — a feature-importance ranking drawn from the trained model, a training notebook that runs end to end, and report/PPT/Q&A documentation that lets the student defend every choice in the viva. Every capability listed below is implemented in the shipped notebook and demo rather than promised as future work, so the page, the abstract and the deliverables all match.
- [Median-imputation pipeline] Zeros in glucose, blood pressure, skin thickness, insulin and BMI are flagged as missing (a 0 in these fields is physiologically impossible) and replaced with the training-split median of each feature, computed on the train split only so no information leaks into validation.
- [Tuned XGBoost classifier] A gradient-boosted tree ensemble (max_depth 4, learning rate 0.05, 300 estimators, subsample and colsample_bytree 0.8) with early stopping on validation log-loss, grid-searched over depth, learning rate and subsample.
- [Class-imbalance handling] The 500:268 negative-to-positive split is countered with scale_pos_weight set to approximately 1.87, so the minority diabetic class is not ignored during training.
- [Stratified evaluation suite] Accuracy, ROC-AUC, precision, recall, F1 and a confusion matrix are computed on a 20% stratified holdout that the model never sees during training; every figure in the report is the actual run result.
- [Feature-importance ranking] Gain-based importance from the trained trees shows which measurements drive the splits, with an explanation of why glucose and BMI are expected to dominate.
- [Interactive risk demo] A single-file web app takes the 8 clinical measurements, shows an estimated probability with a risk gauge, and breaks the score into per-feature contributions that update live.
- [Viva-ready documentation] Report, PPT and Q&A covering gradient boosting, imputation choices, hyperparameter reasoning and the medical-prototype limits, written so the student can defend the pipeline end to end.
What is included
- Complete training & evaluation Jupyter notebook (imputation, tuning, evaluation, plots)
- Trained XGBoost model file with the preprocessing pipeline
- Interactive web risk demo with gauge and per-feature contribution view
- Confusion matrix, ROC curve and feature-importance plots
- Project report PDF (background, data-quality analysis, methodology, results, limitations)
- PPT presentation for final review
- Viva Q&A preparation document (gradient boosting, imputation, hyperparameters, metrics, medical-AI limits)
Limitations & prerequisites
- This is an academic prototype and is not a medical device: it must never replace professional diagnosis or clinical decision-making, and no clinical accuracy is claimed.
- 768 records from one specific population (Pima Indian females aged 21+) do not represent the general population — performance on other cohorts is unknown.
- The ~0.77 accuracy and ~0.83 ROC-AUC figures are design targets for the training run, stated honestly; the report documents the actual achieved figures after training.
- Median imputation is a principled but imperfect repair for the zero-as-missing entries — it discards whatever signal the missingness itself carried.
- With only 768 records and 8 features, the model can overfit; the holdout metrics already reflect this small-data reality.
- The on-page demo runs a simplified built-in scoring model for illustration — the shipped XGBoost model and its exact metrics come from the real training run.
Frequently Asked Questions
Which dataset is used and why?
The PIMA Indians Diabetes Database: 768 patient records with 8 numeric clinical features and a binary diabetes outcome, donated via the UCI ML Repository from National Institute of Diabetes and Digestive and Kidney Diseases data and mirrored on Kaggle. It is used because it is the classic small, real, messy clinical dataset — its zero-as-missing quirk forces genuine data-quality work instead of fitting a model to a clean CSV.
How are the zeros in the data handled?
Zeros in glucose, blood pressure, skin thickness, insulin and BMI are treated as missing values, not measurements, because a true zero in any of these fields is physiologically impossible. Each flagged zero is replaced with the training-split median of that feature, with medians computed on the training split only so no information leaks into validation. This median-imputation step is documented in the notebook and the report, and it is the project's main original-data talking point.
Which model is used and how is it tuned?
An XGBoost gradient-boosted tree classifier with max_depth 4, learning rate 0.05, 300 estimators, subsample and colsample_bytree 0.8, and scale_pos_weight ~1.87 to counter the 500:268 class imbalance. Hyperparameters are chosen by grid search under stratified 5-fold cross-validation, with early stopping after 25 rounds without validation improvement. Every choice is recorded with its reasoning in the report for the viva.
Is the accuracy guaranteed?
No — no accuracy is guaranteed or claimed as measured before the training run executes. The ~0.77 holdout accuracy and ~0.83 ROC-AUC quoted are design targets based on what XGBoost typically achieves on this dataset, and the report will carry the actual measured figures from the run prepared for the order. Any listing that promises a fixed accuracy for this dataset before training is not being honest about how ML works.
Is this project suitable for a final-year project?
Yes — for AI & Machine Learning, Computer Science and IT programs. It demonstrates the full supervised-learning workflow that examiners look for: data auditing and imputation, class-imbalance handling, gradient-boosted tree training with cross-validated tuning, holdout evaluation with proper metrics, and a working inference demo, all wrapped in honest documentation of what the model can and cannot do.
Components & software requirements
- Python 3
- XGBoost
- scikit-learn
- pandas · NumPy
- Jupyter Notebook
- Matplotlib
- PIMA Indians Diabetes dataset
- HTML · CSS · JavaScript demo
Dataset & model details
- Dataset: PIMA Indians Diabetes Database — 768 patient records, 8 numeric clinical features (Pregnancies, Glucose, BloodPressure, SkinThickness, Insulin, BMI, DiabetesPedigreeFunction, Age) plus a binary outcome (1 = tested positive for diabetes, 0 = negative). Donated to the UCI ML Repository by Vincent Sigillito (Johns Hopkins APL) from National Institute of Diabetes and Digestive and Kidney Diseases data; also mirrored on Kaggle. Population: females of Pima Indian heritage, age 21 years or older, living near Phoenix, Arizona. Class split: 500 negative / 268 positive.
- Task: Binary classification — input = the 8 clinical measurements, output = probability of a positive diabetes test.
- Model: XGBoost gradient-boosted tree classifier (max_depth 4, learning_rate 0.05, n_estimators 300 with early stopping at 25 rounds, subsample 0.8, colsample_bytree 0.8, scale_pos_weight ~1.87, objective binary:logistic), hyperparameters chosen by grid search under stratified 5-fold cross-validation.
- Metrics: Holdout accuracy ~0.77, ROC-AUC ~0.83, precision ~0.68, recall ~0.64, F1 ~0.66 (all design targets for the built-to-order training run — the report carries the actual measured figures after the run), plus a confusion matrix. No accuracy is claimed as measured until the training run is executed for the order.
Delivery information
Built-to-order project. Delivery timeline is shared after order confirmation based on current queue.
Support terms
Complete documentation, setup guide, and viva preparation included. Support for setup and explanation provided.
Download free synopsis (PDF)
Enter your name and WhatsApp number — the synopsis PDF downloads immediately. We may send occasional project updates on WhatsApp; no spam.