
More project photos (3)
The problem
Diabetes screening starts with numbers a basic health checkup already collects — glucose, blood pressure, BMI, age — yet those numbers are usually read one at a time against fixed thresholds. Machine learning can weigh them together: the Pima Indians Diabetes dataset (768 patient records, 8 clinical features) is the classic teaching ground for exactly this, small enough to train in seconds but rich enough to teach imputation, class imbalance, model comparison and recall-oriented evaluation. Students often jump straight to fitting models and skip the data-quality work — this dataset punishes that, because several columns contain medically impossible zeros that must be treated as missing. This project does the full pipeline honestly: cleaning, scaling, SMOTE balancing, stratified evaluation of four classifiers, and a web demo that turns the trained logistic-regression model into an interactive risk calculator with per-factor contribution bars.
Enters the 8 clinical measurements into the web demo.
Follow the working sequence
How it works
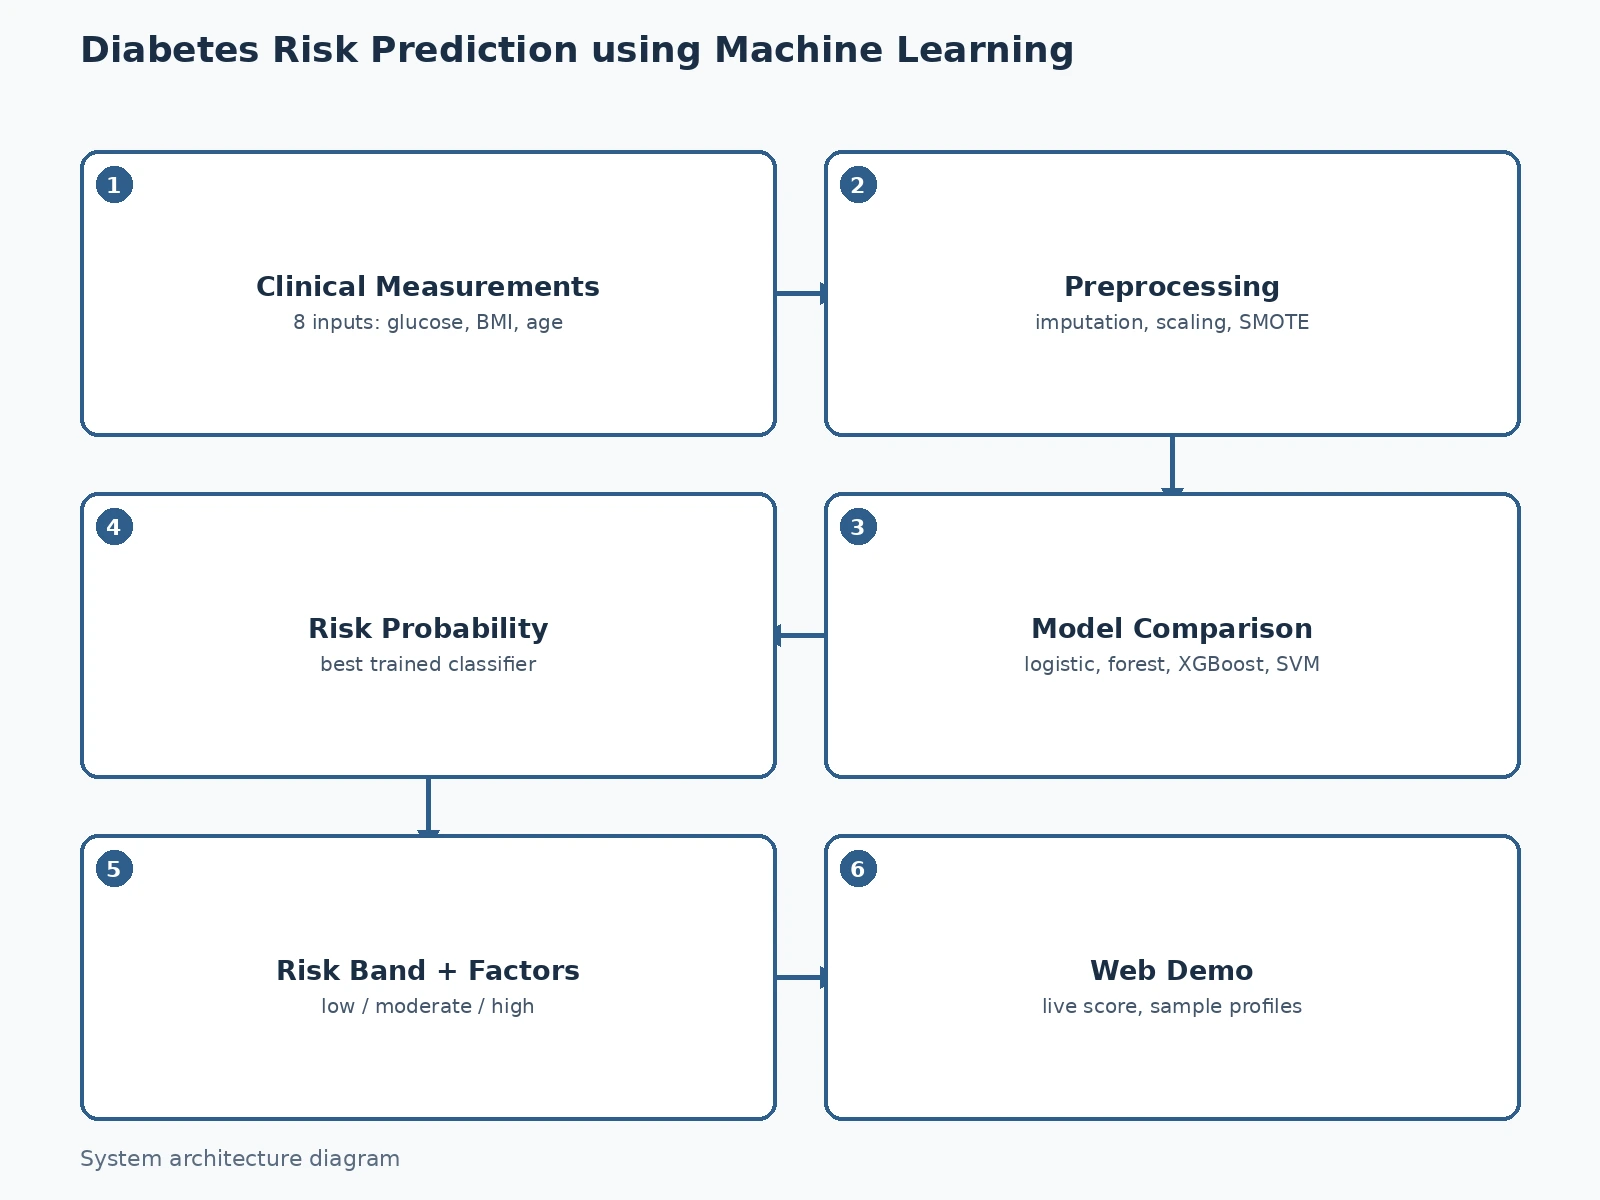
- The Pima Indians Diabetes dataset (768 records, 8 features + Outcome) is loaded; zeros in Glucose, BloodPressure, SkinThickness, Insulin and BMI are flagged as missing and median-imputed.
- Features are standardized; the training fold is balanced with SMOTE because only ~35% of records are diabetic.
- Logistic regression, random forest, XGBoost and SVM train on a stratified 80/20 split with 5-fold cross-validation for hyperparameter selection.
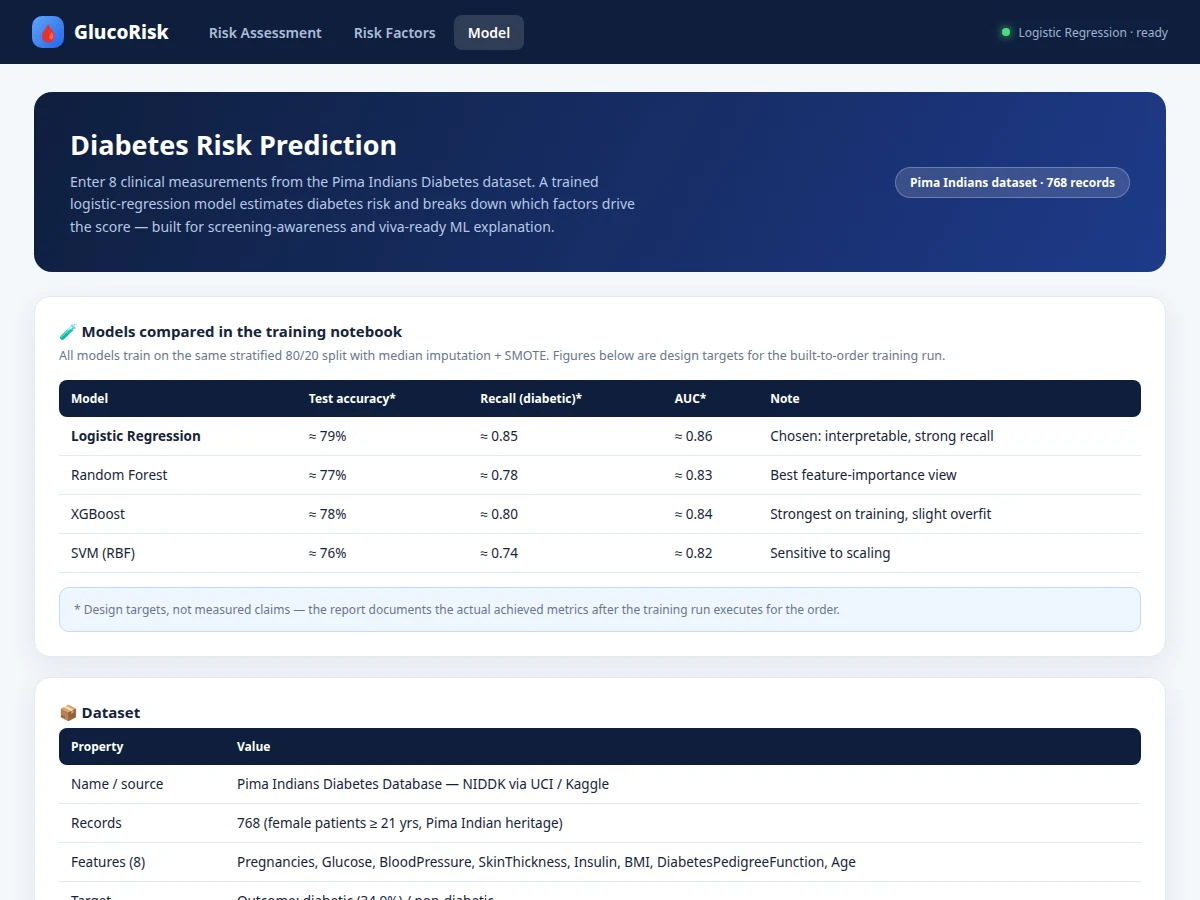
- Models are compared on the held-out test set using accuracy, precision, recall, F1 and ROC-AUC; logistic regression is selected for the demo for its interpretability and strong recall.
- The winning pipeline (imputer → scaler → classifier) is serialized for deployment.
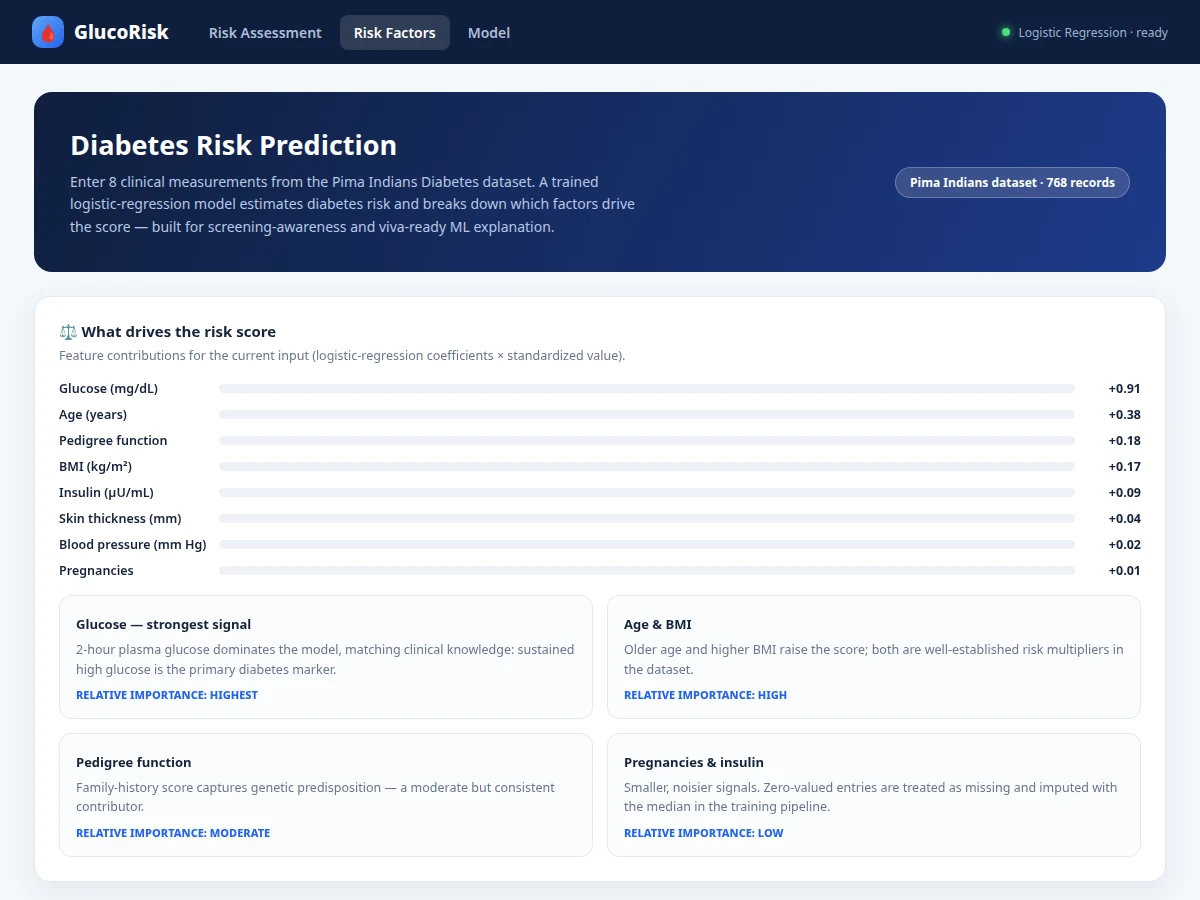
- In the web demo, entered measurements flow through the identical pipeline and the app renders the risk probability, risk band and per-factor contribution bars.
Tech stack:
- Python 3, scikit-learn
- XGBoost (comparison model)
- Pandas, NumPy (data handling)
- Matplotlib, Seaborn (EDA plots)
- imbalanced-learn SMOTE
- Jupyter Notebook (training)
- HTML/CSS/JavaScript (web demo)
- Pima Indians Diabetes dataset
Dataset & model details
- Dataset: Pima Indians Diabetes Database — collected by the National Institute of Diabetes and Digestive and Kidney Diseases, via UCI/Kaggle. 768 records (female patients ≥ 21 years, Pima Indian heritage); 8 features: Pregnancies, Glucose, BloodPressure, SkinThickness, Insulin, BMI, DiabetesPedigreeFunction, Age; binary Outcome (diabetic ≈ 34.9%).
- Task: Binary classification; input = 8 standardized clinical measurements, output = probability of diabetes.
- Model: Logistic regression (selected for the demo) after comparing random forest, XGBoost and SVM; pipeline = median imputation → StandardScaler → SMOTE (train fold) → classifier.
- Metrics: Test accuracy (design target ≈ 80%), precision/recall/F1, ROC-AUC (design target ≈ 0.86); recall on the diabetic class reported explicitly. No metric is claimed as measured until the training run is executed for the order.
| Parameter | Value |
|---|---|
| Input | 8 numeric clinical measurements |
| Records | 768 (diabetic ≈ 35%, non-diabetic ≈ 65%) |
| Test accuracy | ≈ 80% (design target, not a measured claim) |
| ROC-AUC | ≈ 0.86 (design target) |
| Training time | Under 2 minutes on a laptop CPU (expected) |
| Inference | Under 5 ms per prediction (expected) |
| Model file | Under 1 MB serialized pipeline (expected) |
| Demo | Single-file web app, runs offline after download |
Project features
- [Risk prediction web demo] Enter the 8 clinical measurements; the app returns a live diabetes-risk probability, a low/moderate/high band, and which factors drive the score.
- [Per-factor explanations] Each prediction breaks down feature contributions (coefficient × standardized value), so the demo teaches as well as predicts.
- [Full training notebook] Missing-value treatment, scaling, SMOTE, stratified train/test split, and model training in one reproducible Jupyter notebook.
- [Four-model comparison] Logistic regression, random forest, XGBoost and SVM evaluated on identical splits with accuracy, precision, recall, F1 and AUC.
- [Recall-oriented evaluation] The report explains why recall on the diabetic class matters more than raw accuracy for screening, and how the threshold choice reflects it.
- [Sample profiles] One-click high-risk and low-risk patient profiles for demoing the app and discussing feature effects in the viva.
- [Exported trained model] Serialized pipeline (imputer + scaler + classifier) so the demo scores with the real trained model.
What is included
- Complete training & evaluation Jupyter notebook (EDA, preprocessing, SMOTE, model comparison)
- Trained pipeline file (imputer + scaler + classifier)
- Interactive risk-prediction web demo with factor explanations
- EDA plots, ROC curves and per-model metric tables
- Project report PDF (background, medical context, methodology, results, ethics note)
- PPT presentation for final review
- Viva Q&A preparation document (logistic regression, SMOTE, recall vs precision, imputation)
Limitations & prerequisites
- Educational screening demonstration, not a medical device — it must never be presented as a diagnostic tool, and the report states this explicitly.
- The dataset covers one specific population (Pima Indian women ≥ 21); generalization to other populations is not claimed.
- ≈ 80% accuracy / 0.86 AUC are design targets for the training run, stated honestly — the report documents the actual achieved figures after training.
- Impossible-zero entries are imputed, which is a modeling choice with documented trade-offs, not ground truth.
- The demo assumes plausible clinical ranges; out-of-range inputs are clamped with a warning.
Frequently Asked Questions
Which dataset is used and why?
The Pima Indians Diabetes Database — 768 records with 8 clinical features, from the NIDDK via UCI/Kaggle. It is the standard benchmark for this task, trains in seconds, and its known data-quality quirks (impossible zeros) make preprocessing a genuine part of the project.
Why is recall emphasized over accuracy?
In screening, a missed diabetic case (false negative) costs more than a false alarm. The report explains this trade-off and shows how the classification threshold is chosen to favor recall on the positive class.
How does the web demo compute risk?
Your 8 measurements pass through the exact training pipeline — median imputation, standardization, then the trained logistic-regression model — and the app shows the probability, risk band and each feature's contribution to the score.
Why was logistic regression chosen over XGBoost?
On this small dataset the models score within a few points of each other; logistic regression wins for the demo because its coefficients give honest, explainable per-factor contributions. The report shows the full comparison table.
Can this diagnose diabetes?
No — and the project never claims it. It is an educational risk-awareness demo; real diagnosis requires clinical tests and a doctor. This limitation is stated on the demo and in the report.
Is this project suitable for a final-year project?
Yes — for Computer Science, IT and AI/ML programs. It covers data cleaning, imbalance handling, model comparison, evaluation discipline and an interactive deployment. Suitable for B.E./B.Tech final-year projects in Computer Science, IT and AI & Machine Learning.
Components & software requirements
- Python 3, scikit-learn
- XGBoost (comparison model)
- Pandas, NumPy (data handling)
- Matplotlib, Seaborn (EDA plots)
- imbalanced-learn SMOTE
- Jupyter Notebook (training)
- HTML/CSS/JavaScript (web demo)
- Pima Indians Diabetes dataset
Dataset & model details
- Dataset: Pima Indians Diabetes Database — collected by the National Institute of Diabetes and Digestive and Kidney Diseases, via UCI/Kaggle. 768 records (female patients ≥ 21 years, Pima Indian heritage); 8 features: Pregnancies, Glucose, BloodPressure, SkinThickness, Insulin, BMI, DiabetesPedigreeFunction, Age; binary Outcome (diabetic ≈ 34.9%).
- Task: Binary classification; input = 8 standardized clinical measurements, output = probability of diabetes.
- Model: Logistic regression (selected for the demo) after comparing random forest, XGBoost and SVM; pipeline = median imputation → StandardScaler → SMOTE (train fold) → classifier.
- Metrics: Test accuracy (design target ≈ 80%), precision/recall/F1, ROC-AUC (design target ≈ 0.86); recall on the diabetic class reported explicitly. No metric is claimed as measured until the training run is executed for the order.
Delivery information
Built-to-order project. Delivery timeline is shared after order confirmation based on current queue.
Support terms
Complete documentation, setup guide, and viva preparation included. Support for setup and explanation provided.
Download free synopsis (PDF)
Enter your name and WhatsApp number — the synopsis PDF downloads immediately. We may send occasional project updates on WhatsApp; no spam.