
More project photos (3)
The problem
Retailers collect plenty of customer data but still market to everyone the same way — one discount blast for the bargain hunter and the premium buyer alike. Segmentation fixes this by grouping customers with similar behavior so each group gets the right message, but hand-defining segments is guesswork. K-means clustering finds them from the data: customers close together in feature space land in the same segment, and the analyst's job shifts from inventing groups to interpreting them. This project applies that workflow to the classic Mall Customer Segmentation dataset — 200 customers described by annual income and spending score. It covers the full unsupervised pipeline: feature standardization, choosing k via the elbow method and silhouette scores, K-means fitting with k-means++ initialization, cluster profiling, and persona naming with concrete marketing actions per segment. The demo makes the abstract concrete: drag the k slider and watch clusters split and merge in real time.
200-customer Kaggle dataset with annual income, spending score and age.
Follow the working sequence
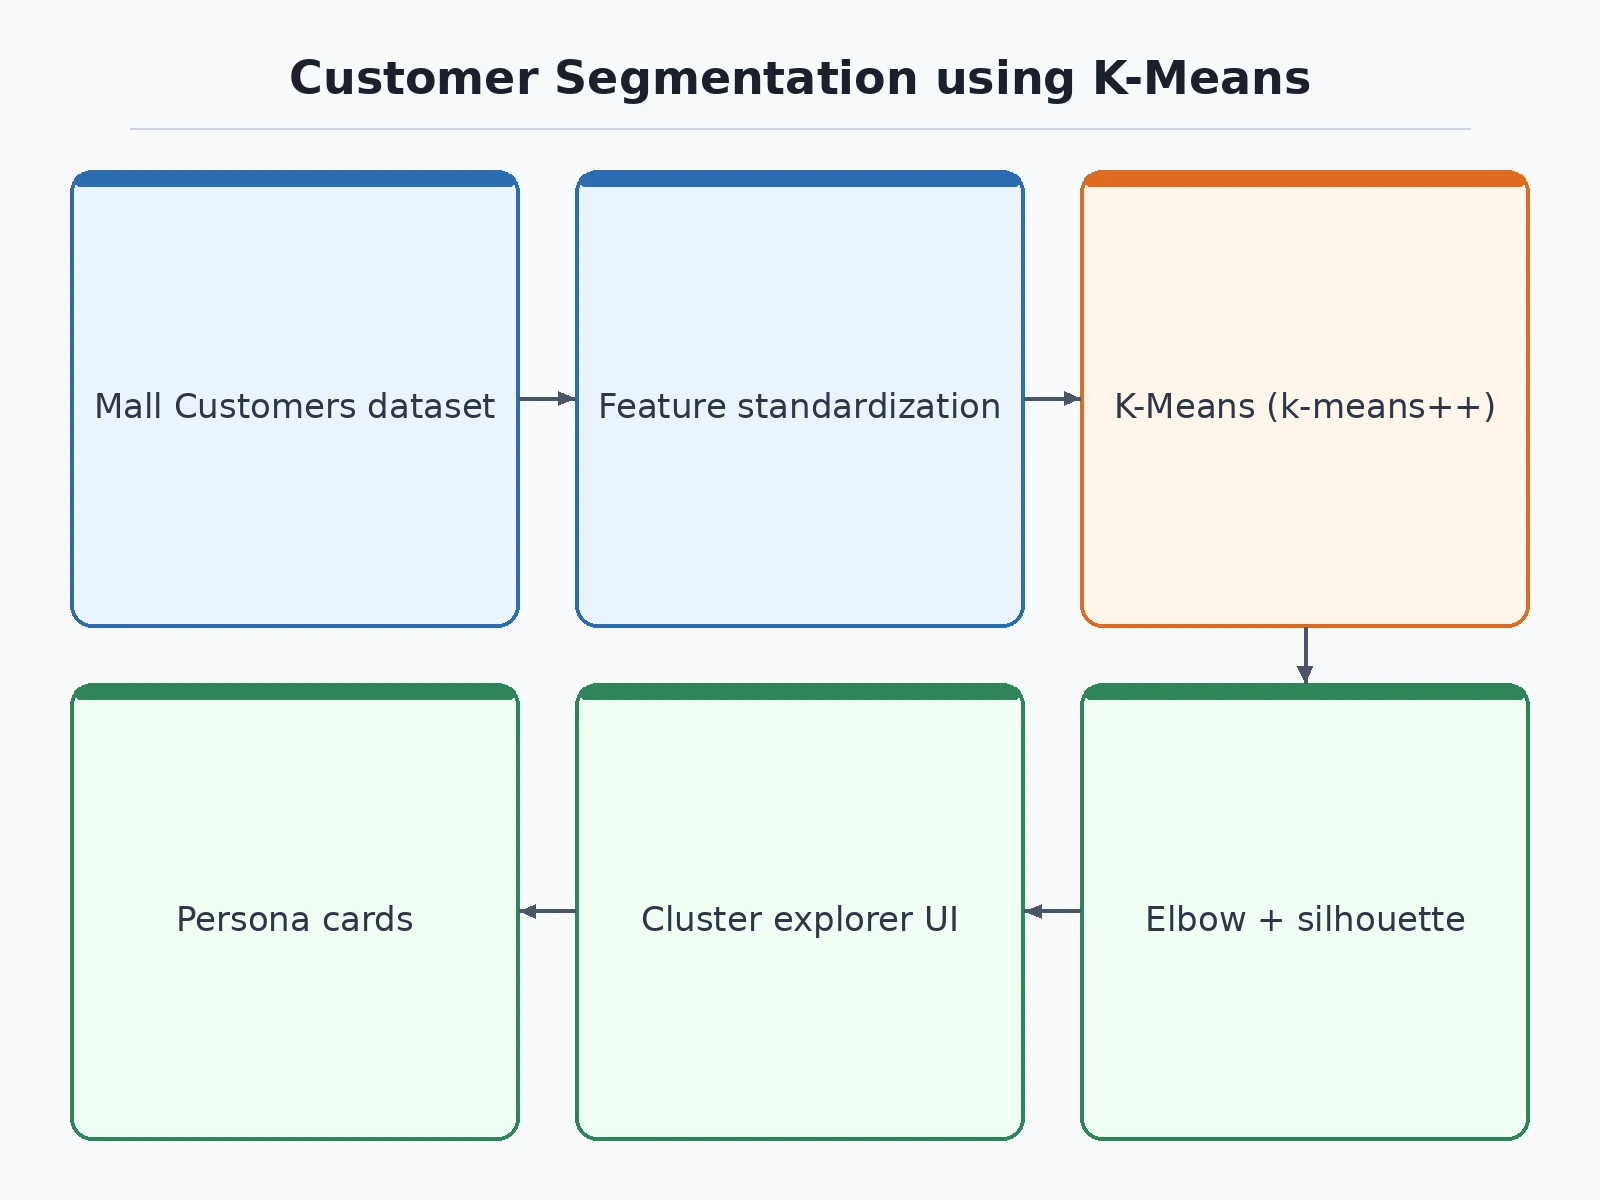
How it works
- The Mall Customers CSV is loaded; Annual Income and Spending Score are standardized with StandardScaler.
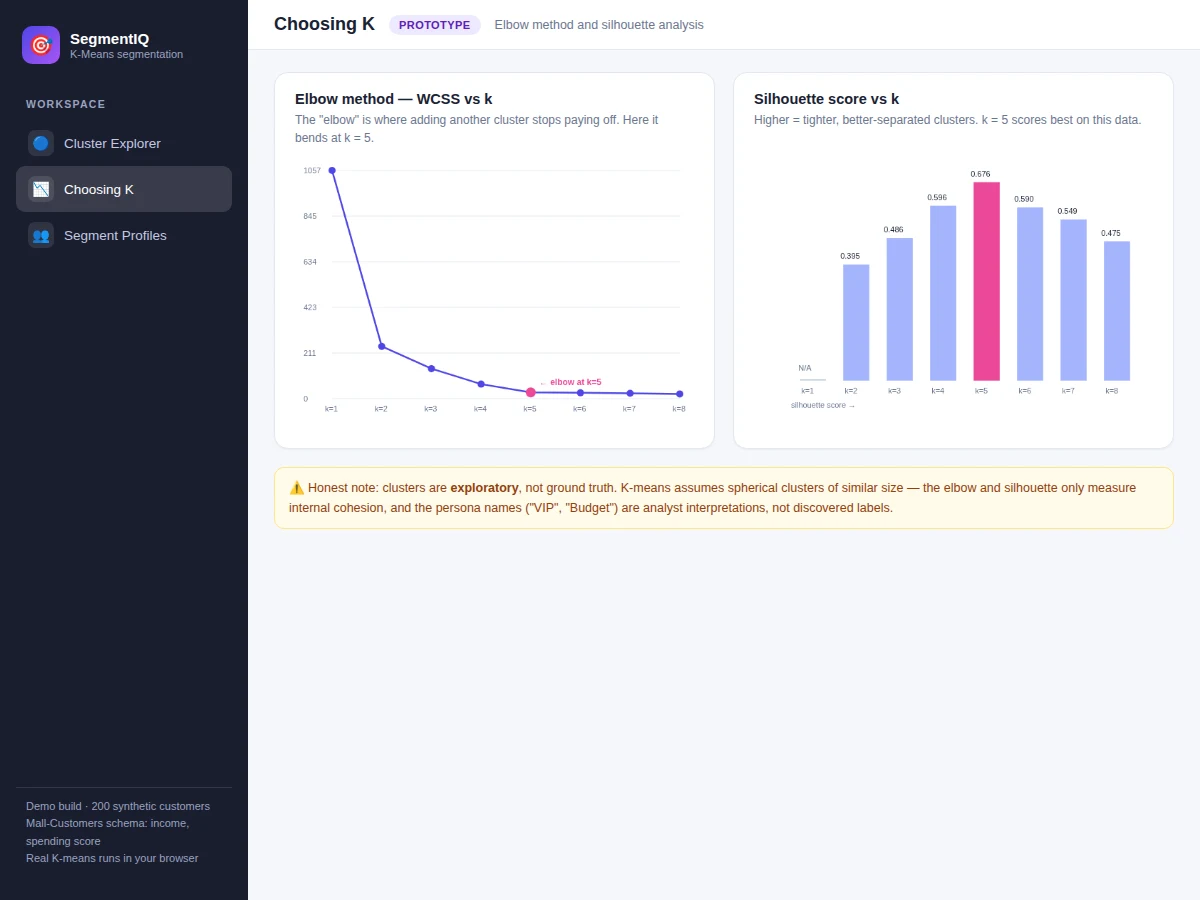
- K-means is run for k = 1–8 and WCSS recorded; the elbow plot identifies k = 5.
- Silhouette scores for each k confirm 5 as the best-separated clustering.
- Final KMeans (k = 5, k-means++ init) assigns every customer to a segment; centroids are mapped back to original units.
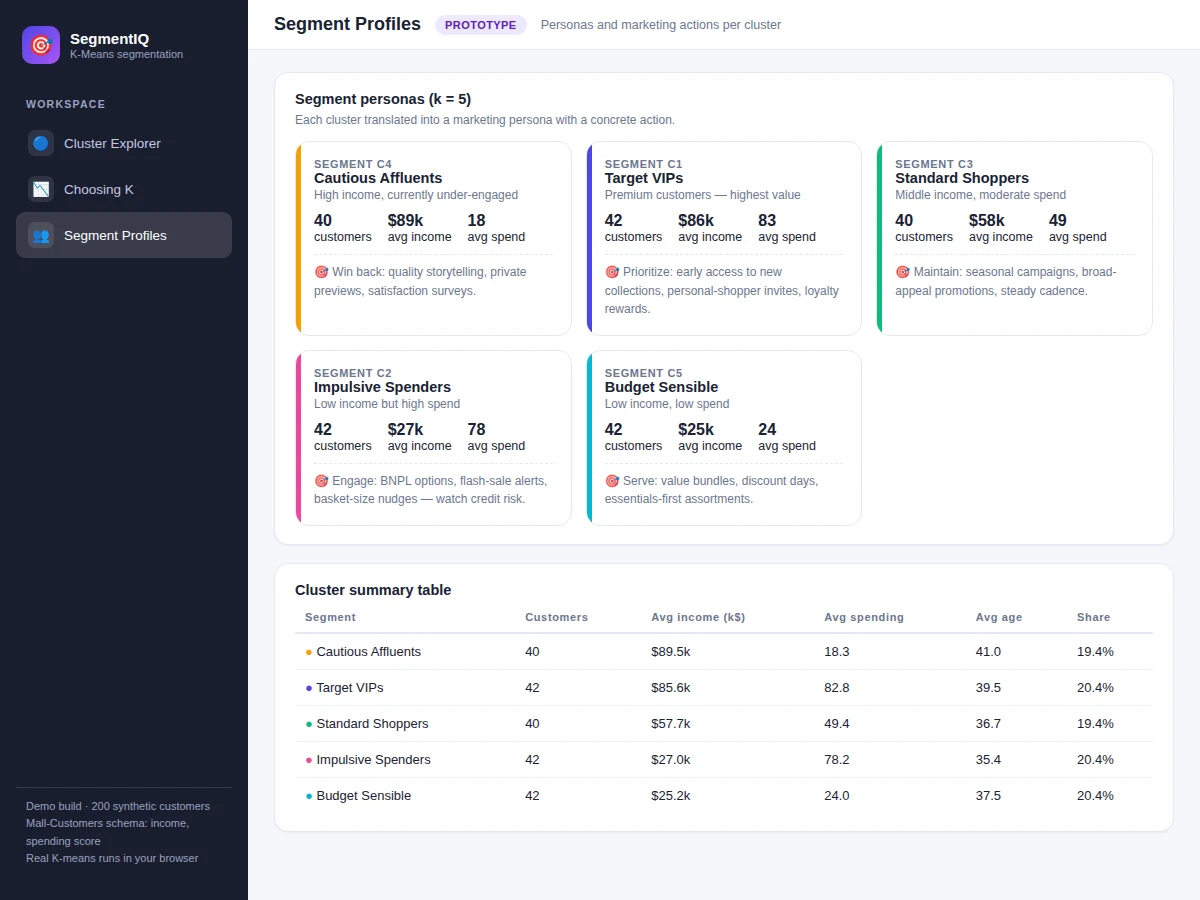
- Each cluster is profiled — size, mean income, mean spending, mean age — and interpreted as a marketing persona.
- The demo serves the explorer, persona cards and the new-customer predictor from the fitted model.
Tech stack:
- Python 3.10, scikit-learn (KMeans, StandardScaler, silhouette_score)
- pandas, NumPy (dataset handling, profiling tables)
- Matplotlib, Seaborn (EDA, elbow plot, silhouette chart, cluster scatter)
- Flask demo app (cluster explorer, personas, predictor)
- Jupyter notebook (buyer-run full pipeline)
- Mall Customer Segmentation dataset (Kaggle, 200 customers)
| Parameter | Value |
|---|---|
| Dataset | Mall Customer Segmentation Data (Kaggle vjchoudhary7): 200 customers; CustomerID, Gender, Age, Annual Income (k$), Spending Score (1–100) |
| Algorithm | K-means, k = 5, k-means++ initialization, standardized features |
| K selection | Elbow method (WCSS, k = 1–8) + silhouette analysis |
| Segments | 5 personas: Target VIPs, Impulsive Spenders, Budget Sensible, Cautious Affluents, Standard Shoppers |
| Evaluation | WCSS/inertia and silhouette score — internal metrics (unsupervised: no accuracy applies) |
| Input | Customer income + spending score (predictor); full CSV (pipeline) |
| Output | Segment labels, persona cards, profile tables, new-customer assignment |
| Demo | Interactive explorer with live k slider, personas, predictor |
Project features
- [Mall Customers pipeline] Loading, cleaning and standardization of the 200-record Kaggle dataset (CustomerID, Gender, Age, Annual Income, Spending Score) with EDA plots.
- [Elbow method analysis] Within-cluster sum of squares computed for k = 1–8, with the elbow at k = 5 identified and plotted for the report.
- [Silhouette analysis] Per-k silhouette scores confirming k = 5 as the best-separated choice, with the metric explained from first principles.
- [K-means clustering] scikit-learn KMeans with k-means++ seeding on standardized income and spending features, centroids and labels exported.
- [Interactive cluster explorer] Drag the k slider (2–8) and watch the scatter plot re-cluster live, with centroids, WCSS and silhouette updating.
- [Segment personas] Each of the 5 clusters profiled into a named persona — Target VIPs, Impulsive Spenders, Budget Sensible, Cautious Affluents, Standard Shoppers — with a concrete marketing action.
- [New-customer predictor] Enter an income and spending score to get the nearest-centroid segment assignment with its persona.
- [Evaluation notebook] The full pipeline as a reproducible notebook: scaling, elbow, silhouette, profiling and persona tables.
What is included
- Complete source code (pipeline, clustering, profiling, Flask demo)
- Jupyter notebook (buyer-run: EDA, scaling, elbow, silhouette, personas)
- Project report PDF (background, methodology, k-selection reasoning, persona analysis, limitations)
- PPT presentation for final review
- Viva Q&A preparation document (K-means, elbow, silhouette, standardization, unsupervised evaluation)
- Setup guide (environment, dataset download, running the notebook and demo)
Advantages
- Principled choice of k: within-cluster sum of squares computed for k = 1-8 with the elbow at k = 5, confirmed by per-k silhouette scores, explained from first principles.
- Interactive cluster explorer: drag the k slider (2-8) and watch the scatter plot re-cluster live, with centroids, WCSS and silhouette updating.
- Five named personas with a concrete marketing action each: Target VIPs, Impulsive Spenders, Budget Sensible, Cautious Affluents and Standard Shoppers.
- New-customer predictor: enter an income and spending score to get the nearest-centroid segment assignment with its persona.
- Full reproducible evaluation notebook covering scaling, elbow, silhouette, profiling and persona tables.
- Clean, documented pipeline on the 200-record Mall Customers dataset (CustomerID, Gender, Age, Annual Income, Spending Score) with EDA plots and standardized features.
Disadvantages
- Clusters are exploratory, not ground truth: there are no correct labels, so accuracy and confusion matrices do not apply; WCSS and silhouette are the right metrics here.
- K-means assumes roughly spherical, similarly-sized clusters, so elongated or very uneven segments would be mis-split.
- The dataset has only 200 customers and two clustering features, so personas are illustrative of the method rather than a production segmentation.
- Persona names such as VIP and Impulsive are analyst interpretations of cluster centroids, not discovered facts; the report keeps the numbers and the storytelling visibly separate.
- Results depend on the random initialization seed and the chosen k; the notebook fixes the seed for reproducibility and documents the k = 5 reasoning.
Limitations & prerequisites
- Clusters are exploratory, not ground truth — there are no "correct" labels, so accuracy and confusion matrices do not apply; the report explains why WCSS and silhouette are the right metrics here.
- K-means assumes roughly spherical, similarly-sized clusters — elongated or very uneven segments would be mis-split, which the limitations section demonstrates.
- The dataset has only 200 customers and two clustering features, so personas are illustrative of the method rather than a production segmentation; the report says so plainly.
- Persona names ("VIP", "Impulsive") are analyst interpretations of cluster centroids, not discovered facts — the report keeps the numbers and the storytelling visibly separate.
- Results depend on the random initialization seed and the chosen k; the notebook fixes the seed for reproducibility and documents the k = 5 reasoning.
Frequently Asked Questions
Which dataset is used?
The Mall Customer Segmentation Data on Kaggle (vjchoudhary7/customer-segmentation-tutorial-in-python): 200 mall customers with CustomerID, Gender, Age, Annual Income (k$) and Spending Score (1–100). Clustering uses Annual Income and Spending Score.
How is the number of clusters chosen?
Two converging methods: the elbow method (WCSS plotted for k = 1–8, bending at k = 5) and silhouette analysis (k = 5 scores highest). The notebook computes both and the report walks through the reasoning.
What is the accuracy of the clustering?
Accuracy doesn't apply — K-means is unsupervised, so there are no true labels to be accurate against. Quality is measured with inertia (WCSS) and silhouette score, both reported by the notebook.
What do the segments mean?
Each cluster's centroid is translated into a persona: high-income/high-spending "Target VIPs", low-income/high-spending "Impulsive Spenders", and so on — each with a concrete marketing action in the demo and report.
Can I use my own customer data?
Yes — any CSV with two or more numeric behavior features works. The notebook's scaling and k-selection steps rerun unchanged; the guide shows how to point the pipeline at your file.
Is this project suitable for a final-year project?
Yes — it suits Computer Science, AI/ML and Data Science programs, demonstrating unsupervised learning, feature scaling, model selection without labels, and the honest interpretation of exploratory results. Suitable for B.E./B.Tech final-year projects in Computer Science, AI/ML and Data Science.
Components & software requirements
- Python 3.10, scikit-learn (KMeans, StandardScaler, silhouette_score)
- pandas, NumPy (dataset handling, profiling tables)
- Matplotlib, Seaborn (EDA, elbow plot, silhouette chart, cluster scatter)
- Flask demo app (cluster explorer, personas, predictor)
- Jupyter notebook (buyer-run full pipeline)
- Mall Customer Segmentation dataset (Kaggle, 200 customers)
Delivery information
Built-to-order project. Delivery timeline is shared after order confirmation based on current queue.
Support terms
Complete documentation, setup guide, and viva preparation included. Support for setup and explanation provided.
Download free synopsis (PDF)
Enter your name and WhatsApp number — the synopsis PDF downloads immediately. We may send occasional project updates on WhatsApp; no spam.
Saraswat et al. (2024), Consumer Segmentation with K-means, Elbow and Silhouette (Springer)