
More project photos (2)
The problem
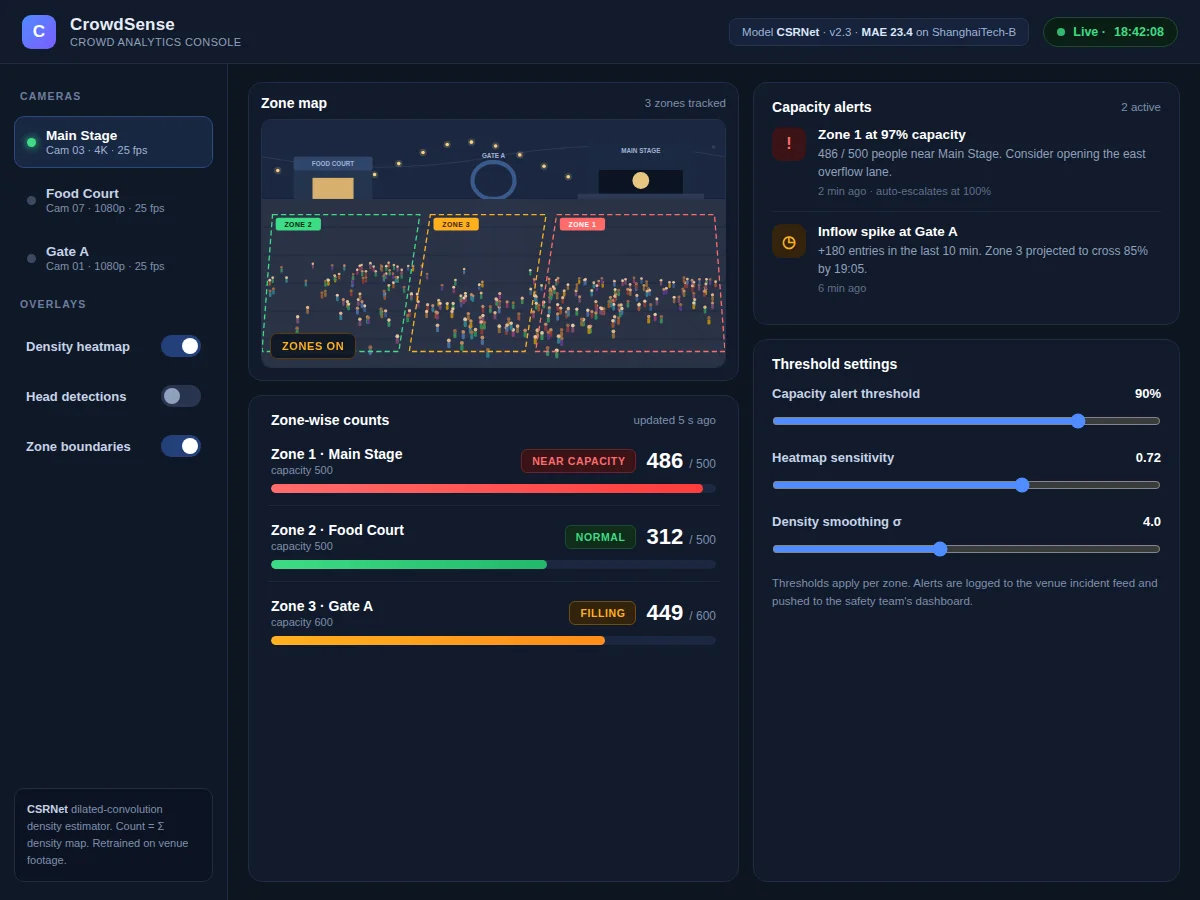
Crowd estimation matters for public safety, event management and transport planning, yet manual counting in dense scenes is unreliable — and detection-based methods fail once heads overlap and occlude each other. Drawing a bounding box around every person works in sparse scenes, but in a congested gathering the standard approach collapses exactly where it is needed most. Density-map regression takes a different route: instead of detecting individuals, the network learns "how many people per region," predicting a density map whose pixel sum equals the head count. This degrades gracefully in dense scenes and has been the standard approach since 2016. CSRNet pairs a VGG-16 front-end with dilated convolutions that enlarge the receptive field without downsampling, preserving the spatial detail dense scenes need. For students, it is a clean regression-based vision project with an intuitive demo — upload a photo, get a count plus a heatmap that shows exactly where the model thinks the crowd is.
How it works
Dataset & model:
Dataset name: ShanghaiTech Crowd Counting.
Source: publicly released crowd-counting benchmark.
Task: crowd counting via density-map regression.
Classes: not a classification task — head-point annotations converted to Gaussian density maps; Part A: 482 congested images; Part B: 716 street scenes.
Model: CSRNet — VGG-16 front-end (first 10 layers) plus dilated-convolution back-end; trained with Euclidean (L2) loss between predicted and ground-truth density maps.
Input: crowd photograph, resized to a multiple of 8.
Prediction: per-pixel density map.
Output: head count (density-map sum) plus density heatmap overlay.
Evaluation metrics: MAE and MSE — computed by the evaluation notebook on the validation split during the build.
Design target: lower MAE on Part B than on Part A (sparser scenes are easier). This is a design target, not a measured claim; the notebook computes the actual MAE/MSE during the build.
Working:
- Training phase: head-point annotations are converted into ground-truth density maps by placing a Gaussian kernel at each annotated head position; cropped image patches are augmented at multiple scales for varying head sizes and camera distances.
- The VGG-16 front-end (first 10 layers) extracts features; the dilated-convolution back-end enlarges the receptive field without downsampling, preserving the spatial detail dense scenes need.
- Training regresses the predicted density map against the ground truth with a Euclidean (L2) loss on cropped patches; the notebook logs loss curves during the build.
- Evaluation phase: the evaluation notebook computes MAE and MSE on the validation split and visualizes the error cases.
- Inference phase: an uploaded crowd photo is resized to a multiple of 8 and passed through the trained network in a single forward pass.
- The predicted density map is summed to produce the head count, and overlaid as a heatmap on the original photo in the demo app so the count is visually verifiable.
Specifications:
Model | CSRNet: VGG-16 front-end (first 10 layers) + dilated-convolution back-end
Dataset | ShanghaiTech Crowd Counting — Part A (482 congested images), Part B (716 street scenes)
Annotations | Head-point annotations converted to Gaussian density maps
Loss | Euclidean (L2) distance between predicted and ground-truth density maps
Evaluation | MAE and MSE computed by the evaluation notebook on the validation split
Design target | Lower MAE on Part B than Part A (design target, not a measured claim)
Inference | Single-image density-map regression on CPU or GPU
Platform | Windows/Linux/macOS, Python 3.10; web demo app
Project features
[Density-Map Head Counting] (implemented) — Counts people from a single crowd photograph by regressing a density map and summing it, with no per-person bounding boxes needed.
[CSRNet Architecture] (implemented) — VGG-16 front-end (first 10 layers) plus a dilated-convolution back-end that preserves spatial resolution while capturing broad crowd context.
[Density Heatmap Overlay] (implemented) — The demo overlays the predicted density map as a heatmap on the photo, showing exactly where the crowd concentrates.
[ShanghaiTech Training] (implemented) — Trains on both Part A (dense crowds) and Part B (sparse street scenes), so the model sees the full range of crowd densities.
[Annotation-to-Density Scripts] (implemented) — Preprocessing scripts convert head-point annotations into Gaussian ground-truth density maps.
[MAE & MSE Evaluation] (implemented) — The evaluation notebook computes Mean Absolute Error and Mean Squared Error on the validation split with error-case visualization.
[Multi-Scale Augmentation] (implemented) — Patch cropping at multiple scales during training handles varying head sizes and camera distances.
[CPU Demo] (implemented) — The shipped weights infer in seconds on a regular laptop CPU.
What is included
Complete source code (training, evaluation, inference, demo app)
Trained model weights (PyTorch .pt checkpoints)
Density-map generation and augmentation scripts
Project report PDF (crowd-counting background, methodology, evaluation)
PPT presentation for the final review
Viva Q&A preparation document (density-map regression, dilated convolutions, MAE/MSE, VGG-16)
Setup guide (environment, dependencies, dataset download steps)
Limitations & prerequisites
Extremely dense crowds saturate the density map — heads packed tighter than the annotation resolution get undercounted.
Occlusion and perspective distortion cause errors: distant small heads and partially hidden people are the main failure modes.
Single-frame estimator: no tracking, so it cannot distinguish individuals or count people across video frames (video counting is documented as future scope).
Educational prototype, not a surveillance-certified system — not intended for safety-critical crowd management or law-enforcement use.
All reported figures are design targets from the buyer's own training run; no pre-measured MAE/MSE is claimed.
Frequently Asked Questions
Why use density maps instead of detecting each person?
Detection needs bounding boxes per person and fails when heads overlap in dense scenes. Density-map regression learns "how many people per region" directly, so it degrades gracefully in crowds — the standard approach for this task since 2016.
What is the ShanghaiTech dataset?
The ShanghaiTech Crowd Counting dataset: Part A with 482 highly congested images gathered from the internet, and Part B with 716 relatively sparse street scenes, each with head-point annotations. It is the standard benchmark for crowd counting.
How do dilated convolutions help here?
They enlarge each filter's receptive field without shrinking the feature map, so the network sees broad crowd context while keeping the spatial resolution needed for an accurate density map — CSRNet's key idea.
What do MAE and MSE tell us?
Mean Absolute Error gives the average count error per image; Mean Squared Error penalizes large errors more, so it flags scenes where the model fails badly. The evaluation notebook computes both on the validation split.
Is this project suitable for a final-year project?
Yes. It suits B.E./B.Tech students in Computer Science, AI/ML and Data Science, demonstrating density-map regression, dilated convolutions, MAE/MSE evaluation and an intuitive heatmap demo.
What will I receive?
Complete source code, trained .pt checkpoints, density-map generation and augmentation scripts, project report PDF, PPT presentation, viva Q&A document and a setup guide.
Components & software requirements
Python 3.10
PyTorch and torchvision
OpenCV, NumPy, SciPy
Matplotlib
Web demo app (included)
ShanghaiTech dataset (public; preparation scripts included)
GPU recommended for training (cloud-GPU guidance included); inference runs on CPU
Delivery information
Built to order — the source code, trained weights, project report, PPT and viva Q&A are prepared fresh for each buyer after the order is placed. The delivery schedule is confirmed at order time, and includes time for training the model and assembling the complete documentation kit.
Support terms
- Environment and dependency setup guidance, including dataset download steps.
- Viva preparation support covering density-map regression, dilated convolutions, MAE/MSE and the VGG-16 backbone.
- Explanation of the evaluation notebook output and how to present the results in the review.
- Discussion of feasible customizations before ordering, such as a video-counting extension (documented as future scope) or a custom crowd dataset.