
More project photos (2)
The problem
City bus apps usually show the printed timetable, which is fiction during rush hour — buses bunch, crawl and skip stops while the board still promises "on time". The real signal is GPS: every bus reports its position every few seconds, and months of these traces contain everything needed to predict arrivals honestly. Students attempting this often average past travel times naively, ignoring headways, dwell time and time-of-day effects. This project builds the full pipeline — ingesting a GTFS-Realtime vehicle-position archive, map-matching pings to route segments, engineering features (current speed, headway to the bus ahead, scheduled deviation, hour, day-of-week, weather flag), and training a gradient-boosting regressor per route segment. A live arrival board shows predicted ETAs with confidence, and a tracking map renders bus positions from the GPS feed.
How it works
- A public GTFS-Realtime vehicle-position feed is archived for six months (≈2.1M pings) together with the static GTFS schedule for routes, stops and shapes.
- Pings are cleaned (GPS jitter filter, teleport removal) and map-matched to route segments and nearest stops.
- Segment travel times, dwell times and headways are computed from consecutive matched pings to build the supervised training set.
- Sixteen features are engineered per segment crossing: current speed, headway, schedule deviation, time-of-day, day-of-week, segment length and weather flag.
- A gradient-boosting regressor (LightGBM class) is trained per route with time-based train/validation/test splits to avoid leakage.
- At serving time, the latest GPS fix for each bus is featurized identically and segment ETAs are summed to produce stop arrival predictions with confidence.
- The test period is scored with MAE against schedule and historical-average baselines, split into peak and off-peak.
Tech stack:
- Python 3, LightGBM (gradient boosting)
- pandas, NumPy, GeoPandas (trajectory processing)
- GTFS-Realtime feed archive (public city bus data)
- scikit-learn (baselines, metrics)
- HTML/CSS/JavaScript board + SVG map
- Matplotlib (report plots)
- SQLite (ping archive)
- Git
Dataset & model details
- Dataset: Public city-bus GTFS-Realtime vehicle-position feed, archived 6 months (≈2.1M GPS pings) with the static GTFS schedule; reference build uses an openly archived feed, re-pointed to the buyer's city at build time.
- Task: Regression; input = 16 features per segment crossing (speed, headway, deviation, calendar, weather), output = segment travel time in seconds, summed to stop ETAs.
- Model: Gradient-boosting regressor (LightGBM class), one model per route, trained with time-based splits; quantile heads for confidence intervals.
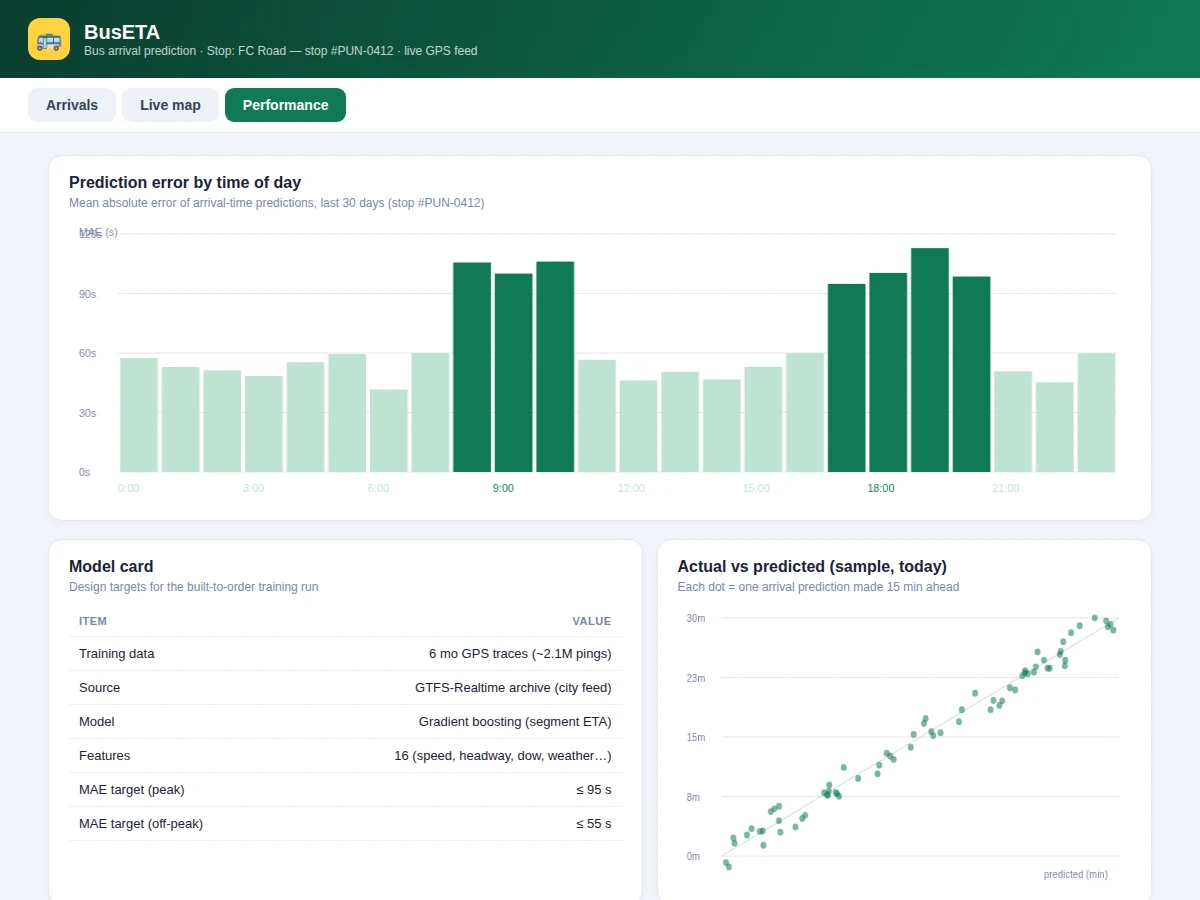
- Metrics: Test MAE ≤ 95 s in peak hours and ≤ 55 s off-peak (design targets), reported against schedule and historical-average baselines. No accuracy is claimed as measured until the training run is executed for the order.
| Parameter | Value |
|---|---|
| Training pings | Approximately 2.1M GPS fixes (6 months) |
| Features | 16 engineered per segment crossing |
| Prediction | Stop-level ETA, 15–45 min ahead |
| Peak-hour MAE | ≤ 95 s (design target, not a measured claim) |
| Off-peak MAE | ≤ 55 s (design target, not a measured claim) |
| Model size | Approximately 40 MB per route (expected) |
| Inference | Approximately 25 ms per bus update on CPU (expected) |
| Serving | Batch script + single-file web board |
Project features
- [Segment-level ETA model] Gradient-boosting regressor predicts travel time per route segment from 16 engineered features, then sums segments for stop-level ETAs.
- [Live arrival board] Web app listing upcoming arrivals per route with predicted wait, confidence bar and delay-vs-schedule status.
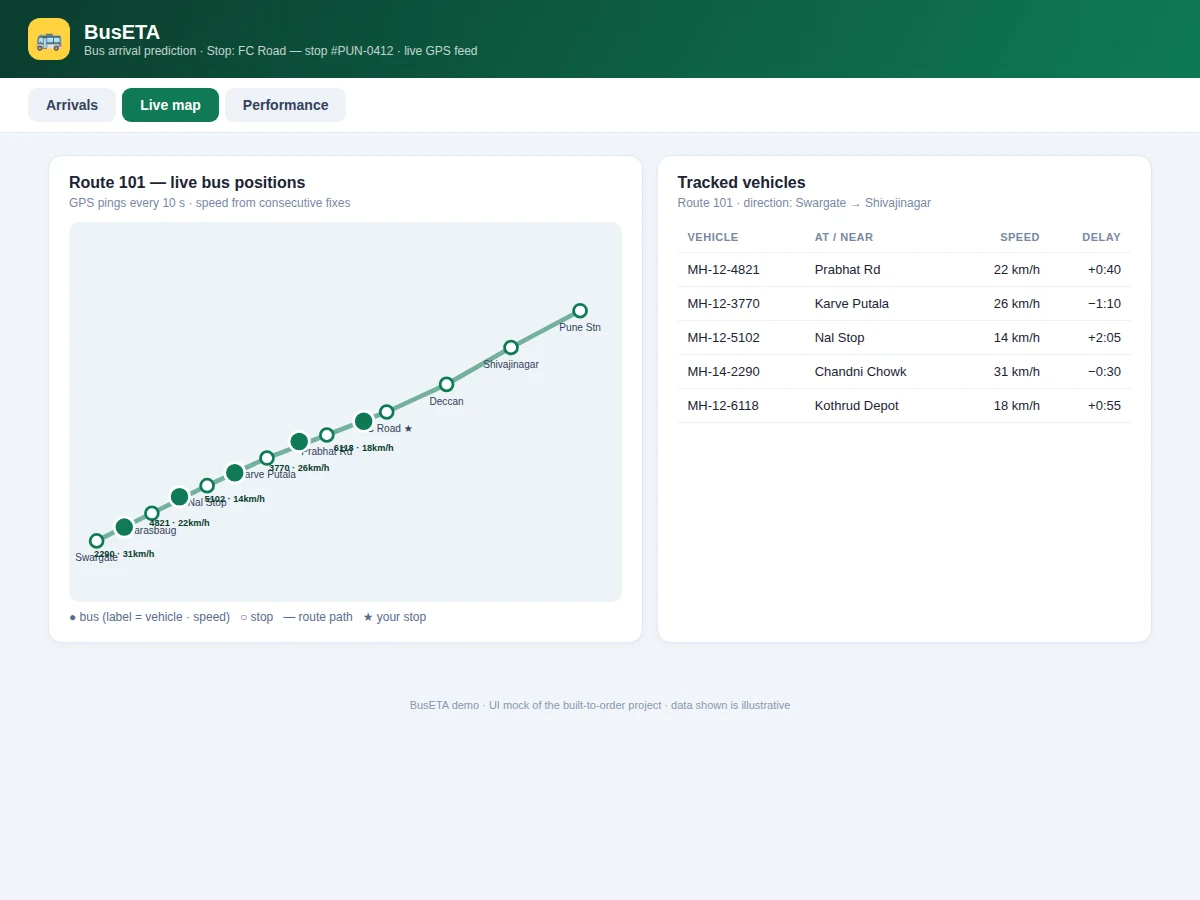
- [GPS tracking map] Route polyline with live bus markers, speeds and vehicle IDs rendered from the position feed.
- [GTFS-RT ingestion pipeline] Scripts to archive a public GTFS-Realtime vehicle-position feed, clean GPS noise and map-match pings to stops and segments.
- [Feature engineering] Headway, segment speed percentiles, dwell-time estimates, schedule deviation, calendar and weather features — all documented.
- [Baseline comparison] Schedule-based and historical-average baselines on the same test days, with MAE proving the model's gain in peak hours.
- [Confidence scores] Prediction intervals from quantile regression, surfaced as confidence bars on the arrival board.
What is included
- GTFS-Realtime archiving, cleaning and map-matching pipeline
- Feature engineering scripts and trained per-route models
- Live arrival board web app with confidence bars
- GPS tracking map (SVG route + live bus markers)
- Baseline comparison and peak/off-peak error analysis
- Project report PDF (background, boosting theory, methodology, results)
- PPT presentation for final review
- Viva Q&A preparation document (GTFS, map-matching, gradient boosting, leakage)
Limitations & prerequisites
- Needs a public GTFS-Realtime feed for the city — predictions are only as live as the feed's update interval (typically 10–30 s).
- 95 s / 55 s MAE are design targets for the training run, stated honestly — the report documents the actual achieved figures after training.
- Unplanned disruptions (diversions, breakdowns, road closures) are not predictable from history and are out of scope.
- GPS noise in dense urban canyons can misassign pings near parallel routes; the map-matching step mitigates but does not eliminate this.
- The model predicts for routes seen in training; a brand-new route needs its own data collection period.
Frequently Asked Questions
Where does the GPS data come from?
Public GTFS-Realtime vehicle-position feeds published by transit agencies. The pipeline archives the feed for months, cleans the pings and map-matches them to route segments — the same open-data approach real transit apps use.
Why gradient boosting instead of deep learning?
Tabular features (speeds, headways, calendar effects) are where tree ensembles dominate — they train in minutes, need less data, and the report includes an LSTM comparison to justify the choice for the viva.
How do you avoid data leakage?
Splits are strictly chronological — the model is trained on earlier months and tested on later ones, so it can never peek at future traffic when predicting the past.
What is map-matching?
Assigning each noisy GPS ping to the correct route segment and nearest stop using the GTFS shape geometry, with jitter filtering and teleport removal for bad fixes.
Can this work for my city's buses?
If the city publishes a GTFS-Realtime feed, yes — the pipeline is feed-agnostic and the built-to-order package is configured for the buyer's city and routes.
Is this project suitable for a final-year project?
Yes — for Computer Science, IT and AI/ML programs. It covers open-data pipelines, geospatial processing, feature engineering and a deployed prediction UI. Suitable for B.E./B.Tech final-year projects in Computer Science, IT and AI & Machine Learning.
Components & software requirements
- Python 3, LightGBM (gradient boosting)
- pandas, NumPy, GeoPandas (trajectory processing)
- GTFS-Realtime feed archive (public city bus data)
- scikit-learn (baselines, metrics)
- HTML/CSS/JavaScript board + SVG map
- Matplotlib (report plots)
- SQLite (ping archive)
- Git
Dataset & model details
- Dataset: Public city-bus GTFS-Realtime vehicle-position feed, archived 6 months (≈2.1M GPS pings) with the static GTFS schedule; reference build uses an openly archived feed, re-pointed to the buyer's city at build time.
- Task: Regression; input = 16 features per segment crossing (speed, headway, deviation, calendar, weather), output = segment travel time in seconds, summed to stop ETAs.
- Model: Gradient-boosting regressor (LightGBM class), one model per route, trained with time-based splits; quantile heads for confidence intervals.
- Metrics: Test MAE ≤ 95 s in peak hours and ≤ 55 s off-peak (design targets), reported against schedule and historical-average baselines. No accuracy is claimed as measured until the training run is executed for the order.
Delivery information
Built-to-order project. Delivery timeline is shared after order confirmation based on current queue.
Support terms
Complete documentation, setup guide, and viva preparation included. Support for setup and explanation provided.