
More project photos (2)
The problem
When a UART link garbles bytes or an I2C sensor stops acknowledging, a multimeter and an oscilloscope are often not enough — you need to see multiple digital lines at the same time, aligned to the same time base, and know what the bits actually mean. Commercial logic analyzers that do this well cost several times a student budget, and cheap USB clones leave students blind to how sampling, triggering and protocol decoding actually work. This project solves that by building the instrument itself: an Arduino Mega 2560 samples 8 digital channels by direct port-register reads, triggers on rising or falling edges, and draws the captured waveforms on a color TFT screen in real time. On top of the traces, the firmware decodes UART, I2C and SPI frames so protocol errors become visible instead of mysterious. The result is a genuinely useful bench tool for a student lab, and because every subsystem — capture engine, trigger, decoders, display — is implemented in the project firmware, the student can explain the entire signal path in the viva.
How it works
- Eight probe leads are clipped to the digital signals of the device under test, plus a ground lead for a common reference.
- The capture engine reads the 8-bit input port register in a tight loop, storing one byte per sample into a SRAM buffer at the selected sample rate (design target up to 1 MS/s).
- The trigger block watches the selected channel; when the configured edge occurs, it records the pre-trigger history and fills the post-trigger window, then stops the capture.
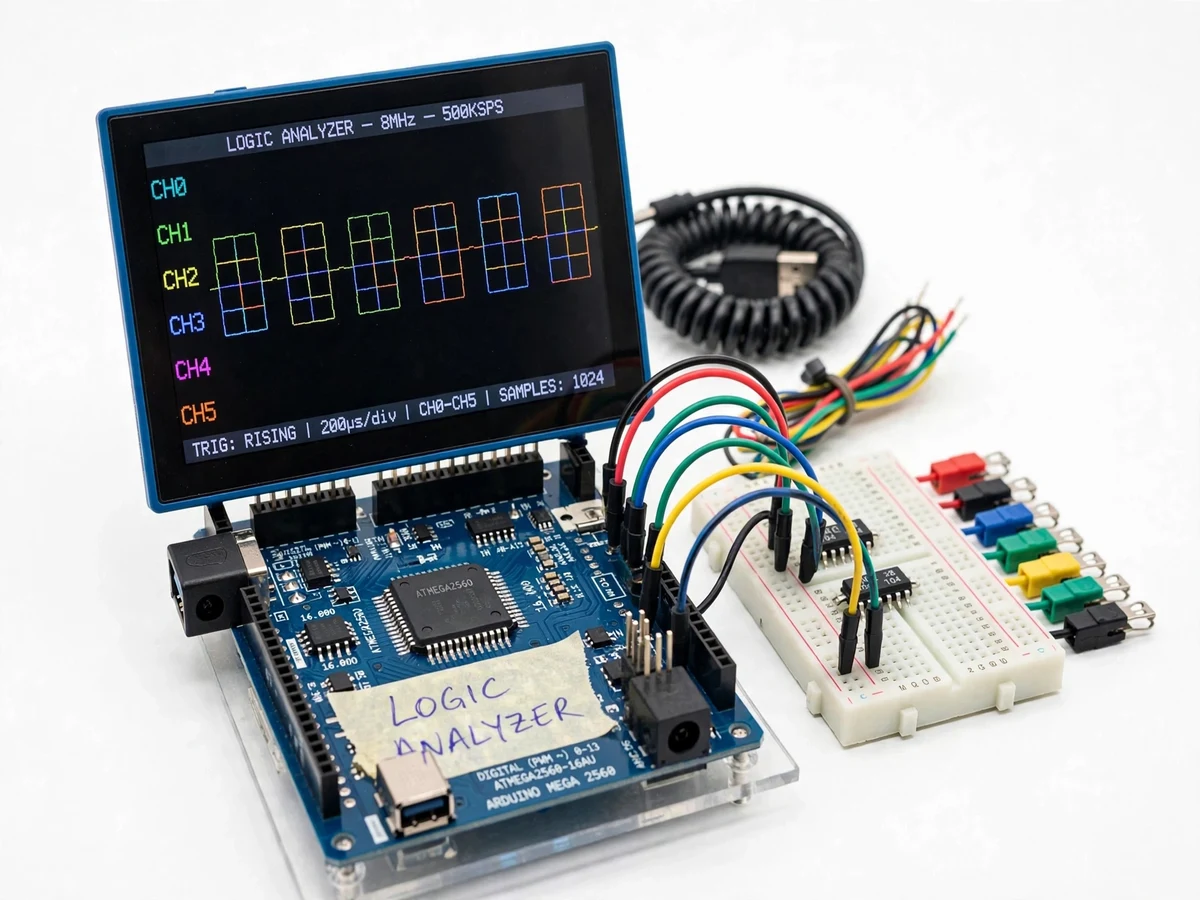
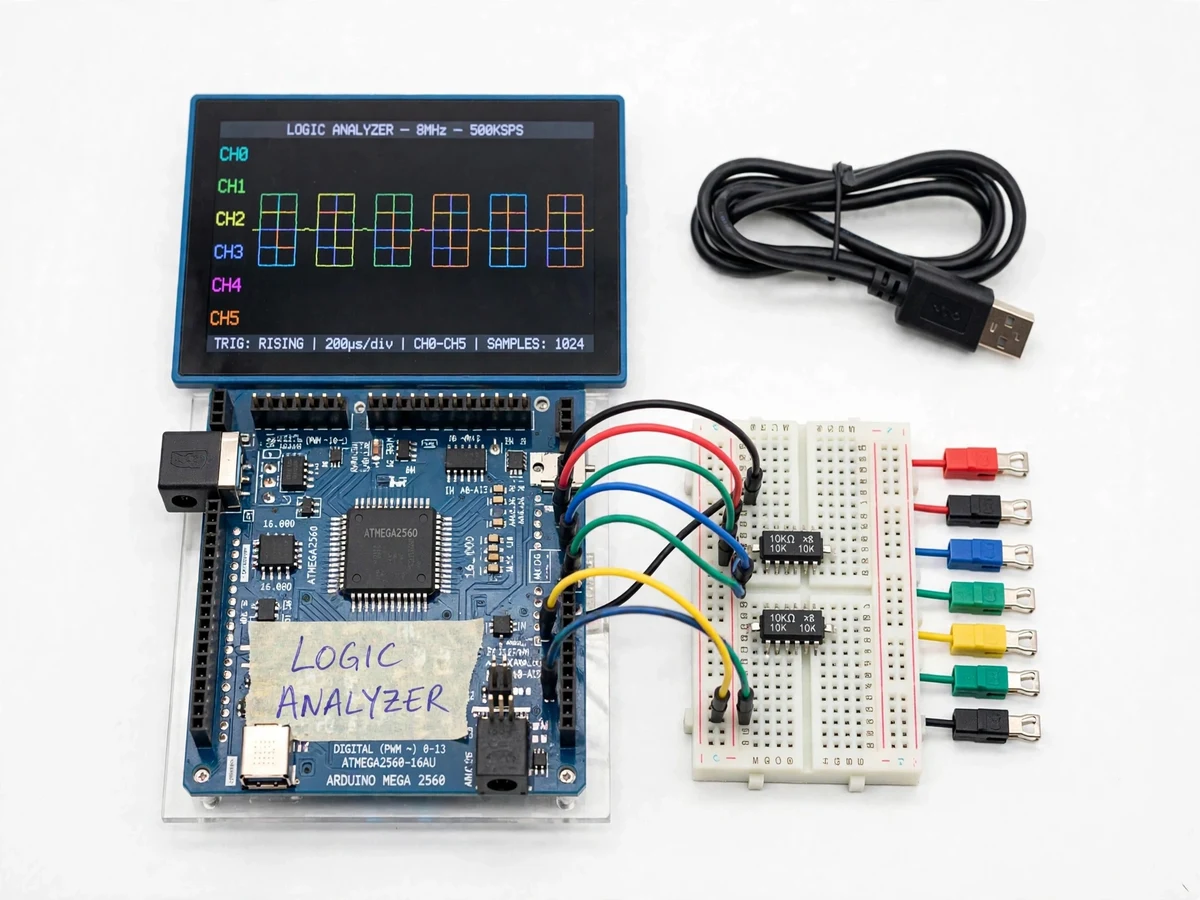
- The TFT driver draws all 8 channels as color-coded square-wave traces with the timebase and trigger status in the header bar.
- The decode engine scans the captured buffer for UART, I2C or SPI patterns per the selected protocol and overlays decoded bytes and transaction markers on the traces.
- On request, the sample buffer is streamed over USB serial at 115200 baud to the Python viewer, where the waveform can be zoomed, measured with cursors and exported to CSV.
Tech stack:
- Arduino Mega 2560 (ATmega2560) with direct port-register capture firmware
- 2.4-inch TFT display (ILI9341) with Adafruit GFX-style graphics routines
- Embedded C/C++ (Arduino framework)
- Python 3 viewer with PySerial and Matplotlib
- Solderless breadboard prototype, color-coded probe leads with grabber clips
- CSV export for offline analysis
| Parameter | Value |
|---|---|
| Input channels | 8 digital channels (one 8-bit port) |
| Capture rate | Up to 1 MS/s (design target; direct port reads at 16 MHz) |
| Sample depth | Approximately 6,000 samples per capture (expected; limited by ATmega2560 SRAM) |
| Trigger | Rising edge, falling edge or both, on any channel; pre/post-trigger window |
| Logic thresholds | TTL-compatible: LOW below 0.8 V, HIGH above 2.0 V (ATmega2560 datasheet, 5 V supply) |
| Protocol decoders | UART (configurable baud, 8N1), I2C, SPI |
| Display | 320 × 240 color TFT, per-channel trace colors |
| PC interface | USB serial, 115200 baud, Python viewer with zoom/cursors/CSV export |
| Probe leads | 8 signal + ground, color-coded, mini grabber clips, series-resistor protection |
| Power | 5 V from USB, approximately 200 mA expected draw |
Project features
- [8-channel simultaneous capture] Eight digital channels are sampled together by direct port-register reads, giving true time-aligned traces with a design-target capture rate up to 1 MS/s.
- [Live TFT waveform display] A 2.4-inch color TFT draws the captured traces with per-channel colors, the active timebase, trigger mode and sample count — the instrument works standalone without a PC.
- [Edge triggering] Triggering on rising edge, falling edge or either edge of any selected channel, with pre-trigger and post-trigger sample windows around the event.
- [UART protocol decoding] UART frames are decoded on-channel (start bit, data bits, stop bit at configurable baud), with decoded bytes overlaid on the trace.
- [I2C and SPI decoding] I2C (SDA/SCL with ACK/NACK indication) and SPI (MOSI/MISO/SCK/CS) frames are decoded and displayed as transactions.
- [PC waveform viewer] Captured samples stream over USB serial to a Python viewer with zoom, pan, cursor measurements and CSV export of the capture buffer.
- [Grabber probe leads] Color-coded probe leads with mini grabber clips connect to the device under test; each input has series-resistor protection.
What is included
- Assembled logic analyzer prototype (Arduino Mega + TFT shield + probe leads)
- Complete firmware source code (capture engine, trigger, UART/I2C/SPI decoders, TFT display, serial export)
- Python PC waveform viewer with zoom, cursors and CSV export
- Wiring diagram and probe connection guide
- Calibration and usage procedure (timebase check, trigger verification)
- Project report PDF (background, timing theory, firmware architecture, results)
- PPT presentation for final review
- Viva Q&A preparation document (sampling theory, Nyquist, triggers, protocol frames)
Limitations & prerequisites
- Capture is limited to digital 5 V TTL signals — the inputs are not 3.3 V-native without a level shifter, and there is no analog channel.
- Effective capture rate is a design target: heavy display updates during continuous capture lower the rate, so maximum rate applies to buffer-fill captures.
- The 6,000-sample buffer limits long captures; at 1 MS/s the visible window is about 6 ms per capture.
- I2C/SPI decoding is validated for standard-mode speeds within the capture rate — high-speed modes exceed the sampling capability.
- USB serial streaming at 115200 baud bounds continuous capture; sustained streaming is slower than single-buffer captures.
- This is a teaching and debugging instrument, not a replacement for a calibrated commercial bench analyzer.
Frequently Asked Questions
How fast can it really sample?
The design target is up to 1 MS/s on all 8 channels using direct port-register reads at the ATmega2560's 16 MHz clock. Sustained rates depend on what the firmware is doing during capture — buffer-fill captures reach the target; continuous display updates run slower.
What protocols can it decode?
UART (configurable baud, standard 8N1 framing), I2C (start/stop, address, data, ACK/NACK) and SPI (MOSI/MISO/SCK with chip-select). Decoded bytes appear overlaid on the waveform traces.
Does it work without a PC?
Yes. The TFT screen shows the captured waveforms, trigger status and decoded data standalone. The PC viewer is an additional tool for zooming, cursor measurements and CSV export.
What signals can I probe?
5 V TTL/CMOS digital signals with a shared ground — UART TX/RX lines, I2C SDA/SCL, SPI buses, PWM outputs, clock lines and button/debounce studies are typical uses. 3.3 V logic needs a level shifter.
How deep is the capture buffer?
Approximately 6,000 samples per capture, bounded by the ATmega2560's SRAM — enough for protocol-level debugging (e.g. full I2C transactions) but not for minutes-long recordings.
Is this project suitable for a final-year project?
Yes — for Electronics, E&TC and Instrumentation programs. It demonstrates embedded C, real-time sampling, triggering, protocol decoding and instrument design in one working build. Suitable for B.E./B.Tech final-year projects in Electronics, Electronics & Telecommunication and Instrumentation.
Components & software requirements
- Arduino Mega 2560 (ATmega2560) with direct port-register capture firmware
- 2.4-inch TFT display (ILI9341) with Adafruit GFX-style graphics routines
- Embedded C/C++ (Arduino framework)
- Python 3 viewer with PySerial and Matplotlib
- Solderless breadboard prototype, color-coded probe leads with grabber clips
- CSV export for offline analysis
Delivery information
Built-to-order project. Delivery timeline is shared after order confirmation based on current queue.
Support terms
Complete documentation, setup guide, and viva preparation included. Support for setup and explanation provided.