
More project photos (2)

The problem
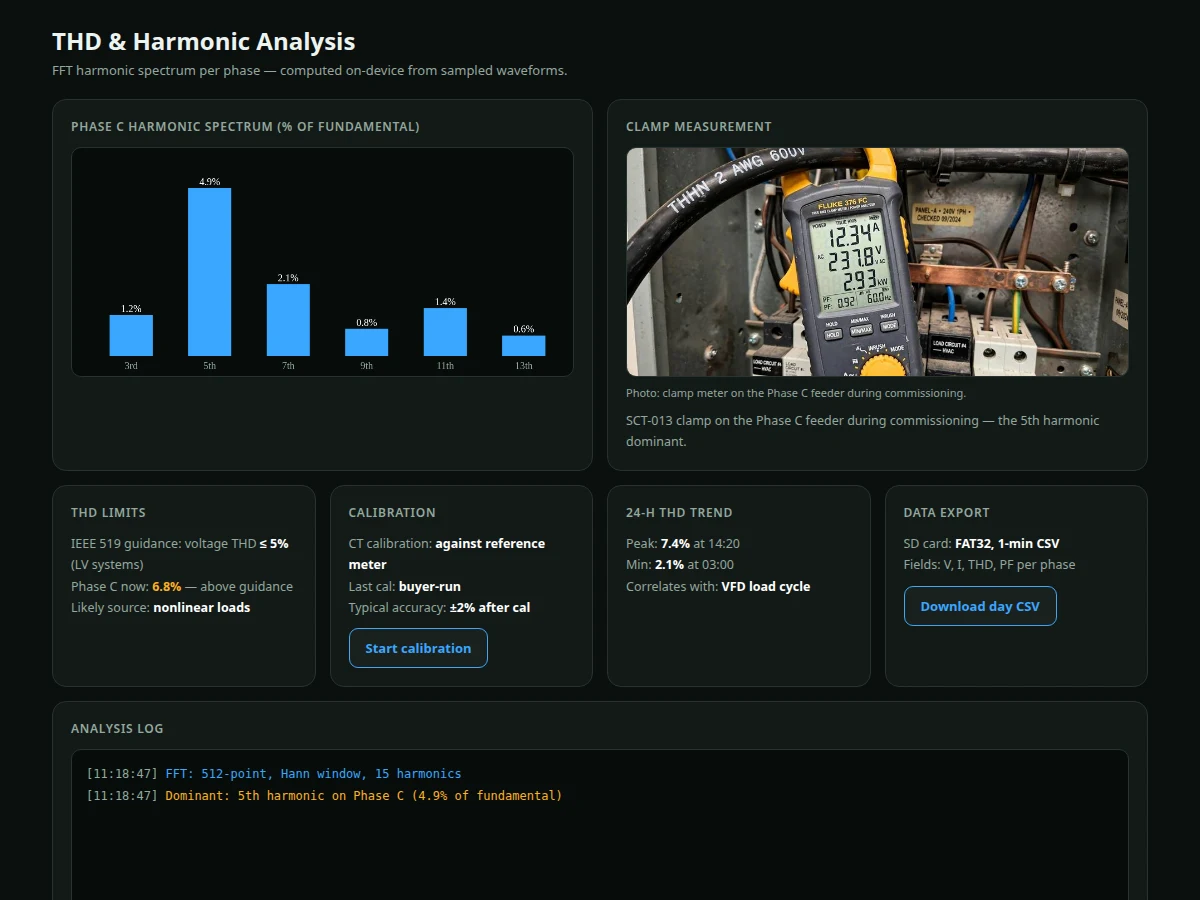
Nonlinear loads — VFDs, SMPS chargers, LED drivers — inject harmonic currents that distort the mains waveform, overheat neutrals and nuisance-trip protection. Utilities care about THD, but commercial power-quality analyzers cost more than a student's semester budget. This project builds a credible educational alternative: an ESP32-based analyzer that clamps onto the three phase conductors with SCT-013 split-core CTs, senses phase voltages through ZMPT101B isolation modules, samples each channel at roughly 2 kS/s, and computes a 512-point FFT per phase to extract THD and the individual harmonic spectrum up to the 15th harmonic. Results — Vrms, Irms, per-phase THD, power factor — are shown on the local display and logged to SD card as timestamped CSV, while the dashboard (the software half of this hybrid build) renders the live monitor, waveform view, harmonic bar charts and the 24-hour THD trend against the IEEE 519 5% guidance line. The report is explicit about what this instrument is: an educational analyzer whose accuracy is established by the buyer's own calibration against a reference meter, not a certified revenue meter — and the calibration procedure is a documented, viva-defensible part of the build.
How it works
- The three SCT-013 clamps close around the R/Y/B phase conductors; ZMPT101B modules tap the phase voltages through isolation.
- The ESP32 ADC samples each voltage and current channel at roughly 2 kS/s, synchronized to the mains cycle.
- A 512-point FFT with Hann windowing extracts the fundamental and harmonic magnitudes up to the 15th harmonic per phase.
- THD is computed as the ratio of harmonic RMS to fundamental RMS; Vrms, Irms and displacement power factor come from the time-domain samples.
- Results update the local display instantly and are appended to the SD-card CSV once per minute with NTP timestamps.
- The dashboard reads the live stream and renders per-phase cards, the waveform, harmonic spectra and the 24-h THD trend.
- During commissioning, the buyer runs the calibration procedure against a reference meter and stores the correction factors.
Tech stack:
- ESP32 DevKit (Arduino-core firmware, ADC sampling + FFT)
- 3x SCT-013 split-core CT clamps (0–100 A)
- 3x ZMPT101B voltage transformer modules (isolated sensing)
- SD-card module (FAT32 CSV logging), local TFT display
- NTP time sync over Wi-Fi
- Single-file HTML/CSS/JS dashboard (live monitor, waveform, spectra, trends)
| Parameter | Value |
|---|---|
| Controller | ESP32 DevKit, Arduino-core firmware |
| Current sensing | 3x SCT-013 split-core CT, 0–100 A, non-invasive |
| Voltage sensing | 3x ZMPT101B isolated modules, 230 V nominal |
| Sampling | ~2 kS/s per channel, mains-synchronized |
| Analysis | 512-point FFT, Hann window, harmonics to 15th, per-phase THD |
| Logging | SD card, 1-minute CSV: Vrms, Irms, THD, PF per phase; NTP timestamps |
| Accuracy | ±2% typical on V/I after buyer-run calibration against a reference meter |
| THD guidance | IEEE 519: voltage THD ≤ 5% for LV systems (reference line on dashboard) |
| Display | Local TFT: Vrms / THD / PF per phase |
| Dashboard | Live cards, waveform, harmonic spectra, 24-h THD trend, CSV export |
Project features
- [Three-phase V/I sensing] 3x SCT-013 split-core CT clamps (0–100 A) plus 3x ZMPT101B isolated voltage sensors — non-invasive, no conductor cutting.
- [On-device FFT harmonic analysis] 512-point FFT per phase with Hann windowing; THD and individual harmonics up to the 15th computed on the ESP32.
- [SD-card THD logging] Timestamped CSV every minute: Vrms, Irms, THD, PF per phase, with NTP-synced timestamps.
- [Power-quality dashboard] Live per-phase cards, reconstructed voltage waveform, harmonic spectrum bar charts, 24-h THD trend with IEEE 519 guidance line.
- [Buyer-run calibration procedure] CT ratio and phase-error calibration against a reference meter — the step that earns the ±2% typical accuracy claim.
- [THD limit alerting] Configurable alert when a phase exceeds the IEEE 519 5% voltage-THD guidance, logged with timestamp.
- [Local display] On-device screen showing per-phase Vrms/THD/PF at a glance for panel-side checks.
What is included
- Complete analyzer hardware (ESP32, CT clamps, voltage modules, SD card, display), wired and firmware-loaded
- ESP32 firmware (sampling, FFT, THD computation, logging, display driver)
- Power-quality dashboard web app (live monitor, waveform, spectra, trends, export)
- Calibration procedure (reference-meter comparison, ratio/phase correction, worked example)
- Wiring and installation guide (clamp placement, phasing checks, safety)
- Project report PDF (background, measurement theory, firmware design, calibration results, honest accuracy discussion)
- PPT presentation for final review
- Viva Q&A preparation document (THD, FFT, CTs, sampling, IEEE 519, calibration)
- Setup guide (Wi-Fi/NTP provisioning, SD-card format, first logging run)
Limitations & prerequisites
- This is an educational instrument, not a certified revenue or compliance meter — the report states this explicitly; it is for learning, audits and project demonstration.
- The ±2% typical accuracy applies only after the buyer's own calibration against a reference meter; uncalibrated, errors are larger and the report says so.
- All mains-voltage work must follow the installation guide's safety rules — qualified supervision, insulated tools, no live-conductor contact; CT secondaries must never be open-circuited during installation.
- Split-core CTs must close fully and squarely around the conductor; a gapped core reads low, and the guide documents the check.
- Heavily distorted waveforms beyond the 15th harmonic and fast transients are outside this analyzer's bandwidth — documented, not hidden.
- Single-phase installations use one channel set; the three-phase firmware assumes a 3-wire/4-wire 50 Hz system.
Frequently Asked Questions
How is THD measured?
The ESP32 samples each phase at ~2 kS/s and runs a 512-point FFT; THD is the RMS of the harmonic components (up to the 15th) divided by the fundamental. The dashboard shows both the number and the harmonic spectrum.
How accurate is it?
±2% typical on voltage and current after the buyer-run calibration against a reference meter. Without calibration the error is larger — the report documents both states honestly.
Is it safe to install on a live panel?
The CTs are split-core (clip around conductors without cutting) and voltage sensing is isolated via transformers, but mains work still demands qualified supervision, insulated tools and the guide's safety checklist — non-negotiable.
What does the IEEE 519 line mean?
IEEE 519 recommends voltage THD ≤ 5% for low-voltage systems; the dashboard draws this as a guidance line so excursions (like a 6.8% phase) are immediately visible.
Can it log for a full day?
Yes — one CSV row per minute per phase to SD card with NTP timestamps; the dashboard renders the 24-hour THD trend from the log.
Is this project suitable for a final-year project?
Yes — for Electrical and Electronics programs. It demonstrates signal sampling, FFT analysis, CT instrumentation, calibration discipline and standards awareness, all strong viva material. Suitable for B.E./B.Tech final-year projects in Electrical and Electronics.
Components & software requirements
- ESP32 DevKit (Arduino-core firmware, ADC sampling + FFT)
- 3x SCT-013 split-core CT clamps (0–100 A)
- 3x ZMPT101B voltage transformer modules (isolated sensing)
- SD-card module (FAT32 CSV logging), local TFT display
- NTP time sync over Wi-Fi
- Single-file HTML/CSS/JS dashboard (live monitor, waveform, spectra, trends)
Delivery information
Built-to-order project. Delivery timeline is shared after order confirmation based on current queue.
Support terms
Complete documentation, setup guide, and viva preparation included. Support for setup and explanation provided.