
More project photos (2)
The problem
Most small factories and workshops pay their electricity bill without knowing where the units actually go. Energy audits are usually done with a clipboard, a clamp meter and a few spot readings, which misses the patterns that matter: machines idling for hours, lighting circuits eating a third of daytime load, and power factor drifting below the utility's penalty threshold. The expensive problems are invisible in spot readings. This project turns the audit into an instrument: a portable kit with five non-invasive clamp channels that logs true electrical quantities continuously for days, computes per-load energy and tariff cost, and flags the classic waste patterns automatically on a cloud dashboard — so the audit report is built from measured data rather than estimates.
How it works
- The five split-core CTs are clamped around the chosen load conductors and the voltage sense leads are connected to the bus by a qualified person.
- The metering module samples voltage and current waveforms and computes true RMS V/I, active power, power factor and cumulative energy per channel.
- The ESP32 polls the module over serial on a fixed schedule, validates each frame, and shows live values on the 16x2 LCD.
- Every 5 seconds the ESP32 publishes a JSON payload (V, I, P, PF, kWh per channel) over Wi-Fi via MQTT to the cloud backend.
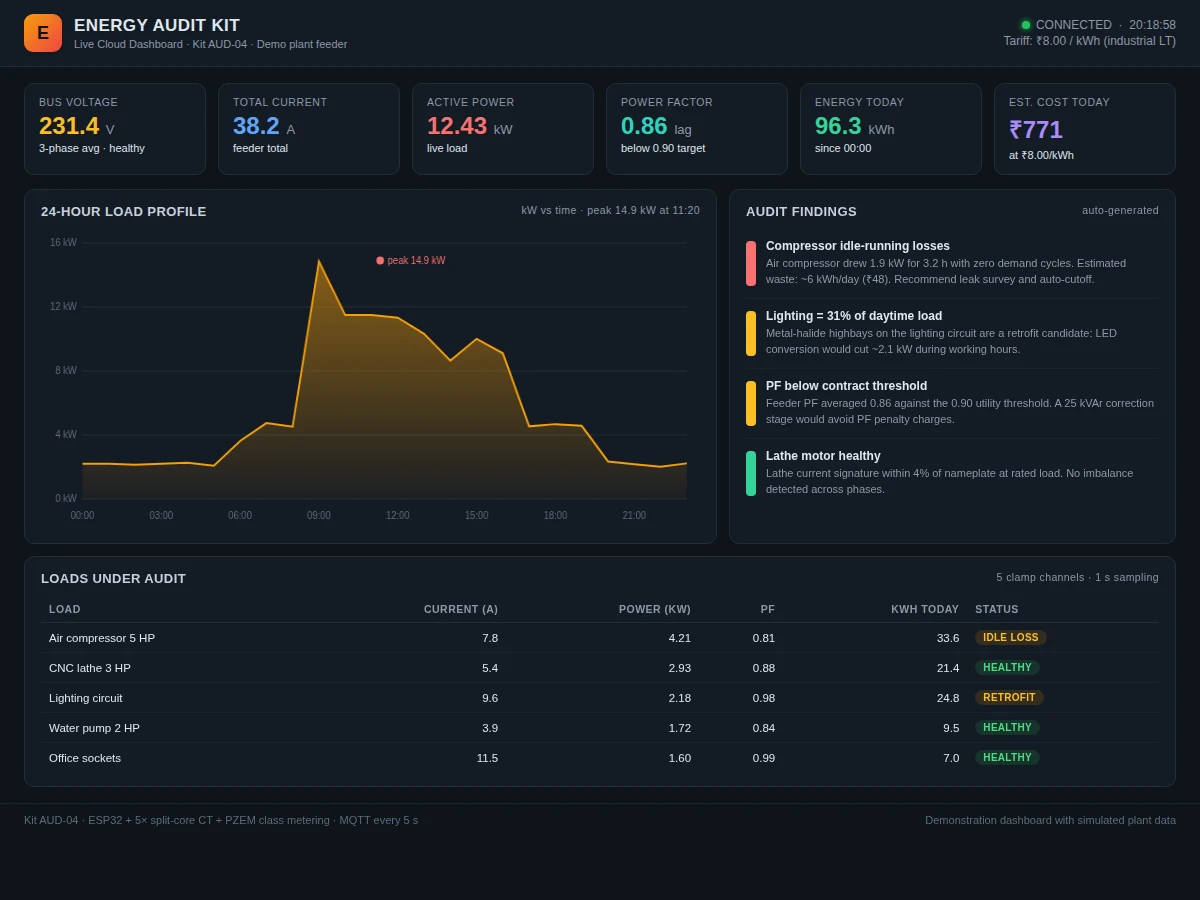
- The backend stores the time series; the dashboard renders the 24-hour load profile, per-load kWh, tariff cost and live gauges.
- The findings engine scans the data for idle-running (sustained kW with no load cycling), lighting share of daytime consumption and average PF below 0.90, and raises each finding with an estimated daily cost.
- The student runs the calibration procedure against a reference meter, records the per-channel correction factors, and exports the period CSV for the audit report.
Tech stack:
- ESP32 (Wi-Fi controller)
- SCT-013 class split-core CTs (5 channels)
- PZEM-class AC metering module
- MQTT telemetry (JSON payloads)
- Web cloud dashboard (HTML, CSS, JavaScript)
- Arduino IDE (C/C++ firmware)
- 16x2 LCD with on-device UI
- USB / Li-ion power option
| Parameter | Value |
|---|---|
| Clamp channels | 5 (expandable in firmware) |
| CT rating | 100 A max per channel (design) |
| Voltage sense | 230 V AC nominal, single-phase demo |
| Measured quantities | V, I, P, PF, cumulative kWh per channel |
| CT accuracy | Approximately ±1% over 10–120 A (datasheet, SCT-013 class) |
| Telemetry interval | 5 s over MQTT (configurable) |
| Dashboard history | 24-hour profile, daily bars (design) |
| Calibration | Buyer-run against reference meter (procedure included) |
| Power | USB 5 V or Li-ion pack (expected 6–8 h) |
| Enclosure | Portable handheld case (design) |
Project features
- [Non-invasive 5-channel sensing] Five split-core CTs clamp around load conductors with no shutdown and no wire cutting, so the kit can be deployed on a live panel by a qualified person in minutes.
- [True electrical measurement] A PZEM-class metering module reports true RMS voltage, current, active power, power factor and cumulative energy per channel — not current-only estimates.
- [Live cloud dashboard] Readings publish over MQTT every 5 seconds to a web dashboard with a 24-hour load profile, per-load tables and daily energy bars.
- [Tariff costing] A configurable rupees-per-kWh rate converts every load's consumption into money, with daily cost totals that make the business case for fixes.
- [Auto-generated audit findings] The dashboard flags idle-running losses, lighting share of daytime load and power factor below the 0.90 contract threshold with quantified estimates.
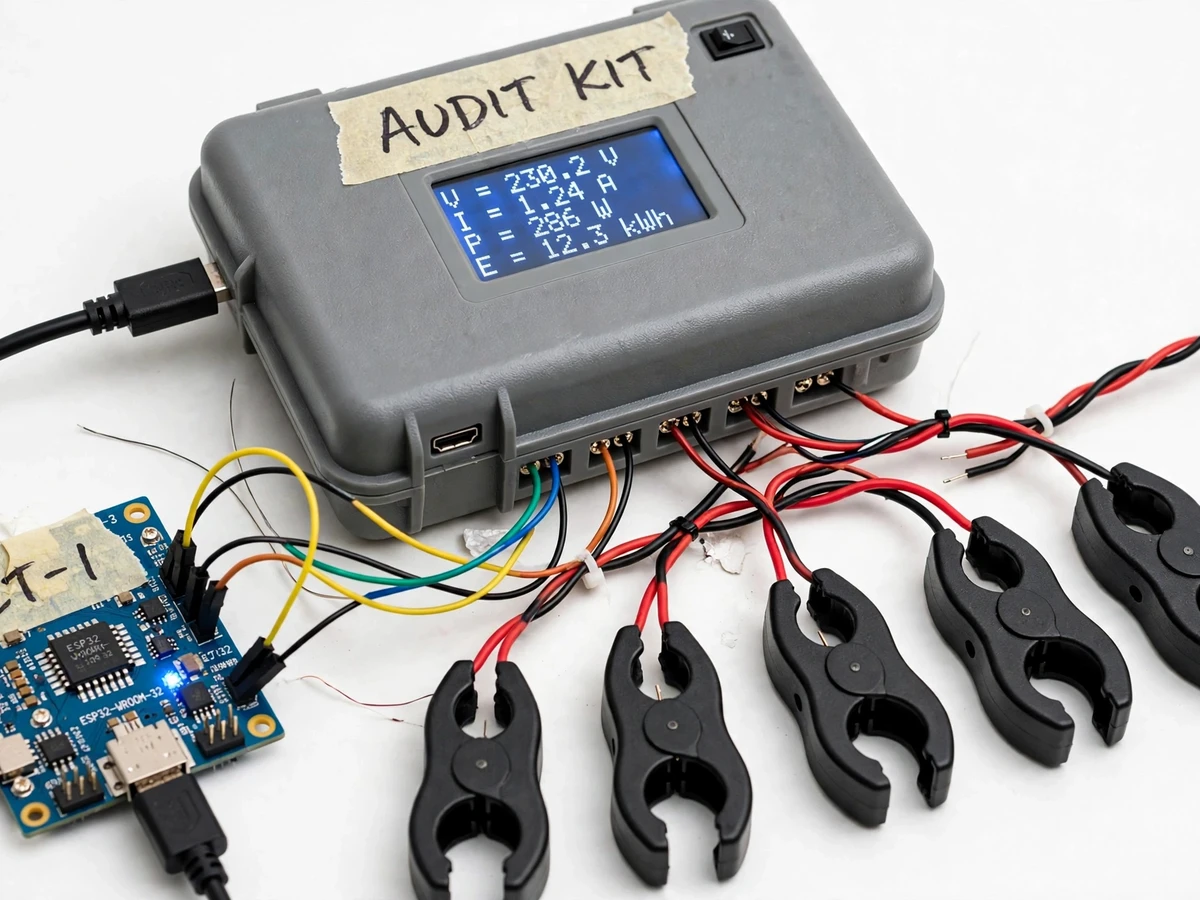
- [On-device LCD] A 16x2 display shows live voltage, current, power and energy at the panel, so the kit works as a standalone meter without the cloud.
- [Buyer-run calibration] A documented procedure compares each channel against a reference plug-in power meter so the student verifies accuracy on their own build.
- [Exportable audit report] Daily and period summaries export as CSV for the audit report's measured-data appendix.
What is included
- Portable audit kit hardware: controller, 5 split-core CTs, metering module, LCD, enclosure
- ESP32 firmware with MQTT telemetry and on-device display
- Cloud dashboard source (single-file web app) with findings engine
- CT gain/phase calibration procedure with reference-meter comparison sheet
- Audit report template with measured-data appendix format
- Wiring and deployment guide (qualified-person panel work notes)
- Project report PDF (metering theory, CT principles, tariff analysis method)
- PPT presentation for final review
- Viva Q&A preparation document (true vs apparent power, CT burden, MQTT, power factor)
Limitations & prerequisites
- Demo scale is single-phase; a three-phase plant needs three voltage references and is documented as an extension, not included.
- This is an audit instrument, not a revenue/billing meter — utility billing disputes are out of scope.
- CT accuracy follows the sensor's datasheet class; the buyer verifies it with the included calibration procedure rather than trusting a claimed figure.
- Findings are heuristic flags from electrical data, not a substitute for a professional energy auditor's judgment.
- Panel connection must be done by a qualified person; the kit is not a DIY mains-wiring project for unsupervised students.
- Cloud features need Wi-Fi; the kit falls back to on-device LCD logging display when offline.
Frequently Asked Questions
How is this different from a clamp meter?
A clamp meter gives spot readings; this kit logs five channels continuously for days, computes energy and cost per load, and automatically flags waste patterns. The audit report is built from a measured time series, not a few snapshots.
Do the CTs need the wires to be disconnected?
No. Split-core CTs open like a clamp and close around the conductor, so installation needs no shutdown — though panel work must still be done by a qualified person.
How accurate are the readings?
The CTs carry a datasheet accuracy of approximately ±1% over their rated range; the metering module adds its own small error. The kit ships with a buyer-run calibration procedure against a reference meter so the report states verified, not claimed, accuracy.
What do the auto-generated findings actually detect?
Sustained power draw with no load cycling (idle-running), lighting's share of daytime consumption, and average power factor below the 0.90 contract threshold — each with an estimated daily cost at the configured tariff.
Can it monitor a three-phase factory?
As built it is single-phase demo scale. The firmware and dashboard are structured for three-phase extension (three voltage references, per-phase channels), documented as future scope.
Is this project suitable for a final-year project?
Yes — for Electrical, Electronics and Instrumentation programs. It combines electrical measurement, embedded firmware, wireless telemetry and data-driven reporting in one demonstrable build. Suitable for B.E./B.Tech final-year projects in Electrical, Electronics and Instrumentation.
Components & software requirements
- ESP32 (Wi-Fi controller)
- SCT-013 class split-core CTs (5 channels)
- PZEM-class AC metering module
- MQTT telemetry (JSON payloads)
- Web cloud dashboard (HTML, CSS, JavaScript)
- Arduino IDE (C/C++ firmware)
- 16x2 LCD with on-device UI
- USB / Li-ion power option
Delivery information
Built-to-order project. Delivery timeline is shared after order confirmation based on current queue.
Support terms
Complete documentation, setup guide, and viva preparation included. Support for setup and explanation provided.