
More project photos (2)
The problem
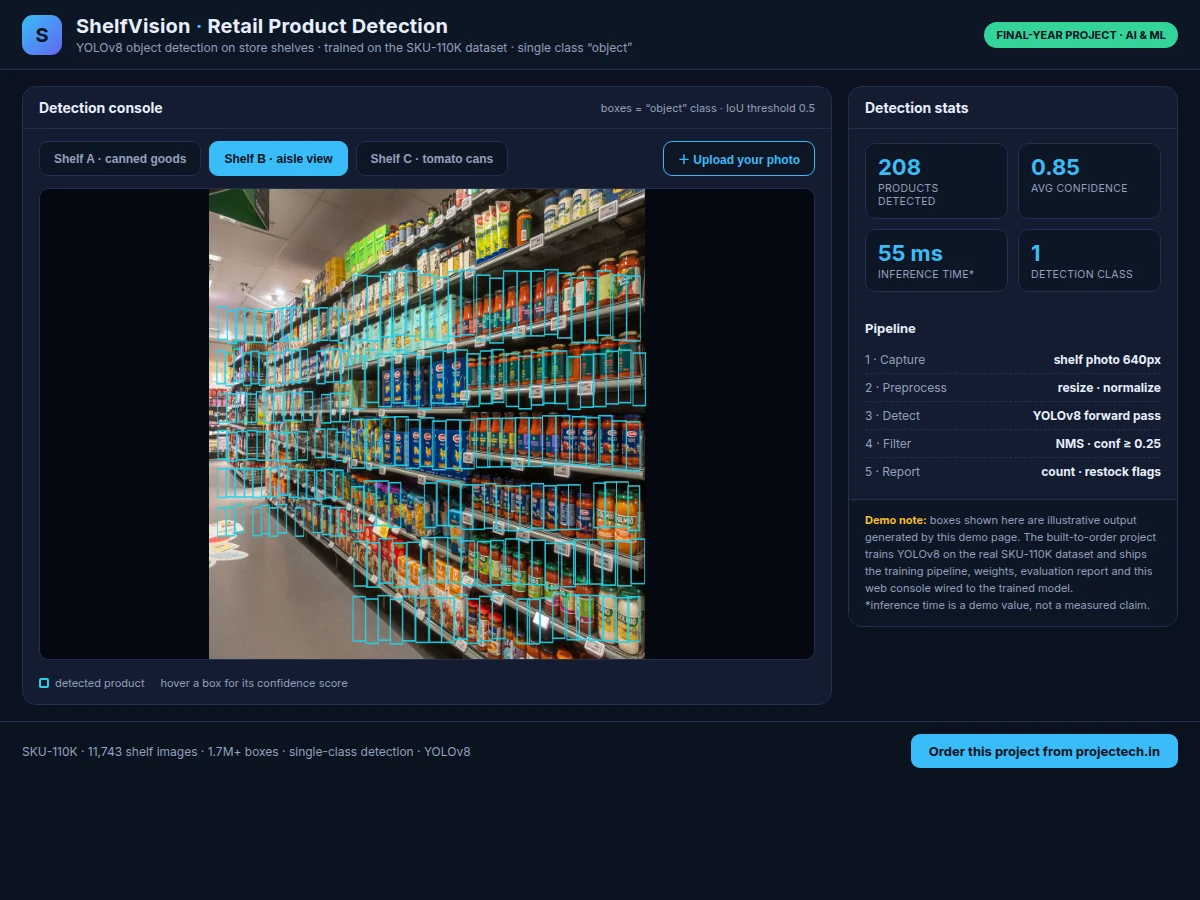
Retail staff still check shelves by hand: walking aisles, photographing displays, and comparing what is on the shelf against what should be there. It is slow, inconsistent, and scales badly across stores — and it is the dense visual scene object detectors are built for. The SKU-110K dataset captures this reality: over 11,000 store-shelf photographs, packed with more than 1.7 million annotated products at an average of about 147 per image. This project trains YOLOv8 on that dataset to find every visible product in a shelf photo and count it, under a single class labelled "object". A web detection console shows the idea working end to end: upload a shelf photo and the interface overlays bounding boxes plus a product count and timing summary. Because the model detects rather than classifies, the viva discussion centres on detection metrics — precision, recall, mAP and IoU — instead of hand-waving about accuracy.
Prepares the SKU-110K data, trains YOLOv8 and evaluates the detector on the held-out test split.
Follow the working sequence
How it works
- The 11,743 SKU-110K shelf images are converted to YOLO format and kept in the official split — 8,219 train, 588 validation, 2,936 test — with every product box under the single class "object".
- Training images are resized to 640×640 and augmented (mosaic, HSV jitter, horizontal flip) so the detector tolerates varied store lighting and camera angles.
- The YOLOv8 anchor-free detection head is trained for approximately 100 epochs on GPU, with the best checkpoint selected on validation mAP@0.5.
- On the held-out test split the model is evaluated once: precision, recall, mAP@0.5, mAP@0.5:0.95 and PR curves are generated for the report (design target mAP@0.5 ≈ 0.60).
- At inference, a shelf photo is resized to 640×640, passed through the network in one forward pass, and raw predictions are filtered by non-maximum suppression at IoU 0.5 with confidence ≥ 0.25.
- The web console draws every surviving box on the photo, counts the products, and reports average confidence and inference time (expected 40–80 ms per image on a T4-class GPU).
Tech stack:
- Python 3, PyTorch
- Ultralytics YOLOv8
- OpenCV
- SKU-110K dataset
- NumPy, Matplotlib
- Jupyter Notebook (training & evaluation)
- HTML5 + JavaScript (detection console)
- Git
Dataset & model details
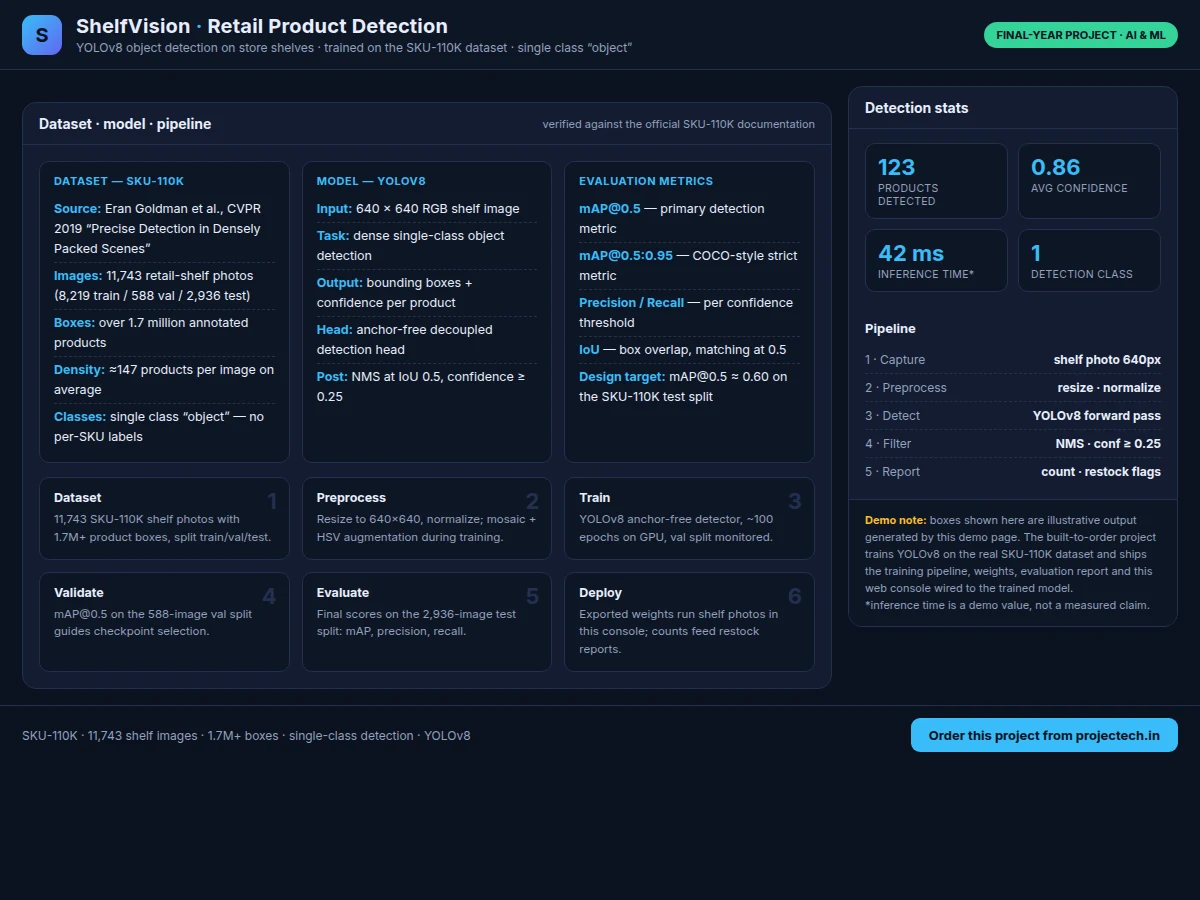
- Dataset: SKU-110K — 11,743 densely packed retail-shelf images (8,219 train / 588 val / 2,936 test), over 1.7 million annotated product bounding boxes, average ≈147 products per image. Created by Eran Goldman et al. for the CVPR 2019 paper "Precise Detection in Densely Packed Scenes".
- Task: Single-class object detection — input = 640×640 RGB shelf image, output = bounding boxes + confidence scores for the one class "object". The dataset carries no per-SKU labels: the "110K" refers to unique store-keeping units pictured, not to detection classes.
- Model: YOLOv8 anchor-free detector (decoupled detection head). Input is the resized shelf photo; the head predicts box coordinates and objectness per grid cell; non-maximum suppression (IoU 0.5, confidence ≥ 0.25) produces the final product list.
- Metrics: mAP@0.5 ≈ 0.60 (design target on the test split, not a measured claim), mAP@0.5:0.95, precision and recall per confidence threshold, PR curves. Final performance depends on the dataset split, augmentation, model variant and training conditions — the evaluation report documents the actual achieved figures after the training run.
| Parameter | Value |
|---|---|
| Input image | 640 × 640 RGB, normalized (training and inference) |
| Dataset | SKU-110K — 11,743 shelf images (8,219 train / 588 val / 2,936 test), official split |
| Annotations | Over 1.7 million product bounding boxes, single class "object" |
| Average density | Approximately 147 products per image (dataset statistic) |
| Model | YOLOv8, anchor-free decoupled detection head |
| Detection metric | mAP@0.5 ≈ 0.60 (design target on test split, not a measured claim) |
| Inference | Approximately 40–80 ms per image on a T4-class GPU (expected) |
| NMS settings | IoU threshold 0.5, confidence threshold 0.25 |
| Weights file | Approximately 20–70 MB (.pt, depends on YOLOv8 variant selected) |
| Training time | Approximately 8–12 hours for ~100 epochs on a T4-class GPU (expected) |
Project features
- [YOLOv8 dense-shelf detector] An anchor-free YOLOv8 detector trained on SKU-110K to localize every visible product under one "object" class, tuned for scenes holding 100+ tightly packed items per image.
- [Bounding-box overlay console] A web console where you select or upload a shelf photo and see every detection drawn with its confidence score on hover, alongside a per-image product count.
- [Detection statistics panel] Products counted, average confidence and inference time are shown beside every result, so the demo output is measurable rather than decorative.
- [SKU-110K training pipeline] A reproducible training script covering dataset download and YOLO-format conversion, the official train/val/test split, augmentation presets, and checkpoint selection on validation mAP.
- [Evaluation report] Precision, recall, mAP@0.5 and mAP@0.5:0.95 computed on the held-out test split, with PR curves and per-confidence-threshold analysis for the report and viva.
- [Shelf-gap highlighting] A density heuristic that compares local detection counts against the image median and flags unusually sparse shelf zones, showing how detection output turns into a store-operations signal.
- [Exported weights + inference script] Trained .pt weights plus a standalone Python script (shelf image in, annotated image and JSON detections out) so detection runs anywhere Python does.
- [Viva-ready documentation] Architecture rationale, hyperparameter notes, plain-language definitions of mAP, IoU and NMS, and a Q&A document written around the exact dataset and model shipped.
What is included
- Reproducible YOLOv8 training pipeline (data preparation, training and evaluation scripts)
- Trained model weights (.pt) with a standalone inference script
- Web-based detection console wired to the trained model
- Evaluation report: mAP@0.5, mAP@0.5:0.95, precision/recall, PR curves
- Project report PDF (dataset background, YOLOv8 theory, methodology, results)
- PPT presentation for final review
- Viva Q&A document (detection metrics, NMS, anchor-free design, dataset limits)
Limitations & prerequisites
- Single-class detection only: the model finds products but cannot tell a cola can from a soup can — SKU-110K carries no per-product labels, so per-SKU classification is future scope, not part of this build.
- The mAP@0.5 ≈ 0.60 figure is a design target, stated honestly — the evaluation report documents the actual achieved figure after the training run for the order.
- Public-dataset domain gap: SKU-110K shelves come from stores worldwide, so a dimly lit local shelf with unfamiliar packaging may detect worse without fine-tuning on local photos.
- Very small or heavily occluded products at the back of deep shelves can be missed — dense detection is strong but not perfect.
- Training needs a CUDA GPU (approximately 8–12 hours on a T4-class card); CPU-only training is not practical for a dataset of this size.
- The console runs the trained model on still photos; continuous video-stream shelf monitoring is not part of the base build.
Frequently Asked Questions
Which dataset is used?
SKU-110K by Eran Goldman et al. (CVPR 2019, "Precise Detection in Densely Packed Scenes") — 11,743 store-shelf photos with over 1.7 million product bounding boxes, split 8,219 train / 588 val / 2,936 test.
Does it recognize individual products or brands?
No — and this is an important viva point. SKU-110K annotates every product under a single "object" class, so the model counts and localizes products without naming them. Per-SKU classification would need a relabelled or custom dataset and is listed as future scope.
Which model is used and why YOLOv8?
YOLOv8's anchor-free detection head handles extreme object density well, and the Ultralytics training pipeline is thoroughly documented, which makes the training methodology easy to defend in a viva.
Is the mAP figure guaranteed?
No measured result is claimed before the training run. The design target is mAP@0.5 ≈ 0.60 on the SKU-110K test split; the evaluation report documents the actual achieved figure after training.
Can it work with my own store's shelf photos?
Yes — the console accepts uploaded photos. Accuracy on an unseen store depends on how similar its shelves are to the dataset; fine-tuning on a small set of the store's own labelled photos is the documented path to close that gap.
Is this project suitable for a final-year project?
Yes — for Computer Science, IT and AI/ML programs. It demonstrates dataset handling at scale, object-detection training and evaluation, detection metrics (mAP, IoU, NMS) and a working deployment demo.
Components & software requirements
- Python 3, PyTorch
- Ultralytics YOLOv8
- OpenCV
- SKU-110K dataset
- NumPy, Matplotlib
- Jupyter Notebook (training & evaluation)
- HTML5 + JavaScript (detection console)
- Git
Dataset & model details
- Dataset: SKU-110K — 11,743 densely packed retail-shelf images (8,219 train / 588 val / 2,936 test), over 1.7 million annotated product bounding boxes, average ≈147 products per image. Created by Eran Goldman et al. for the CVPR 2019 paper "Precise Detection in Densely Packed Scenes".
- Task: Single-class object detection — input = 640×640 RGB shelf image, output = bounding boxes + confidence scores for the one class "object". The dataset carries no per-SKU labels: the "110K" refers to unique store-keeping units pictured, not to detection classes.
- Model: YOLOv8 anchor-free detector (decoupled detection head). Input is the resized shelf photo; the head predicts box coordinates and objectness per grid cell; non-maximum suppression (IoU 0.5, confidence ≥ 0.25) produces the final product list.
- Metrics: mAP@0.5 ≈ 0.60 (design target on the test split, not a measured claim), mAP@0.5:0.95, precision and recall per confidence threshold, PR curves. Final performance depends on the dataset split, augmentation, model variant and training conditions — the evaluation report documents the actual achieved figures after the training run.
Delivery information
Built-to-order project. Delivery timeline is shared after order confirmation based on current queue.
Support terms
Complete documentation, setup guide, and viva preparation included. Support for setup and explanation provided.
Download free synopsis (PDF)
Enter your name and email — the synopsis PDF downloads immediately. We may send occasional project updates; no spam, unsubscribe anytime.