
More project photos (2)

The problem
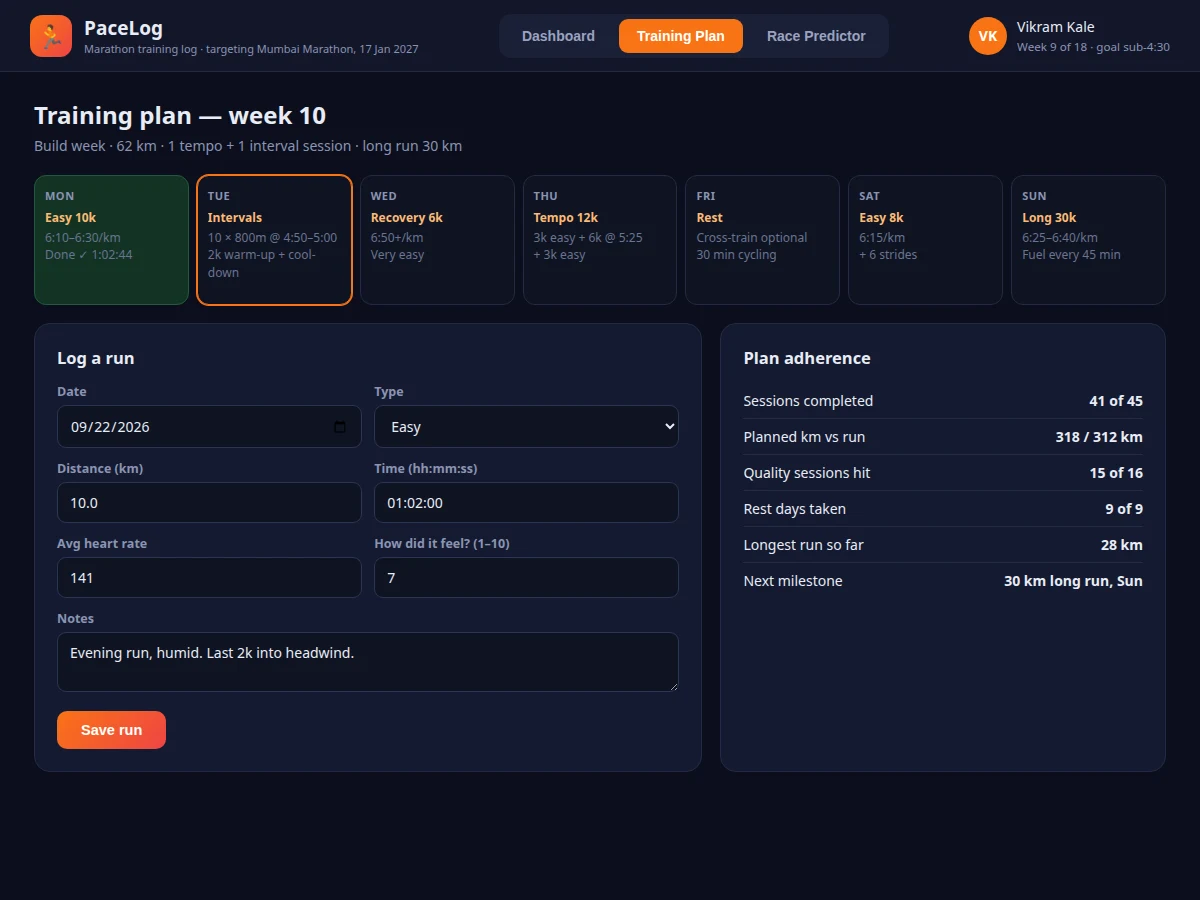
Runners training for a marathon juggle a spreadsheet for mileage, a watch app for splits, and a PDF plan from the internet — nothing connects the plan to what was actually run. This project builds one training log that does. Every run is logged with distance, time, heart rate and perceived effort; weekly mileage charts against the plan; pace zones are computed from the runner's own time trial (recovery, easy, tempo, interval); and a week-view plan shows each day's prescribed session with completion status. The race predictor applies the standard Riegel formula to recent performances to estimate 5K through marathon times, labelled honestly as estimates. The "what moves the needle" panel connects inputs (long-run completion, mileage, tempo pace) to the goal time. Everything is computed transparently from the runner's own data — no black boxes, which makes the viva straightforward.
How it works
- The runner sets a goal race and date (e.g. Mumbai Marathon, 17 Jan 2027) and a goal time.
- A recent time trial (e.g. 10K in 48:12) seeds the pace zones; the plan's prescribed paces derive from these zones.
- Each run is logged with distance, time, HR and feel; the app classifies it into a zone and updates weekly totals.
- The dashboard shows mileage charts, zone distribution and adherence; missed sessions are visible, not hidden.
- The predictor re-computes after every time trial or race, showing predicted times per distance with required average pace for the goal.
- The "what moves the needle" panel flags which inputs are on track and which need work (e.g. tempo pace under 5:20/km by week 14).
Tech stack:
- PHP 8 (backend)
- MySQL (runs, plans, time trials, goals)
- HTML5, CSS3, JavaScript + SVG charts
- Session-based auth
| Parameter | Value |
|---|---|
| Architecture | PHP + MySQL, single-user training log |
| Pace computation | From logged distance/time; zones from time-trial input |
| Prediction | Riegel formula, exponent 1.06, labelled as estimate |
| Charts | Weekly mileage, zone distribution, adherence (SVG) |
| Database tables | Approximately 6 (users, runs, plans, plan_days, trials, goals) |
| Deployment | LAMP / shared hosting; mobile-responsive for post-run logging |
Project features
- [Run logging] Log distance, time, heart rate, perceived effort and notes per run; pace auto-computes from distance and time.
- [Weekly mileage charts] Bar charts of km per week against planned mileage, with the current week highlighted.
- [Pace zones from time trial] Enter a recent race/time-trial result; recovery, easy, tempo and interval zones are computed and every run is classified.
- [Week-view training plan] Seven-day plan cards (easy, intervals, tempo, rest, long run) with prescribed paces and completion ticks.
- [Riegel race predictor] Predicted 5K/10K/half/marathon times from recent performances using T₂ = T₁ × (D₂/D₁)^1.06, shown as estimates.
- [80/20 intensity tracking] Share of easy vs quality running per block, compared against the polarized-training guideline.
- [Plan adherence stats] Sessions completed, planned vs actual km, quality sessions hit — the numbers a coach would ask for.
What is included
- Complete web app source (dashboard, plan view, predictor, logging)
- MySQL schema with a sample 9-week training block
- Pace-zone calculator and Riegel predictor modules
- Project report PDF (requirements, formulas, data model, screenshots, testing)
- PPT presentation for final review
- Viva Q&A preparation document (Riegel formula, pace zones, 80/20, charting)
Limitations & prerequisites
- Race predictions are estimates from an empirical formula; the UI labels them as such — actual race performance varies with weather, course and health.
- Pace zones derive from a single time-trial input; the app does not auto-detect fitness from watch data in the base build.
- Run data is entered manually; GPS watch sync (Strava/Garmin import) is future scope, not in the base build.
- The training plan is a built-in 18-week template adjusted by zones, not a fully personalized AI coach — no such claim is made.
- Heart-rate zones are not computed in the base build; HR is logged and displayed only.
Frequently Asked Questions
How does the race predictor work?
It uses the Riegel formula — predicted time = known time × (new distance / known distance)^1.06 — applied to your best recent performance. It is a well-known empirical estimate, presented as one, not a guarantee.
Where do pace zones come from?
From a time trial or recent race you enter. Standard percentage-based zone math converts that single performance into recovery/easy/tempo/interval ranges.
Can it import from Strava or Garmin?
Not in the base build — runs are logged manually. A CSV/GPX import is documented as future scope in the report.
What is the 80/20 split it shows?
The share of training time spent easy vs hard, computed from your logged runs' zone classification, compared against the polarized-training guideline coaches use.
Does it adjust the plan if I miss sessions?
The base build shows adherence honestly (missed sessions stay visible); automatic plan rescheduling is listed as future scope.
Is this project suitable for a final-year project?
Yes — for Computer Science, IT and Web Development programs. It demonstrates data modelling for time series, formula-driven features, charting and sports-domain thinking. Suitable for B.E./B.Tech final-year projects in Computer Science, IT and Web Development.
Components & software requirements
- PHP 8 (backend)
- MySQL (runs, plans, time trials, goals)
- HTML5, CSS3, JavaScript + SVG charts
- Session-based auth
Delivery information
Built-to-order project. Delivery timeline is shared after order confirmation based on current queue.
Support terms
Complete documentation, setup guide, and viva preparation included. Support for setup and explanation provided.