
More project photos (3)
The problem
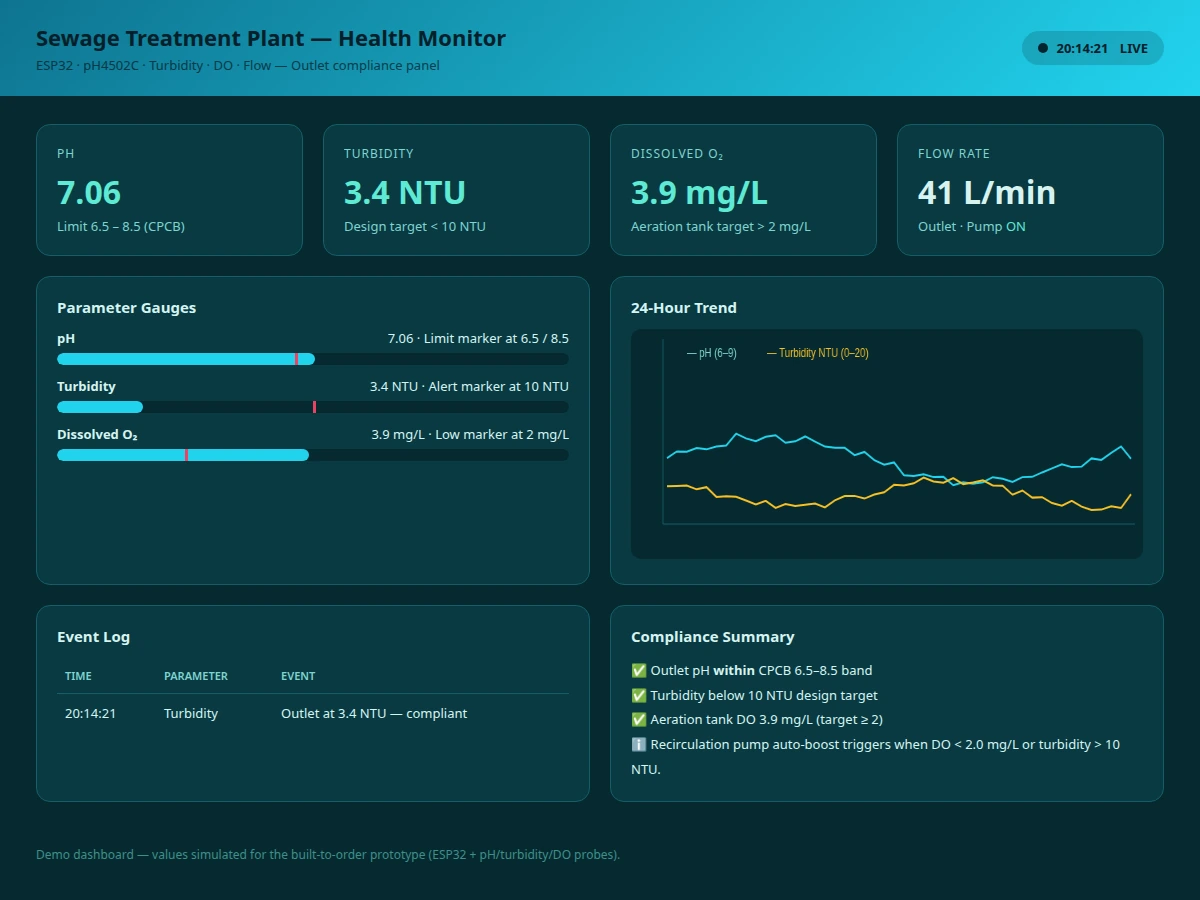
Small sewage treatment plants at apartments, hospitals and campuses usually check treated-water quality with occasional manual sampling — problems are discovered days late, after non-compliant water has already been discharged or reused for gardening. Lab analysis per sample is slow and expensive, so monitoring simply doesn't happen continuously. This project builds the continuous layer: rugged-ish sensor probes at the outlet stream pH, turbidity, dissolved oxygen and flow readings to an ESP32, which checks them against configured compliance bands every few seconds. The dashboard turns the raw numbers into an at-a-glance plant health view — gauges with limit markers, trend charts, an event log of every threshold excursion, and a plain-language compliance summary the operator can actually act on.
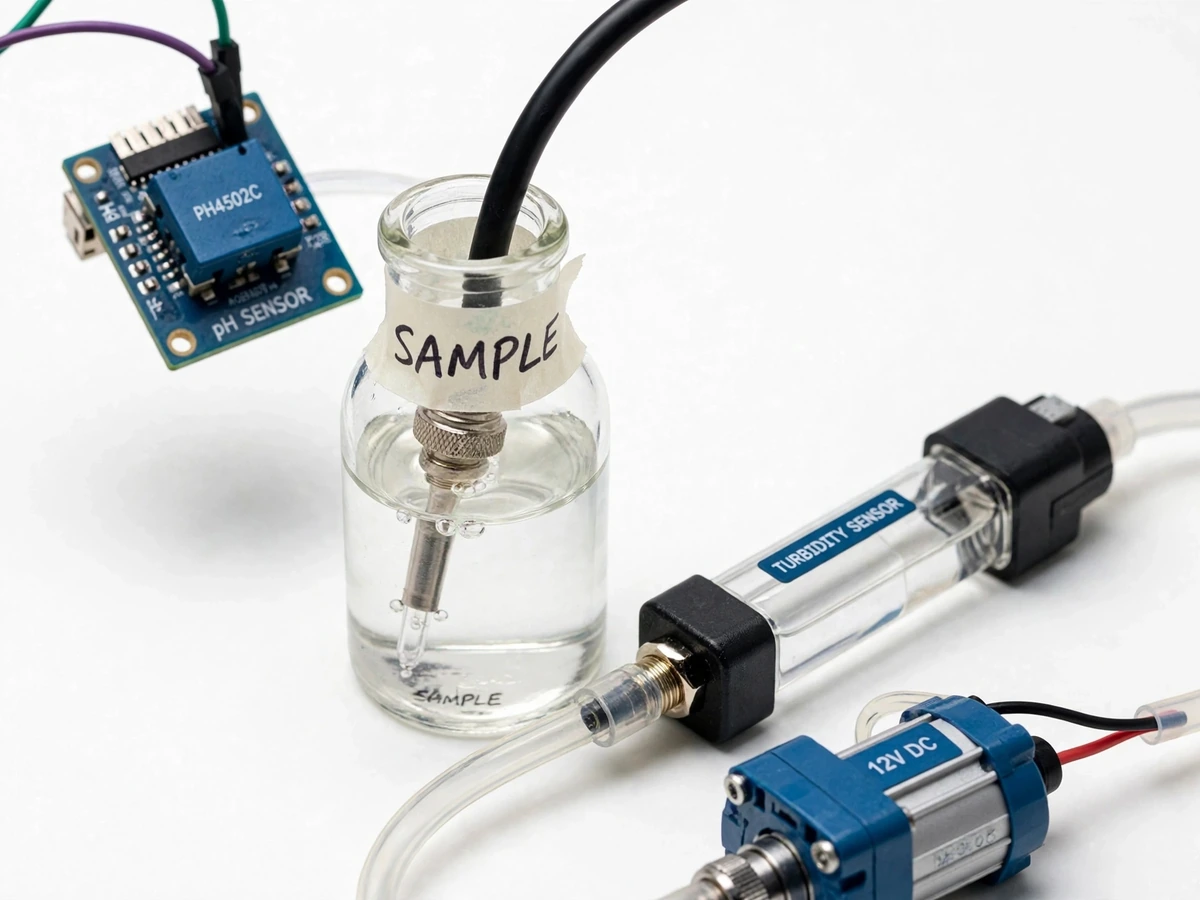
pH, turbidity, dissolved-oxygen and flow sensors in the outlet sample stream.
Follow the working sequence
How it works
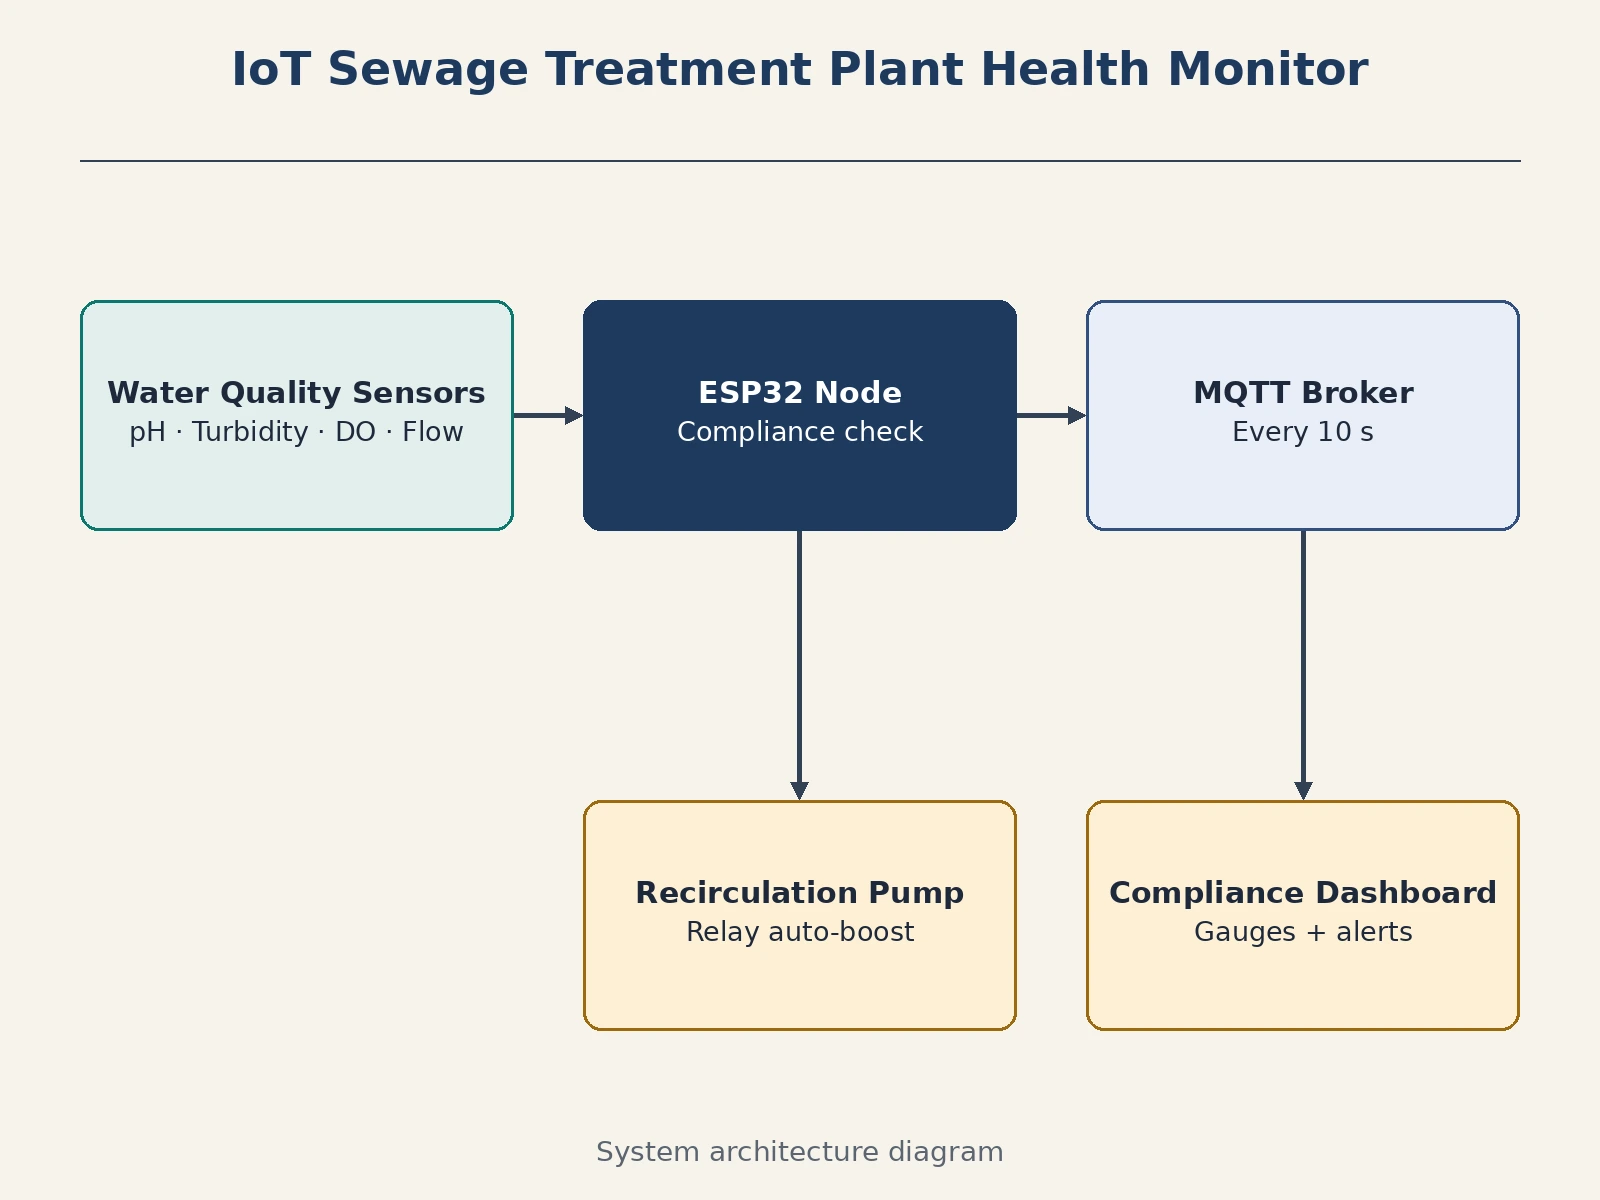
- The pH probe, turbidity sensor, DO probe and flow sensor sit in the outlet sample stream and report to the ESP32.
- Firmware applies calibration curves, medians-filters each channel over a 30-second window, and publishes readings via MQTT.
- The compliance engine compares each filtered reading against its configured band and latches an excursion state on breach.
- On excursion, the dashboard flags the gauge, appends to the event log, and optionally energizes the pump-boost relay.
- The dashboard redraws gauges, the 24-hour trend chart and the compliance summary from the rolling telemetry buffer.
- Operators run calibration routines from the dashboard; calibration constants persist in ESP32 flash.
Tech stack:
- ESP32 + pH4502C pH module + TSW-20M/TSK turbidity sensor + DO probe + YF-S201 flow sensor
- Relay output for pump boost, 0.96" OLED local readout
- MQTT (Mosquitto) telemetry
- Python/Flask or Node.js dashboard backend
- HTML/CSS/JS compliance dashboard (single-file demo included)
- SQLite for excursion history
| Parameter | Value |
|---|---|
| Controller | ESP32 |
| pH | pH4502C module + glass electrode, 0–14 range (datasheet) |
| Turbidity | Optical sensor, 0–1000 NTU nominal (datasheet) |
| Dissolved oxygen | Galvanic DO probe, 0–20 mg/L nominal (datasheet) |
| Flow | YF-S201 hall-effect, ~1–30 L/min (datasheet) |
| Sampling | 10 s MQTT publish; 30 s median filter (design target) |
| Compliance bands | Configurable; defaults per CPCB discharge norms |
| Pump control | Relay boost on DO < 2 mg/L or turbidity excursion |
| History | SQLite excursion log, CSV export |
Project features
- [Four-parameter sensing] pH (pH4502C), turbidity (TSK-060 optical), dissolved oxygen and flow rate sampled continuously at the outlet.
- [Compliance band engine] Every reading is checked against configurable bands (e.g. CPCB pH 6.5–8.5); excursions raise alerts and are logged with timestamps.
- [Live compliance dashboard] Gauges with limit markers, 24-hour trend charts, event log and a plain-language compliance summary.
- [Pump auto-boost] A relay output boosts the recirculation/aeration pump when dissolved oxygen sags or turbidity spikes, with manual override.
- [Excursion history] Every threshold breach is recorded with start time, peak value and recovery time for the operator's records.
- [Sensor calibration mode] Two-point pH calibration and turbidity zero/span routines run from the dashboard with guided steps.
- [MQTT telemetry] Readings publish over MQTT every 10 seconds; the dashboard and logger subscribe independently.
What is included
- Sensor node hardware (ESP32 + 4 sensors + relay + OLED)
- Firmware (sampling, filtering, calibration, MQTT, pump logic)
- Compliance dashboard web application (gauges, trends, log, summary)
- Single-file dashboard demo for presentation
- Wiring diagram, probe mounting and calibration guide
- Project report PDF (background, sensing methods, compliance logic, calibration procedure, results)
- PPT presentation for final review
- Viva Q&A preparation document (pH sensing, turbidity optics, DO, MQTT, compliance bands)
Limitations & prerequisites
- This is an educational monitoring prototype, not a certified compliance instrument — readings support operational insight, not regulatory reporting, stated plainly.
- Hobby-grade probes drift and foul: pH needs regular two-point calibration and the turbidity optics need cleaning; the maintenance schedule is documented.
- Sensor accuracy figures are datasheet nominals; field accuracy is established by the buyer's calibration procedure, not claimed as measured.
- The sample-stream plumbing (bypass loop, probe holders) must be built to suit the actual plant — the guide covers principles, not a universal fitting.
- Pump auto-boost is a simple threshold relay, not a process-control loop — tuning for a real plant is the operator's responsibility.
- Biofouling and harsh effluent will shorten probe life; probes are treated as consumables in the documentation.
Frequently Asked Questions
Which parameters does it monitor?
pH, turbidity, dissolved oxygen and flow rate at the plant outlet — the core indicators of treated-water quality for a small STP.
Does it prove CPCB compliance?
No. It is an educational monitoring prototype, not a certified instrument. It watches the same bands continuously so operators catch problems early, but regulatory reporting needs lab analysis.
How often do the sensors need calibration?
pH needs two-point calibration on a regular schedule (weekly in the documentation), and turbidity needs periodic zero/span checks. The dashboard walks the operator through both.
What happens when a parameter goes out of band?
The dashboard flags the gauge, logs the excursion with timestamps, and can auto-boost the recirculation pump — with manual override always available.
Can it fit any STP?
The electronics are plant-agnostic, but the sample-stream plumbing must be adapted to the actual outlet — the guide covers the principles for building the bypass loop.
Is this project suitable for a final-year project?
Yes — for IoT & Embedded, Electronics and instrumentation-oriented programs. It combines multi-sensor interfacing, calibration discipline, telemetry and a compliance-focused dashboard. Suitable for B.E./B.Tech final-year projects in IoT & Embedded Systems and Electronics.
Components & software requirements
- ESP32 + pH4502C pH module + TSW-20M/TSK turbidity sensor + DO probe + YF-S201 flow sensor
- Relay output for pump boost, 0.96" OLED local readout
- MQTT (Mosquitto) telemetry
- Python/Flask or Node.js dashboard backend
- HTML/CSS/JS compliance dashboard (single-file demo included)
- SQLite for excursion history
Delivery information
Built-to-order project. Delivery timeline is shared after order confirmation based on current queue.
Support terms
Complete documentation, setup guide, and viva preparation included. Support for setup and explanation provided.
Download free synopsis (PDF)
Enter your name and WhatsApp number — the synopsis PDF downloads immediately. We may send occasional project updates on WhatsApp; no spam.