
More project photos (2)
The problem
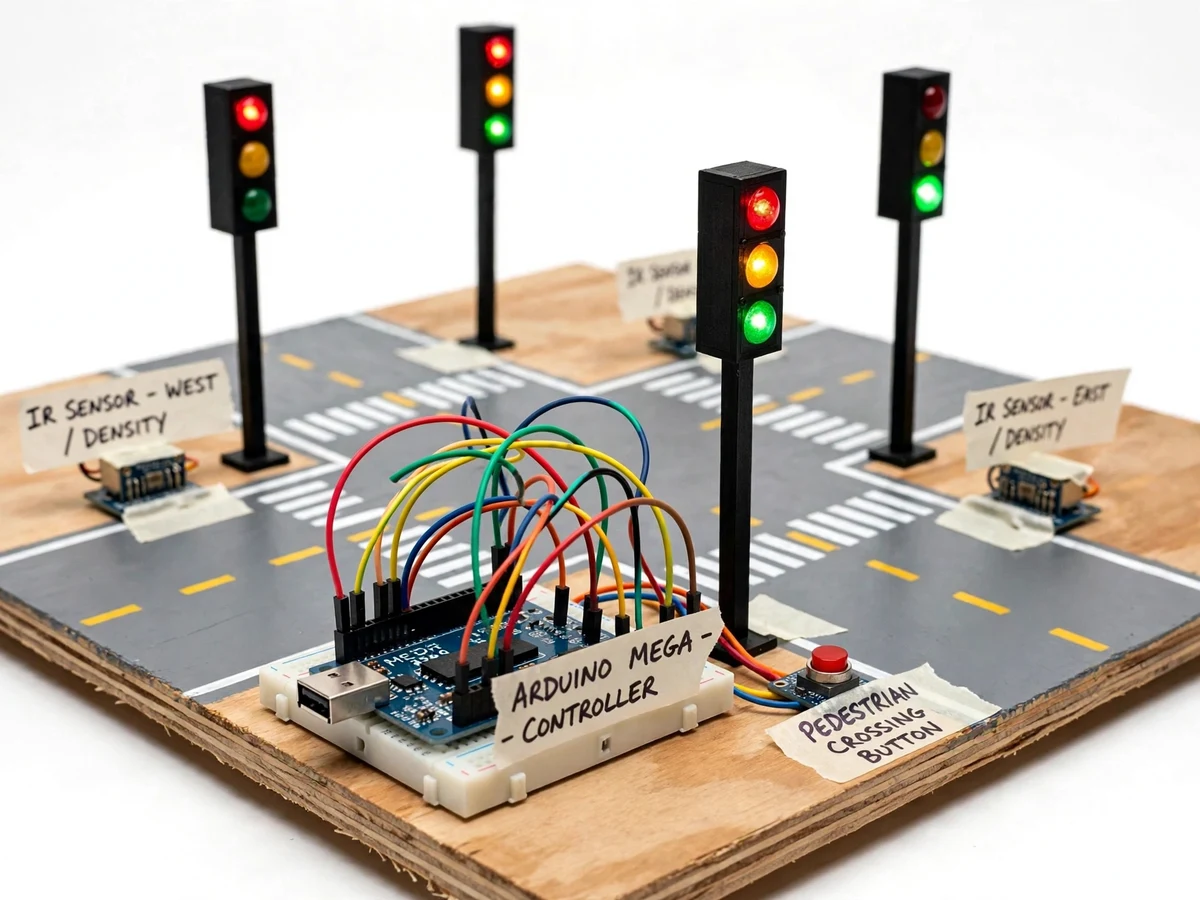
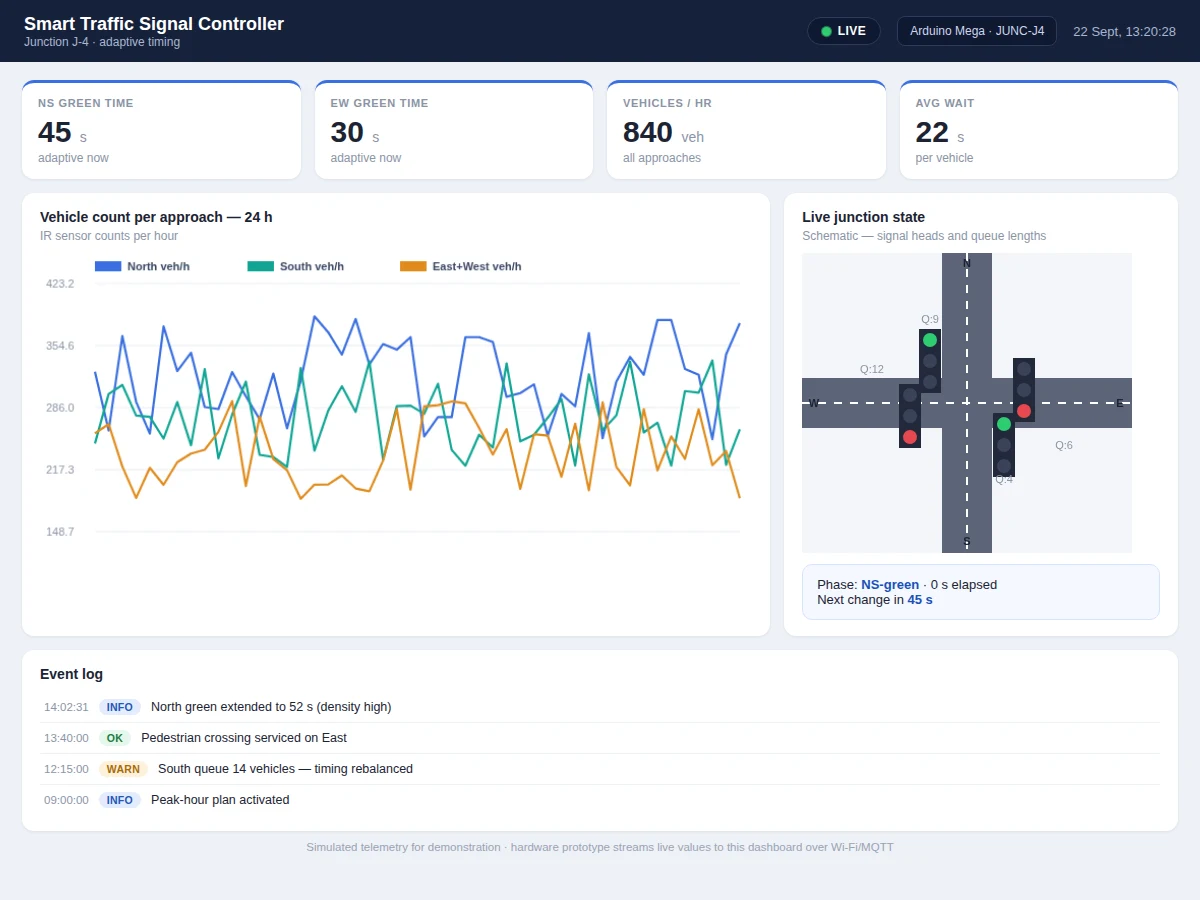
Fixed-time traffic signals waste green time on empty approaches while vehicles queue on the busy ones — every commuter knows the feeling. The fix is density-responsive control: measure the actual vehicle count per approach and allocate green time where the queue is. This project demonstrates it on a 4-way junction model: IR sensor pairs count vehicles entering each approach, an Arduino Mega runs the adaptive timing state machine with minimum/maximum green bounds and amber clearance, and LED signal heads show the live phases. A dashboard mirrors the junction schematically with live signal states, per-approach vehicle counts, the current phase timer and a log of timing decisions. Pedestrian demand is handled with a crossing button. The project keeps claims honest: it demonstrates the control logic and the sensing method at model scale, with the report discussing what a real deployment would add — loops or cameras, conflict monitoring and fail-safe design.
How it works
- IR sensor pairs on each approach detect passing model vehicles; firmware debounces and increments the per-approach count.
- At each phase decision point, the controller compares approach densities and computes green times within the configured min/max bounds.
- The Arduino Mega drives the 4-way LED signal heads through the green-amber-all-red sequence with the computed timings.
- Counts, phase state and timing decisions are sent to the dashboard, which renders the live junction schematic and the decision log.
- A pedestrian button press queues a crossing phase, serviced at the next safe point in the cycle.
- The emergency override input, when active, holds the priority approach green and logs the preemption event.
- Scripted scenarios in the manual let the demonstrator show fixed-time vs adaptive behaviour side by side.
Tech stack:
- Arduino Mega 2560
- IR sensor modules x8 (approach pairs)
- 4-way LED signal head model
- Pedestrian crossing button + indicators
- ESP8266/ESP32 telemetry link (dashboard)
- Web dashboard (junction schematic)
- 4-way junction demonstration model
- Emergency override switch (demo)
| Parameter | Value |
|---|---|
| Controller | Arduino Mega 2560 (timing-critical I/O); telemetry via serial/Wi-Fi link |
| Approaches | 4, each with IR count pair |
| Green bounds | Configurable min/max per phase (e.g. 15-60 s model scale) |
| Phases | Green, amber (4 s), all-red clearance, pedestrian phase |
| Dashboard | Live junction schematic, per-approach counts, phase timer, decision log |
| Pedestrian | Demand button with serviced-phase logging |
| Emergency | Priority-hold input with preemption logging |
| Power | 5 V / 12 V DC for logic and signal heads (expected) |
Project features
- [Per-approach vehicle counting] IR sensor pairs on all four approaches count vehicles in, giving the density input the controller decides on.
- [Adaptive green timing] Green time per phase adapts between configured minimum and maximum bounds based on measured approach density — busy approaches earn more green.
- [Full phase state machine] Green, amber and all-red clearance phases with pedestrian servicing follow a proper signal-timing structure, not just blinking lights.
- [Live junction dashboard] A schematic junction view with live signal heads, per-approach counts, phase timer and the timing-decision log.
- [Pedestrian handling] A crossing button inserts a pedestrian phase; the dashboard logs pedestrian services.
- [Emergency override input] A documented priority input holds green for the emergency approach — demonstrated with a switch, discussed for real sirens/RF.
- [Scenario demonstration] The manual includes scripted traffic scenarios (rush on north, balanced, night-low) to show the adaptation clearly in the viva.
What is included
- Working 4-way junction model (signal heads, IR sensors, pedestrian crossing, controller)
- Complete firmware source (counting, adaptive timing state machine, pedestrian, preemption)
- Live web dashboard (junction schematic, counts, decision log) demonstrated with the model
- Circuit and wiring documentation
- Scripted demonstration scenarios (rush, balanced, night) with expected outcomes
- Component list with ratings
- Project report PDF (signal timing background, adaptive control, sensor methods, methodology)
- PPT presentation for final review
- Viva Q&A preparation document (signal phases, density control, IR sensing, fail-safety)
- Setup and demonstration guide
Limitations & prerequisites
- Demonstrated at model scale with IR counting — real junctions use inductive loops, radar or cameras, discussed as deployment notes in the report.
- IR pairs count objects breaking the beam; tailgating vehicles can under-count, which the manual notes.
- The emergency override is a demonstrated input, not a certified preemption system with conflict monitoring.
- Timing bounds are model-scale seconds; real junction timings follow IRC/traffic engineering standards, referenced in the report.
- Fail-safe behaviour (e.g. flashing amber on sensor fault) is implemented at demo level; certified conflict monitors are out of scope.
Frequently Asked Questions
How does it decide the green time?
At each phase decision, the controller reads the per-approach vehicle counts from the IR pairs and allocates green time proportionally within configured minimum and maximum bounds — a busy approach earns a longer green, an empty one gets the minimum. Amber and all-red clearance are fixed for safety.
What does the dashboard show?
A live schematic of the junction with the actual signal-head states, per-approach vehicle counts, the current phase and its timer, and a log of every timing decision with its reason.
How are vehicles counted?
IR sensor pairs on each approach — a break-beam event increments the count with debouncing. The manual documents the counting accuracy limits, including tailgating under-counts.
Does it handle pedestrians?
Yes — a crossing button queues a pedestrian phase serviced at the next safe point, with the service logged on the dashboard.
What about emergency vehicles?
A priority input holds the emergency approach green and logs the preemption. The demo uses a switch; real siren/RF detection and certified conflict monitoring are discussed as deployment scope.
Is this project suitable for a final-year project?
Yes — for Electronics and Telecommunication programs. It covers sensor-based counting, real-time state machines, adaptive control logic and a monitoring dashboard with honest deployment notes, all strong viva material. Suitable for B.E./B.Tech final-year projects in Electronics and Telecommunication.
Components & software requirements
- Arduino Mega 2560
- IR sensor modules x8 (approach pairs)
- 4-way LED signal head model
- Pedestrian crossing button + indicators
- ESP8266/ESP32 telemetry link (dashboard)
- Web dashboard (junction schematic)
- 4-way junction demonstration model
- Emergency override switch (demo)
Delivery information
Built-to-order project. Delivery timeline is shared after order confirmation based on current queue.
Support terms
Complete documentation, setup guide, and viva preparation included. Support for setup and explanation provided.