
More project photos (2)
The problem
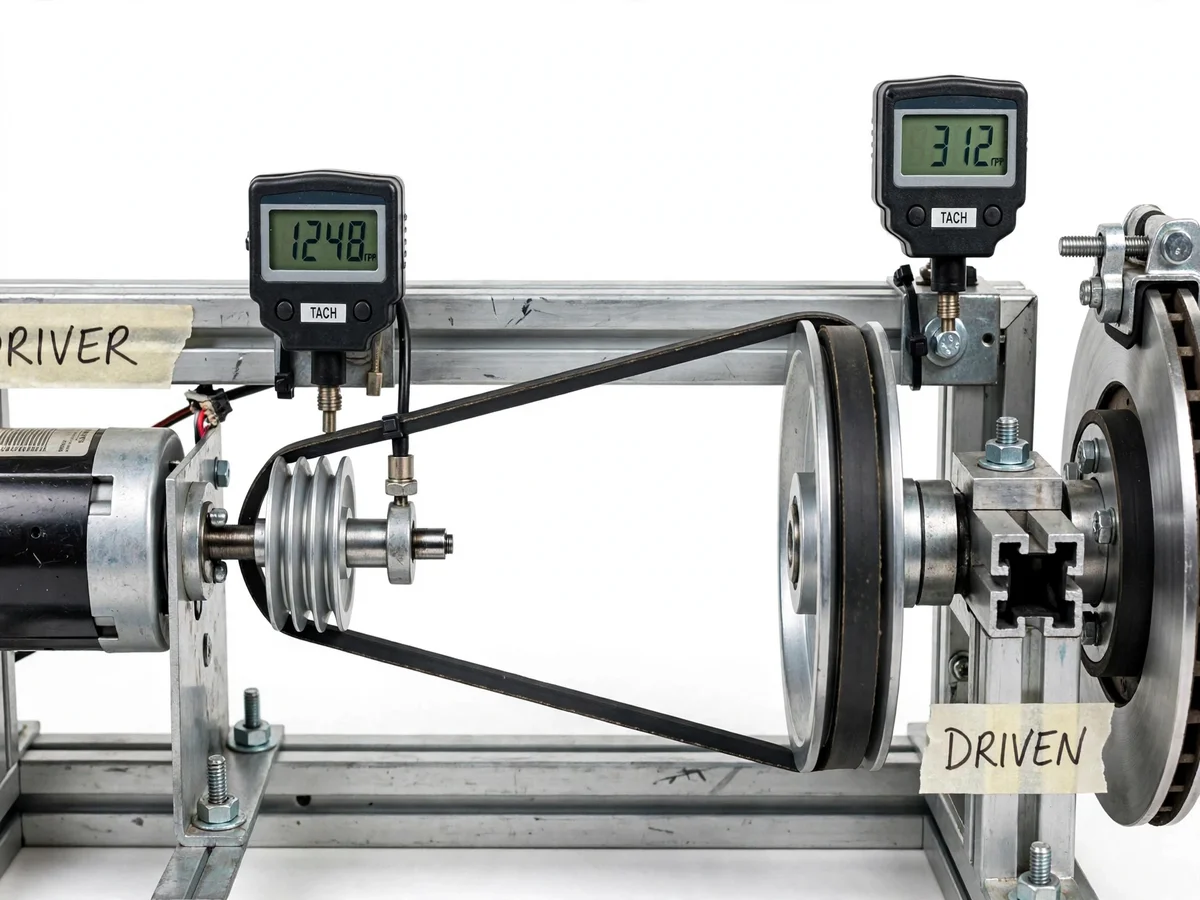
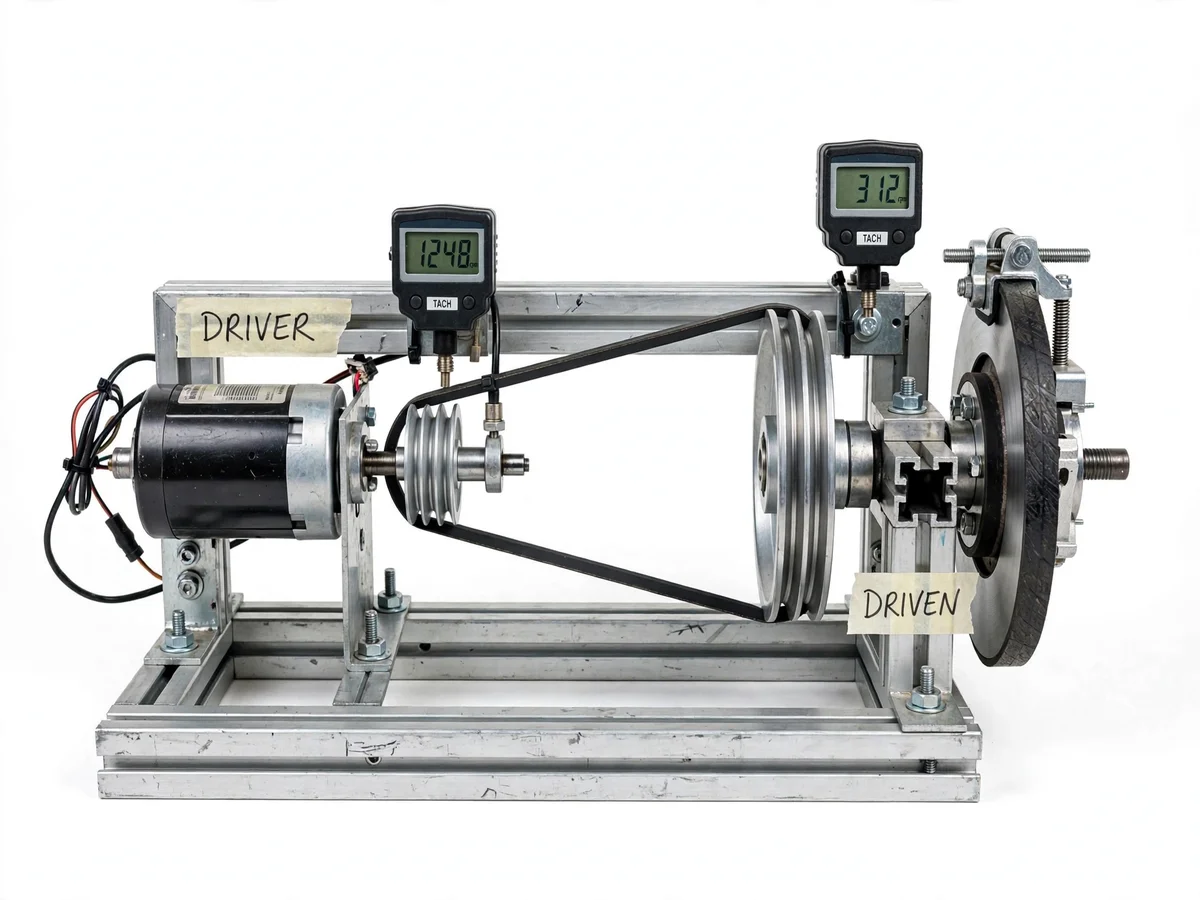
Belt drives are everywhere — workshop machines, vehicle accessories, agricultural equipment — and their theory fills pages: velocity ratio from pulley diameters, slip and creep, belt tensions, power transmission. On paper the ratio is a clean fraction; on a real drive the driven pulley always runs a touch slow, and that shortfall has a name and a cause. This project is a bench rig built to show it: a DC motor (driver) with a small multi-groove pulley, a V-belt running to a large driven pulley for approximately 4:1 reduction, two digital tachometers reading both shaft speeds simultaneously, and a disc brake with a caliper on the driven shaft for stopping and loading demonstrations. The student verifies the velocity ratio from the tachometer readings, computes slip against the theoretical ratio from pulley diameters, and studies how the brake load affects the drive.
How it works
- The DC motor spins the small driver pulley at its operating speed, read live on the driver tachometer.
- Friction between the belt and the pulley grooves carries the motion to the large driven pulley.
- Because the driven pulley's diameter is roughly four times the driver's, it turns at roughly one quarter of the motor speed — the velocity ratio.
- The driven tachometer displays the output RPM beside the driver reading, so the ratio is visible at a glance.
- Comparing the measured ratio with the diameter-based theoretical ratio reveals slip, which the student computes and reports.
- Squeezing the disc-brake caliper loads the driven shaft: the student watches the output RPM dip and the slip figure change under load.
- Shifting the belt to a different driver groove changes the reduction, and the whole measurement repeats for the new setting.
Tech stack:
- DC motor (driver)
- Multi-groove driver pulley and large driven pulley
- V-belt drive
- Two digital tachometers (RPM)
- Disc brake with caliper
- Aluminium extrusion frame
- Motor speed controller
| Parameter | Value |
|---|---|
| Reduction | Approximately 4:1 driver-to-driven (design target) |
| Driver speed | Approximately 1200–1300 RPM typical (tachometer-observed) |
| Driven speed | Approximately 300–330 RPM typical (tachometer-observed) |
| Measurement | Dual digital tachometers, RPM readout |
| Brake | Disc with mechanical caliper on driven shaft |
| Settings | Stepped driver pulley, multiple ratios (design) |
| Frame | Aluminium extrusion chassis (design) |
Project features
- [Approximately 4:1 belt reduction] A small driver pulley and large driven pulley give a visible, measurable speed reduction across the V-belt.
- [Dual digital tachometers] Independent RPM readouts on the driver and driven shafts, displayed side by side for direct ratio comparison.
- [Velocity-ratio verification] A buyer-run procedure comparing the measured RPM ratio against the theoretical ratio from pulley diameters.
- [Belt-slip measurement] The shortfall between theoretical and measured ratio is quantified as slip — the classic belt-drive phenomenon, measured honestly.
- [Disc brake on output shaft] A brake disc with a caliper on the driven shaft demonstrates stopping and lets the student load the drive.
- [Stepped driver pulley] Multiple grooves on the driver pulley allow the belt to be shifted for different reduction settings.
- [Rigid aluminium frame] An extrusion chassis holds shaft alignment, so the belt tracks true and readings repeat.
What is included
- Complete fabricated belt-drive rig with motor, pulleys, belt and brake
- Two digital tachometers fitted to driver and driven shafts
- Motor speed controller
- Ratio, slip and brake-effect measurement procedures (buyer-run)
- Project report PDF (belt-drive theory, ratio, slip, brake analysis, results)
- PPT presentation for final review
- Viva Q&A preparation document (velocity ratio, slip vs creep, belt tensions, braking)
Limitations & prerequisites
- The 4:1 ratio and the RPM figures are design targets confirmed by the student's own tachometer readings, not pre-claimed measurements.
- Slip varies with belt tension, load and wear — the report presents the student's measured range honestly rather than a single fixed number.
- The brake is a demonstration caliper for stopping and loading studies, not a rated industrial brake.
- Belt tension needs periodic checking per the maintenance note; a slack belt invalidates the ratio readings.
- The rig demonstrates open belt drive; crossed-belt and quarter-twist configurations are theory-only in the report.
Frequently Asked Questions
How is the velocity ratio verified?
Read both tachometers with the drive running unloaded, divide driver RPM by driven RPM, and compare with the theoretical ratio from the two pulley diameters. The procedure walks through the arithmetic with the student's own readings.
What is belt slip and how do I measure it?
Slip is the percentage shortfall of the measured ratio against the theoretical one — the belt creeps slightly on the pulleys instead of gripping perfectly. It is computed directly from the two tachometer readings, and the report explains why it grows under brake load.
What does the disc brake add?
It puts a controllable load on the driven shaft. The student watches output RPM fall and slip rise as braking increases — the drive's behavior under load, which is the interesting half of belt-drive theory.
Why two tachometers instead of one?
Ratio and slip need both shaft speeds at the same instant under the same conditions. Two fixed tachometers give a simultaneous, unambiguous reading pair — no stopwatch math required.
Can the reduction be changed?
Yes — the driver pulley is stepped, so moving the belt to a different groove changes the diameter ratio. Each setting gets its own ratio-and-slip measurement in the report.
Is this project suitable for a final-year project?
Yes — for Mechanical Engineering programs. It turns belt-drive theory into measured reality: velocity ratio, slip, loading and braking, all from the student's own instruments. Suitable for B.E./B.Tech final-year projects in Mechanical Engineering.
Components & software requirements
- DC motor (driver)
- Multi-groove driver pulley and large driven pulley
- V-belt drive
- Two digital tachometers (RPM)
- Disc brake with caliper
- Aluminium extrusion frame
- Motor speed controller
Delivery information
Built-to-order project. Delivery timeline is shared after order confirmation based on current queue.
Support terms
Complete documentation, setup guide, and viva preparation included. Support for setup and explanation provided.