
More project photos (2)
The problem
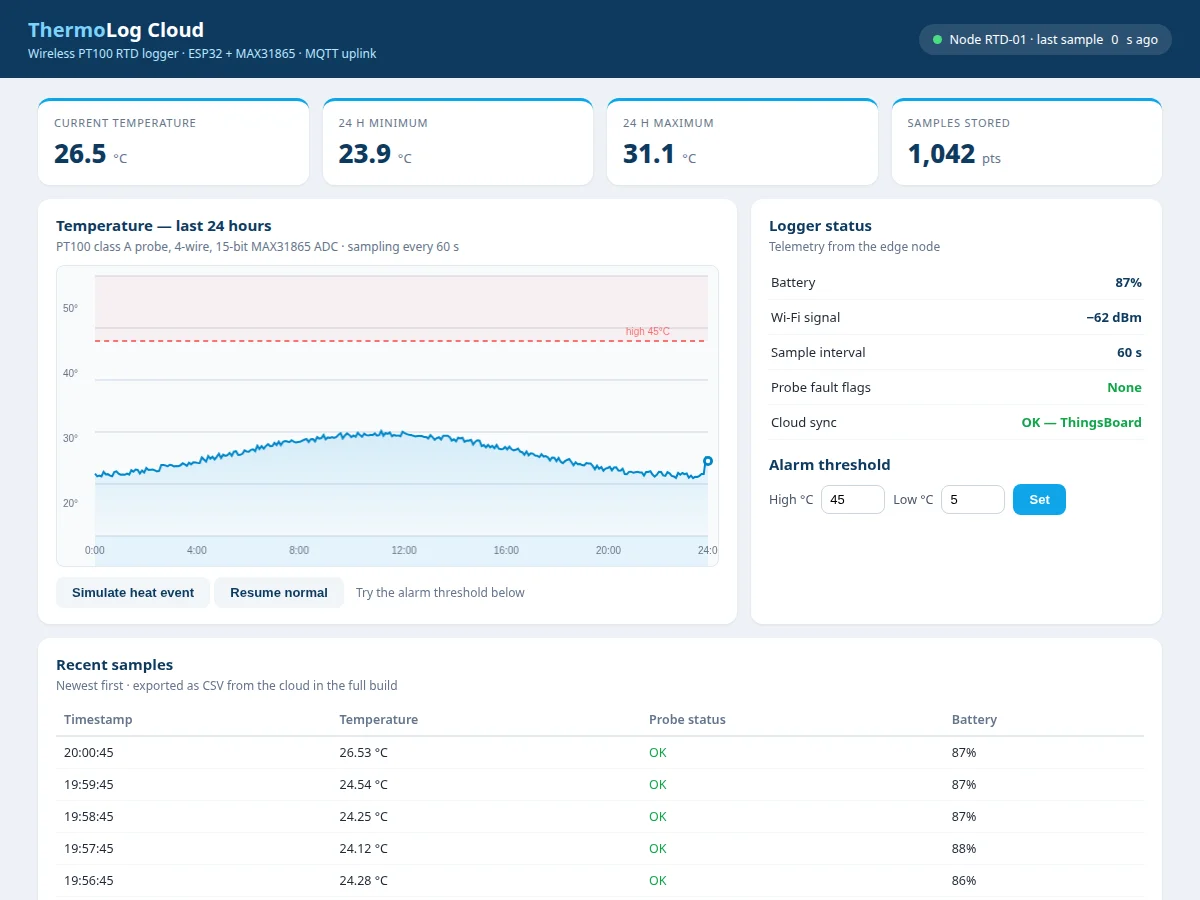
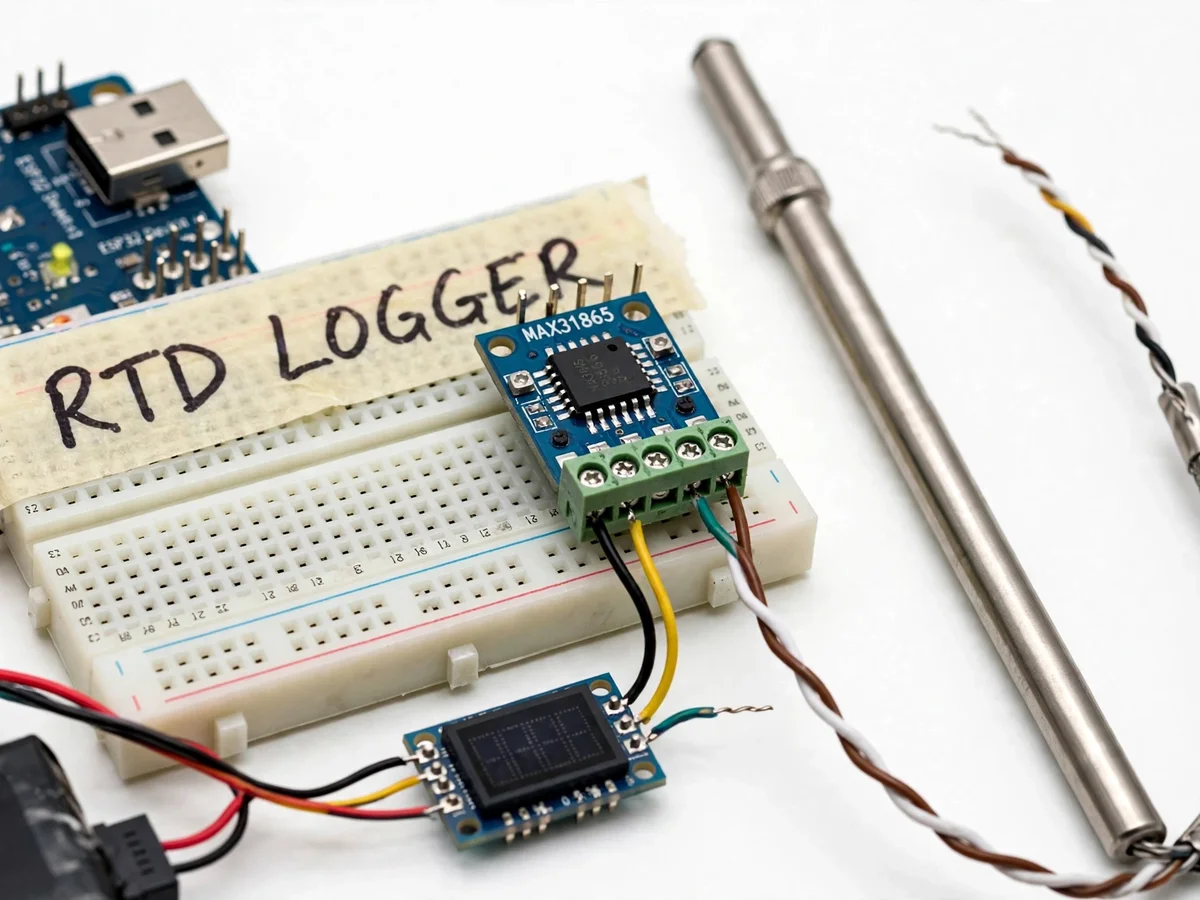
RTDs are the workhorses of accurate temperature measurement — a PT100 element's resistance changes almost linearly with temperature, and in a 4-wire connection the lead resistance cancels out for high precision. The MAX31865 converts that resistance directly to digital with 15-bit resolution and built-in fault detection for open or shorted probes. This project turns those parts into a complete wireless logging chain: the ESP32 wakes every 60 seconds, reads the probe, publishes the reading with battery and signal telemetry over MQTT, and sleeps again to stretch battery life. The cloud dashboard renders the live value, a 24-hour chart with alarm threshold bands, statistics cards and a downloadable-style sample table. Cold-chain boxes, labs and server rooms all need exactly this kind of continuous record.
How it works
- Every 60 seconds the ESP32 wakes from deep sleep and powers the MAX31865 RTD-to-digital converter.
- The PT100 resistance is read over SPI at 15-bit resolution; temperature is computed with Callendar–Van Dusen linearization and the converter's fault register is checked.
- The reading is bundled with battery voltage and Wi-Fi RSSI and published over MQTT with a timestamp.
- The node returns to deep sleep until the next interval, keeping average current in the microamp range as a design target.
- The cloud side stores the time series and serves the dashboard: live value, 24-hour chart with threshold bands, statistics and the sample table.
- When a reading crosses a configured threshold, the dashboard raises an alert and queues a notification.
Tech stack:
- ESP32 (deep-sleep scheduler, SPI, Wi-Fi)
- PT100 RTD probe, 4-wire, Class A
- MAX31865 RTD-to-digital converter
- 0.96" OLED (local readout)
- MQTT telemetry
- Cloud dashboard (HTML/CSS/JS)
| Parameter | Value |
|---|---|
| Sensor | PT100, 4-wire, Class A |
| ADC | MAX31865, 15-bit, SPI |
| Accuracy | ±0.5 °C (design target, ice-point verified by buyer) |
| Sample interval | 60 s (configurable) |
| Battery life | Multi-day on Li-ion (design target, verified in build) |
| Wireless | Wi-Fi MQTT uplink |
| Dashboard | Browser-based cloud charts, alarms, sample table |
| Fault detection | Open/short probe flags via MAX31865 |
Project features
- [Precision RTD front end] 4-wire PT100 (Class A) read by the MAX31865 at 15-bit resolution with automatic open/short fault flags from the converter's fault register.
- [Deep-sleep power design] The ESP32 sleeps between 60-second samples, waking only to measure and transmit — the standard technique for multi-day battery logging.
- [Cloud dashboard] Live temperature, 24-hour min/max/average cards, a 24-hour chart with high/low threshold bands and a recent-samples table, all in the browser.
- [Configurable alarms] High and low thresholds set from the dashboard trigger visible alerts and push-style notifications when crossed.
- [Node telemetry] Battery percentage, Wi-Fi signal strength, sample interval and probe fault status are reported alongside every reading.
- [Heat-event simulation] A dashboard control drives the reading high to demonstrate the full alarm path end to end during the viva.
- [Local OLED readout] The node shows the last reading and battery level on a small OLED for bench debugging without the cloud.
What is included
- Complete logger prototype (ESP32, MAX31865, PT100 probe, OLED, battery)
- Low-power firmware (deep sleep, SPI readout, MQTT uplink)
- Cloud dashboard (live value, 24-h chart, alarms, sample table)
- Wiring diagram and ice-point calibration procedure
- Project report PDF (RTD theory, linearization, power design, results)
- PPT presentation for final review
- Viva Q&A preparation document (RTDs, 4-wire sensing, deep sleep, MQTT)
Limitations & prerequisites
- ±0.5 °C is a design target, not a calibrated claim — the report documents the ice-point check procedure the buyer runs to verify it.
- Battery-life figures are design targets dependent on Wi-Fi conditions and sample interval; the build measures and documents actual current in the report.
- Single probe per node; multi-point monitoring needs additional nodes (future scope).
- Requires Wi-Fi coverage at the logging location; offline SD-card backup is future scope.
- Cloud components assume a reachable MQTT broker; the dashboard demo can also run against a local broker.
Frequently Asked Questions
Why an RTD instead of a cheap digital sensor?
RTDs like the PT100 are the industrial standard for accuracy and stability: nearly linear response, excellent long-term drift performance, and standardized interchangeability. A 4-wire connection cancels lead resistance, which is exactly the precision technique this project teaches — a digital sensor would hide all of that.
What does the MAX31865 do?
It is a dedicated RTD-to-digital converter: it excites the PT100, measures its resistance with a 15-bit ADC, and reports temperature-ready data plus fault flags (open/short probe) over SPI. Using it avoids building a precision analog front end from op-amps.
How does deep sleep extend battery life?
The ESP32 spends ~59.9 of every 60 seconds in deep sleep drawing microamps, waking only to power the converter, take a reading, transmit it, and sleep again. The report includes a measured current profile so the battery-life claim is documented, not guessed.
How are alarms delivered?
Thresholds are set on the dashboard; when a reading crosses one, the dashboard shows a prominent alert banner and the system queues a notification. The heat-event simulation button lets you demonstrate the whole path live.
Can it log without Wi-Fi?
As delivered it needs Wi-Fi for the cloud path. An on-device SD-card backup for offline operation is documented as future scope.
Is this project suitable for a final-year project?
Yes — for Electronics and Telecommunication programs. It covers precision sensing, SPI interfacing, low-power embedded design, wireless telemetry and cloud dashboards in one coherent build. Suitable for B.E./B.Tech final-year projects in Electronics and Telecommunication Engineering.
Components & software requirements
- ESP32 (deep-sleep scheduler, SPI, Wi-Fi)
- PT100 RTD probe, 4-wire, Class A
- MAX31865 RTD-to-digital converter
- 0.96" OLED (local readout)
- MQTT telemetry
- Cloud dashboard (HTML/CSS/JS)
Delivery information
Built-to-order project. Delivery timeline is shared after order confirmation based on current queue.
Support terms
Complete documentation, setup guide, and viva preparation included. Support for setup and explanation provided.