
More project photos (2)

The problem
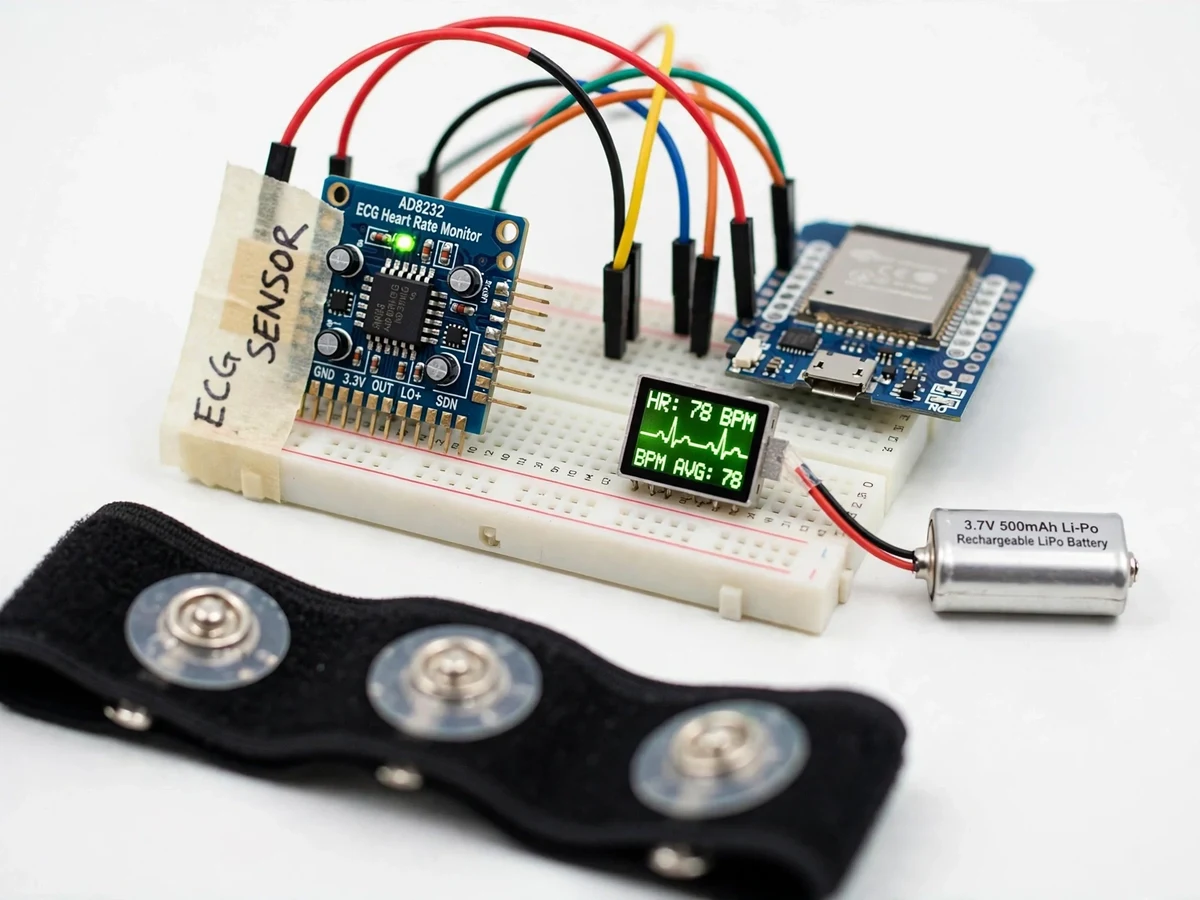
Heart problems rarely announce themselves during a doctor's visit — they show up during the other 23 hours of the day, when nobody is recording. A wearable ECG monitor bridges that gap by continuously capturing the heart's electrical signal, and it is a superb electronics project because it forces the student through the whole analog-to-cloud chain: microvolt biopotential pickup, instrumentation amplification and filtering, ADC sampling, mains-notch filtering, and real-time wireless streaming to a dashboard. This project builds exactly that: an AD8232 single-lead analog front-end (1100× gain, 0.5–40 Hz band) amplifies the chest-electrode signal, an ESP32 samples it at 360 Hz, and a web dashboard renders the live PQRST trace with R-peak detection, heart-rate and HRV computed on the fly. The on-device OLED gives instant BPM feedback. The scope is stated plainly: an educational prototype for learning biomedical signal acquisition — not a diagnostic instrument.
How it works
- Three gel electrodes on the adjustable chest band (RA, LA, RL) pick up the heart's microvolt electrical signal.
- The AD8232 front-end amplifies it 1100× and band-limits it to 0.5–40 Hz, rejecting electrode offset and high-frequency noise.
- The ESP32 samples the amplified output at 360 Hz with its 12-bit ADC and applies a 50 Hz mains notch plus baseline-wander removal in firmware.
- A QRS detector finds R peaks; heart rate is computed from R-R intervals and HRV (SDNN) is accumulated over a rolling 60-second window.
- Every 250 ms the ESP32 streams a packet (raw samples + BPM + signal-quality flag) over Wi-Fi to the web dashboard.
- The dashboard renders the live trace with R-peak markers, the heart-rate trend, HRV and the event log; sessions export to CSV.
- The on-device OLED mirrors the current BPM and a trace snippet for phone-free use.
Tech stack:
- AD8232 ECG analog front-end (1100× gain, datasheet)
- ESP32 devkit (12-bit ADC @ 360 Hz, Wi-Fi streaming)
- 3-lead chest electrodes + adjustable band
- 0.96" OLED display (on-device BPM)
- 1000 mAh Li-Po battery
- Pan-Tompkins-style QRS detection (firmware)
- Live web dashboard (HTML/CSS/JS, WebSocket)
- CSV session export
| Parameter | Value |
|---|---|
| Front-end | AD8232, 1100× gain, 0.5–40 Hz band (datasheet) |
| Sampling | 360 Hz, 12-bit ADC (ESP32) |
| Heart-rate accuracy | ±3 BPM (design target) |
| Streaming latency | < 500 ms over local Wi-Fi (expected) |
| Battery | 1000 mAh Li-Po, ~14 h streaming (design target) |
| Display | 0.96" OLED on device + web dashboard |
| Range | Wi-Fi local network |
| Scope | Educational prototype — NOT a medical device |
Project features
- [AD8232 analog front-end] Single-lead ECG amplification with 1100× gain and 0.5–40 Hz band filtering (datasheet values), designed for three chest electrodes (RA, LA, RL).
- [360 Hz sampling] The ESP32's 12-bit ADC samples the amplified signal at 360 Hz — the same rate as the classic MIT-BIH reference recordings — with a 50 Hz mains notch in firmware.
- [Live web dashboard] Streams the ECG trace in real time with R-peak markers, current BPM, HRV (SDNN over 60 s), session heart-rate trend and an event log.
- [On-device OLED] A 0.96" OLED on the band shows the live trace snippet and current BPM, so the device works without a phone in range.
- [R-peak detection] A Pan-Tompkins-style QRS detector runs in firmware; heart rate is computed from R-R intervals with a design-target accuracy of ±3 BPM.
- [Motion-artifact handling] Baseline wander is filtered and the dashboard flags noisy segments as poor signal quality instead of reporting fake heart rates.
- [Session export] Sessions can be exported as CSV (timestamp + ADC value) for offline analysis in the report.
- [Rechargeable wearable design] A 1000 mAh Li-Po powers about 14 hours of streaming (design target) in a comfortable adjustable chest band.
What is included
- Working wearable prototype (chest band, electrodes, AD8232, ESP32, OLED, battery)
- ESP32 firmware (sampling, filtering, QRS detection, Wi-Fi streaming)
- Live web dashboard with trace, analytics and CSV export
- Wiring diagram and assembly guide
- Project report PDF (biopotential background, signal-chain design, methodology, evaluation)
- PPT presentation for final review
- Viva Q&A preparation document (AD8232, sampling theory, QRS detection, HRV)
Limitations & prerequisites
- This is an educational prototype, NOT a certified medical device — readings must never be used for diagnosis or treatment decisions. This is stated on the page, the dashboard and the report.
- ±3 BPM heart-rate accuracy is a design target, honestly stated — the report documents measured values after the prototype is tested.
- Single-lead ECG cannot show what a 12-lead clinical ECG shows; arrhythmia analysis is out of scope.
- Motion artifacts degrade the trace during exercise; the device is designed for rest or light activity.
- ~14 h battery life is a design target under continuous streaming; actual life depends on Wi-Fi conditions.
Frequently Asked Questions
Is this a medical device?
No — emphatically not. It is an educational prototype for learning how ECG signals are acquired and processed. It is not certified, not calibrated for clinical use, and its readings must never guide diagnosis or treatment.
How does the ECG signal get from chest to dashboard?
Three gel electrodes pick up microvolt signals, the AD8232 amplifies them 1100×, the ESP32 samples at 360 Hz, and Wi-Fi streams packets every 250 ms to the dashboard — the full analog-to-cloud chain.
What is R-peak detection?
The QRS complex (the tall spike in each heartbeat) is found by a Pan-Tompkins-style detector in firmware; the time between consecutive R peaks gives the heart rate, and the variation between them gives HRV.
Are the ±3 BPM numbers measured?
No — a design target for the built-to-order prototype, stated honestly. The report documents the measured accuracy after testing against a reference pulse reading.
Can it detect heart problems?
No — and the project makes no such claim. Single-lead, uncertified hardware is for learning signal acquisition, not for spotting arrhythmias. Any abnormal reading means "see a doctor", full stop.
Is this project suitable for a final-year project?
Yes — for Electronics, E&TC and instrumentation/biomedical-adjacent programs. It covers analog front-ends, ADC sampling, digital filtering, embedded firmware and a real-time dashboard. Suitable for B.E./B.Tech final-year projects in Electronics, E&TC and Biomedical Instrumentation.
Components & software requirements
- AD8232 ECG analog front-end (1100× gain, datasheet)
- ESP32 devkit (12-bit ADC @ 360 Hz, Wi-Fi streaming)
- 3-lead chest electrodes + adjustable band
- 0.96" OLED display (on-device BPM)
- 1000 mAh Li-Po battery
- Pan-Tompkins-style QRS detection (firmware)
- Live web dashboard (HTML/CSS/JS, WebSocket)
- CSV session export
Delivery information
Built-to-order project. Delivery timeline is shared after order confirmation based on current queue.
Support terms
Complete documentation, setup guide, and viva preparation included. Support for setup and explanation provided.